Topley’s Top Ten – April 30, 2018

1.Corporate Lobbying is Big Business and It Shows Up in Returns.

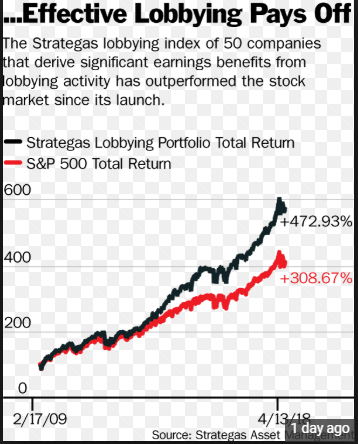
About 10 years ago, Strategas devised a “lobbying” index of companies that get the most bang for their lobbying buck, including interactions with regulators. The index, it says, has outperformed the Standard & Poor’s 500 for nearly a decade by an average of almost five percentage points annually. The lobbying index returned an average 14.4% annually from its 2009 launch through April 13, versus 9.5% for the S&P 500. About $1 billion of assets are pegged to the performance of the Strategas index.

https://www.barrons.com/articles/lobbying-index-beats-the-market-1524863200

 https://www.barrons.com/articles/lobbying-index-beats-the-market-1524863200

Continue reading →

Topley’s Top Ten – April 16, 2018

1.Chinese Venture Funding is 15x 2013 Levels….2017 Saw Almost Equal Funding to U.S.

Silicon Valley Powered American Tech Dominance—Now It Has a Challenger

An exclusive WSJ analysis shows how venture-capital investment from Asia is skyrocketing, threatening to shift power over innovation

By Phred Dvorak and Yasufumi Saito

Silicon Valley, long the undisputed king of venture capital, is now sharing its throne with Asia.

A decade ago, nearly three-quarters of the world’s financing of innovative, tech-heavy startups and young companies took place in the U.S., with American investors plowing money into mostly U.S.-based venture firms.

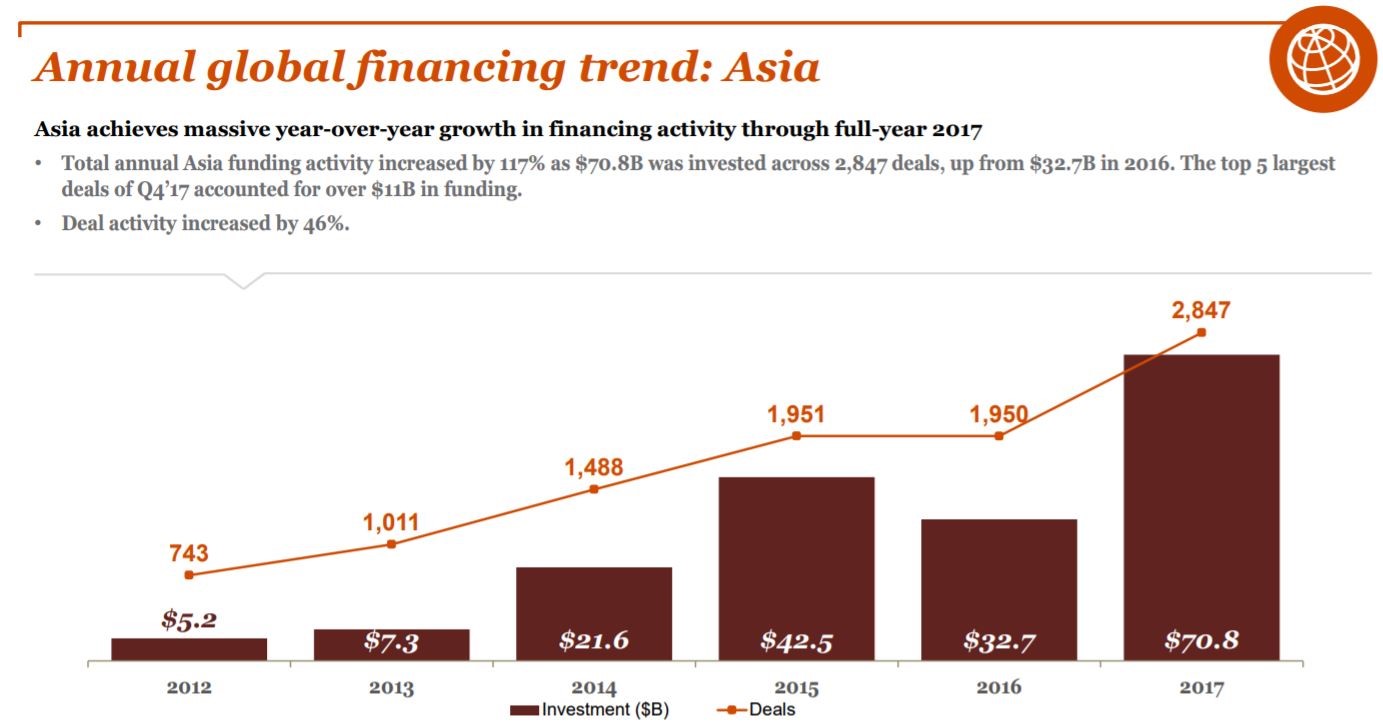
Now, a surge of new money—mostly from China—has helped drive funding totals into the stratosphere and has transformed the venture landscape, according to an exclusive Wall Street Journal analysis of venture funding data.

Asian investors directed nearly as much money into startups last year as American investors did—40% of the record $154 billion in global venture financing versus 44%, the Journal’s analysis of data from private markets data tracker Dow Jones VentureSource found. Asia’s share is up from less than 5% just 10 years ago.

https://www.wsj.com/articles/silicon-valley-long-dominated-startup-fundingnow-it-has-a-challenger-1523544804?mod=ITP_pageone_0&tesla=y

Continue reading →

Topley’s Top Ten – April 11, 2018

1.Interesting …Not Sure If Tech Fits this Bucket

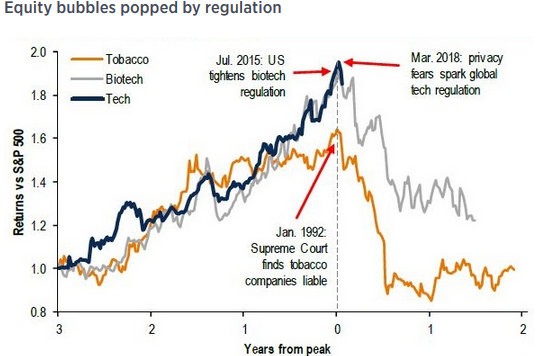
“Tobacco (1992), financial (2010), biotech (2015) industries illustrate how waves of regulation can lead to investment underperformance” noted BofA – “As Facebook has grown, people everywhere have gotten a powerful new tool to stay connected to the people they love, make their voices heard, and build communities and businesses,” Mr. Zuckerberg says, in prepared testimony released by a House committee on Monday. “But it’s clear now that we didn’t do enough to prevent these tools from being used for harm as well.”

From Dave Lutz at Jones

Continue reading →

Topley’s Top Ten – April 5, 2018

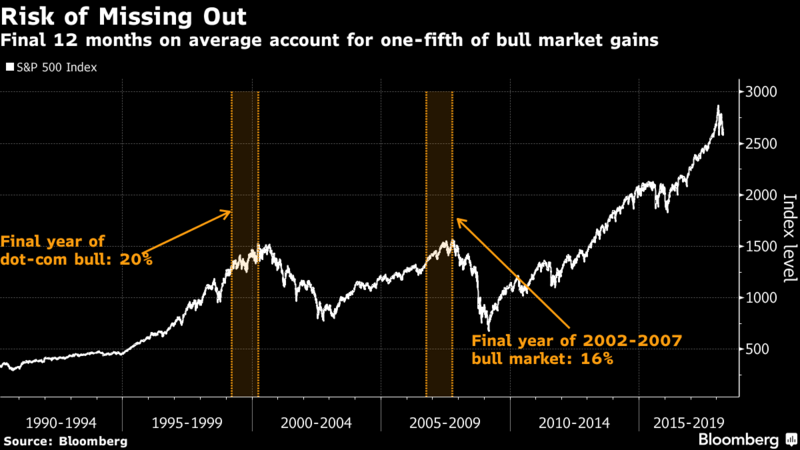
1.Another Reminder of How Tough it is to Time Markets…..Final 12 Months of Bull Account for One-Fifth of Gains.

Behind it all are facts of investing known well by anyone who sold after Brexit, the U.S. election, or five market corrections since 2009 that look just like this. One, it’s hard to see the end of things. Two, a lot of money is made at the top. Three, you miss any payoff in equities right now at grave risk to your career.

“It can be 6 or 8 percent costly, or even 10 percent costly” if you bail too soon, said John Augustine, chief investment officer for Huntington Private Bank in Columbus, Ohio, in an interview at Bloomberg’s New York headquarters. “That can mean a lot to folks in a 2 percent nominal world.”

It can actually mean more. A study by Bank of America Corp. on market peaks since 1937 shows that being uninvested in the last year of an advance meant foregoing one-fifth of the rally’s overall return. While every episode is different, that math translates into additional 470 points in the S&P 500, if the bull market goes on for another year.

Crash Course in Market Timing Shows Cost of Being Wrong at Tops

By Lu Wang
and Sarah Ponczek

https://www.bloomberg.com/news/articles/2018-04-05/crash-course-in-market-timing-shows-cost-of-being-wrong-at-tops

Continue reading →

Topley’s Top Ten – March 29, 2018

1.Dwindling Public Stock….In the Past 20 Years, U.S. Companies Purchased Back $3.6 Trillion More Than They Offered

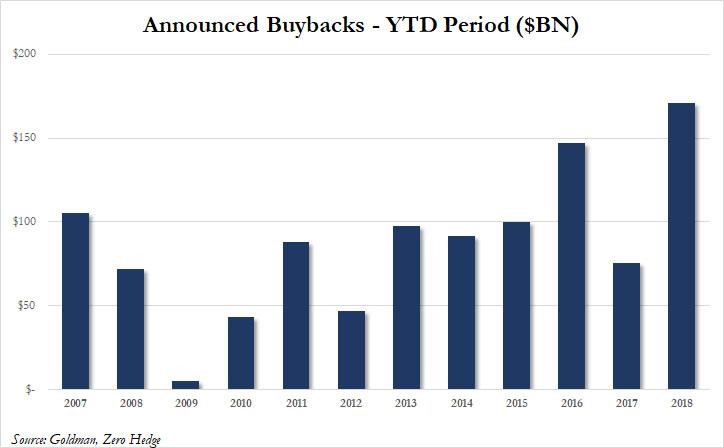
Over the past two decades, U.S. companies bought back vastly more stock than they issued. On net, according to a new paper by Craig Doidge and colleagues, companies purchased $3.6 trillion more stock than they offered. Stock buybacks are a perfectly appropriate way to return value to shareholders, but the disparity is still surprising.

https://www.uschamberfoundation.org/blog/post/are-capital-markets-healthy-some-thoughts-corporate-concentration-and-dwindling-public
Found at Abnormal Returns Blog  www.abnormalreturns.com

Continue reading →

Topley’s Top Ten – March 28, 2018

1.This Week is the Largest Supply of U.S. Debt Sales Ever. 

 A Big Test for BondsThis week’s planned $294 billion of U.S. debt sales — the largest slate of supply ever — point to “a volatile near-term path for the Treasury market,” according to Bank of Montreal. The auctions begin with Monday’s $30 billion two-year note sale, which will be the biggest since 2014.

https://www.bloomberg.com/news/articles/2018-03-26/-vulnerable-stocks-and-record-u-s-debt-sales-dominate-the-week

Continue reading →

Topley’s Top Ten – Short Version March 23, 2018

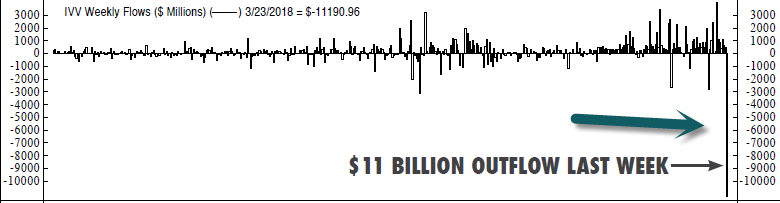
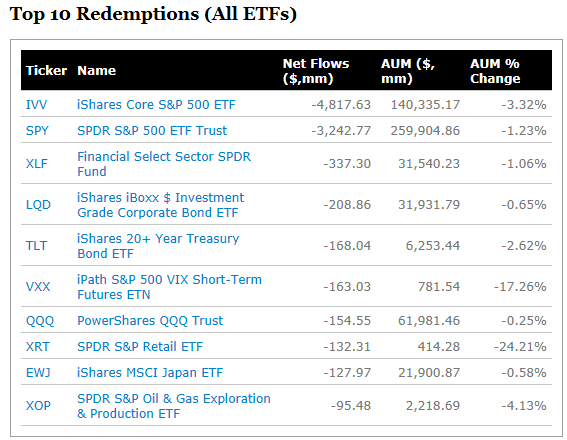
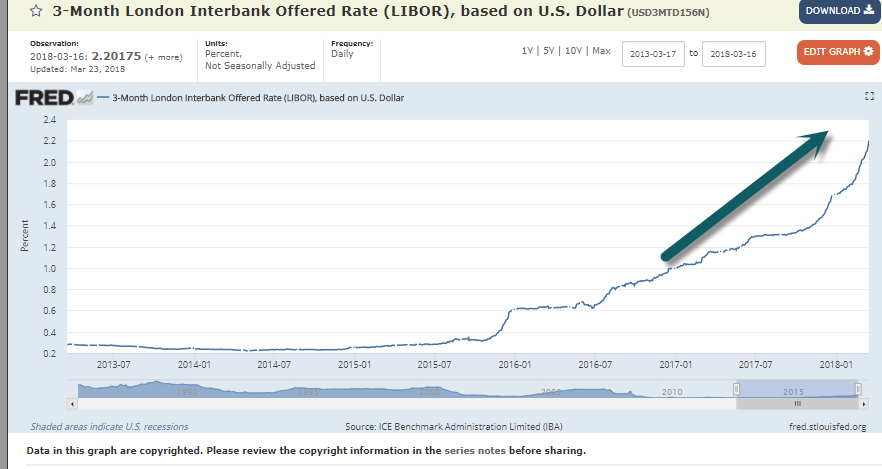
Loyola Chicago Added Volatility to Everyone’s NCAA Pool as Trade Wars Add Vol to Markets.

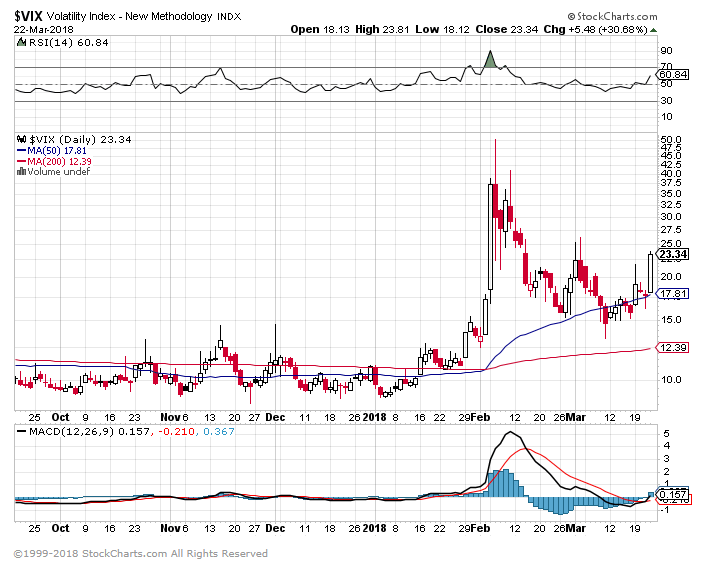
1.After No Volatility in 2017….Six Sessions of 20% Moves in VIX 2018.

Volatility has been extremely, well, volatile this year.

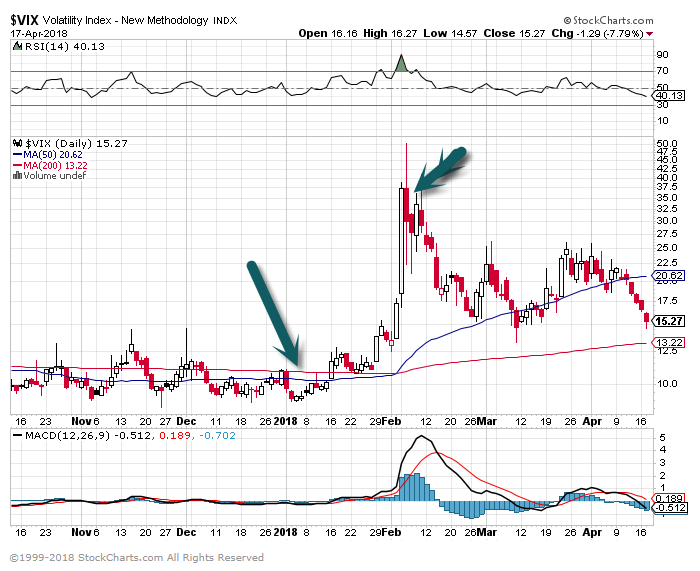
The Cboe Volatility Index VIX, -1.84%  has seen multiple days with extremely sharp moves so far in 2018, including on Thursday, when it jumped 30.7% to 23.35.

According to data from the WSJ Market Data Group, the so-called “fear index” has experienced six sessions this year that saw a jumped of least 20%, along with one day that saw a 20% drop. Notably, volatility more than doubled on Feb. 5, amid the start of a steep selloff in the U.S. stock market spurred by inflation concerns.

The tally of seven sessions stand as the most one-day 20% moves in a calendar year since 2014, when there were also seven throughout the entire year. Looking solely at the six 20% increases, the total is the most for a calendar year since 2015, when there were also six.

There’s been a historic amount of earthshaking stock-market volatility this year

By Ryan Vlastelica

https://www.marketwatch.com/story/theres-been-a-historic-amount-of-earthshaking-stock-market-volatility-this-year-2018-03-22

VIX Volatility Index in 2018

Continue reading →

Topley’s Top Ten – March 15, 2018

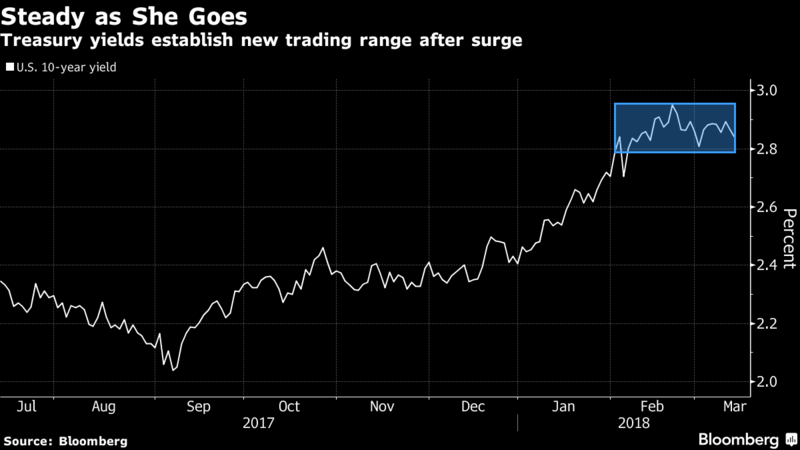
1.Treasuries Go Range Bound.

Range Trading

As for Treasuries themselves, they have settled into a new trading range after an almost 1 percentage point increase in the 10-year yield from September to late February. That stability has kept it from retesting the 3 percent level for now, a move above which is seen as a risk to many markets.

— With assistance by Andrew Janes, and Joanna Ossinger
https://www.bloomberg.com/

Wages Also Range Bound

Wages: Same As It Ever Was?

03/14/2018

Kevin Flanagan, Senior Fixed Income Strategist—Wisdom Tree

The jobless rate remained at 4.1% for the fifth consecutive month, which is the low watermark for this expansion. The alternate measure of job creation, civilian employment, has been surging thus far in 2018, producing a two-month average of just under +600,000.

Average Hourly Earnings

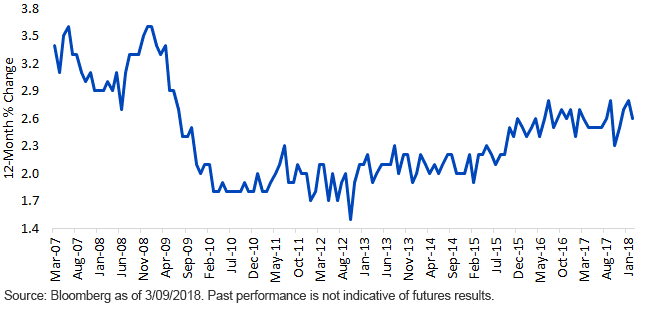
Let’s turn our attention to wages. Average hourly earnings (AHE) rose at an annual rate of +2.6% in February, following a downward revision of 0.1 percentage points for the prior month. In other words, the +2.9% surprise to the upside in January has now been dialed back a bit to +2.8%. Remember, one of the lynchpins behind the rise in the UST 10-Year yield this year was an increase in inflation expectations, led by said “January surprise.” The current pace leaves wages essentially “stuck in the mud,” at least for the time being, illustrated by the fact that the average year-over-year increase over the last two years has been that same +2.6% (see the graph).

Conclusion

So, when will that jobs trend translate to higher wages? According to the new Fed chair, a key force behind the frustrating lack of significant progress has been the result of “the weak pace of productivity growth in recent years.” Powell also stated that given the economic backdrop and strong job creation, he expects to see wages rising. This line of reasoning is definitely justified, but thus far, the results have been lacking. Nevertheless, there does seem to be an expectation that later this year, the annual rate of increase for AHE will eventually hit, and possibly eclipse, the +3.0% threshold. The bottom line is that, barring any unforeseen circumstances, the Fed will not be dissuaded from raising interest rates this year, a development expected for next week’s FOMC meeting.

Wisdomtree Blog
https://www.wisdomtree.com/blog/2018-03-14/wages-same-as-it-ever-was

Continue reading →

Topley’s Top Ten – March 12, 2018

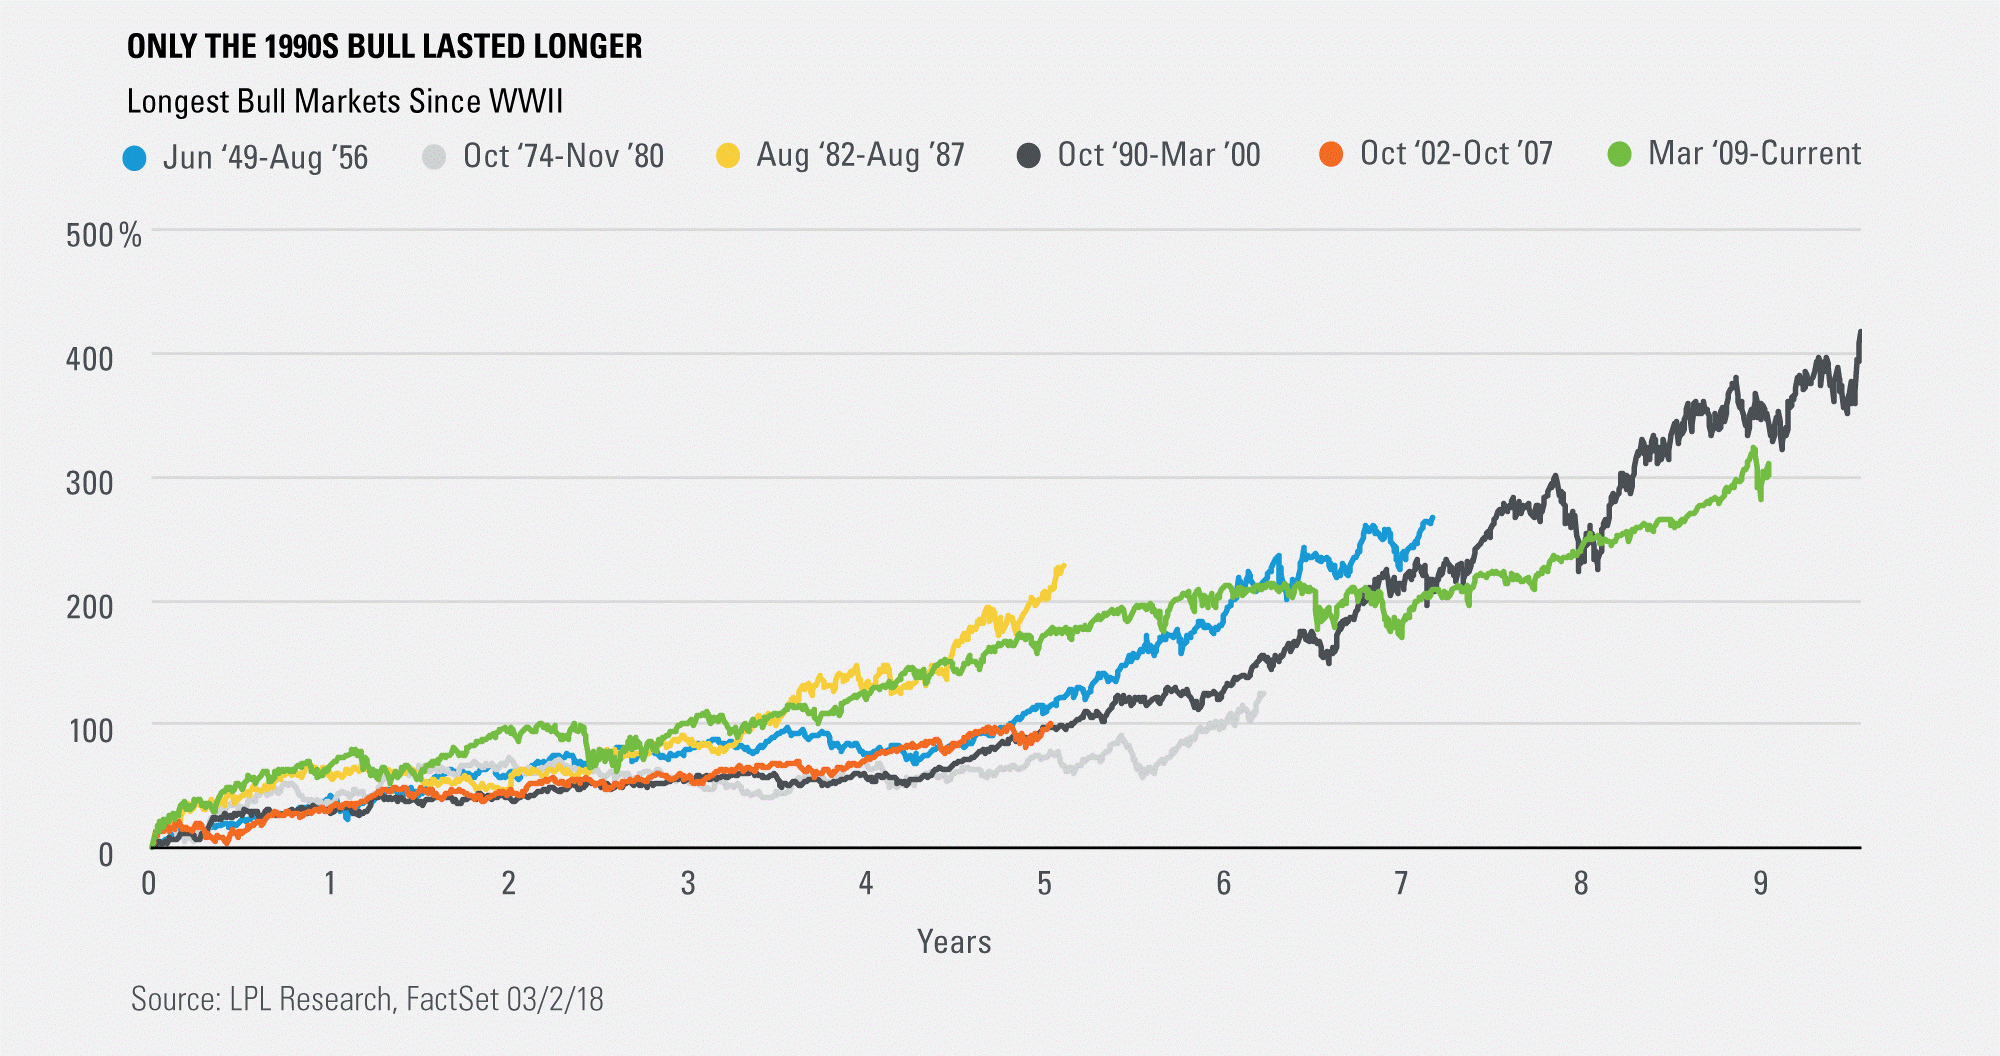
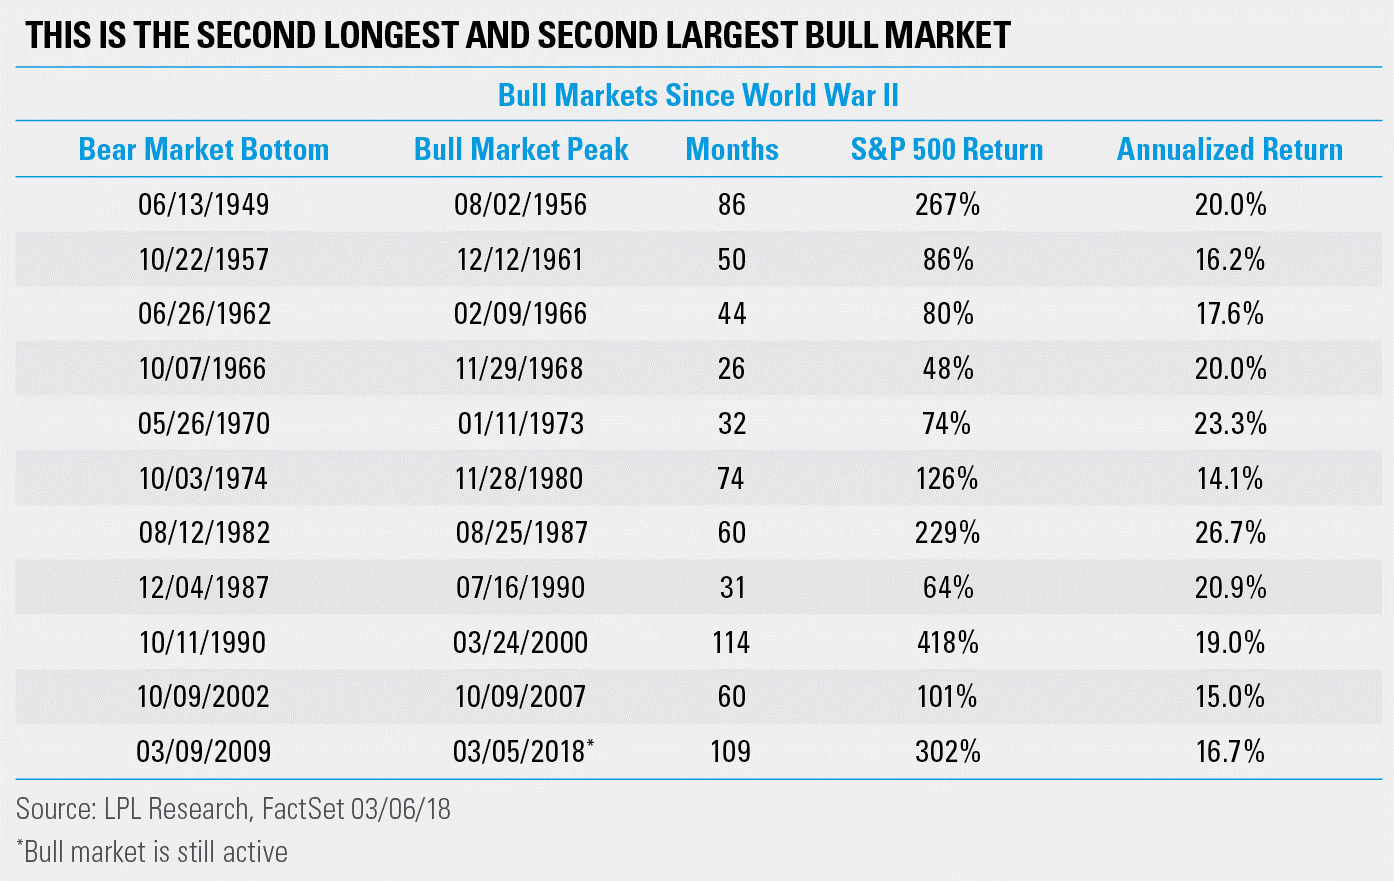
1.Where Does This Bull Market Rank? Second Largest and Second Longest.

Posted by lplresearch

We shared the following chart in our latest Weekly Market Commentary, “The Bull Is 9, Can It Make 10?”, which shows that this is the second largest and second longest bull market ever—with only the ‘90s bull standing in the way of the record books.

https://lplresearch.com/2018/03/07/where-does-this-bull-market-rank/

Continue reading →

Topley’s Top Ten – March 6, 2018

1.Semiconductors Record Year in 2017…Followed by 22.7% Jan. Gain in Sales.

Traditionally bullish indicator sector blows out sales….

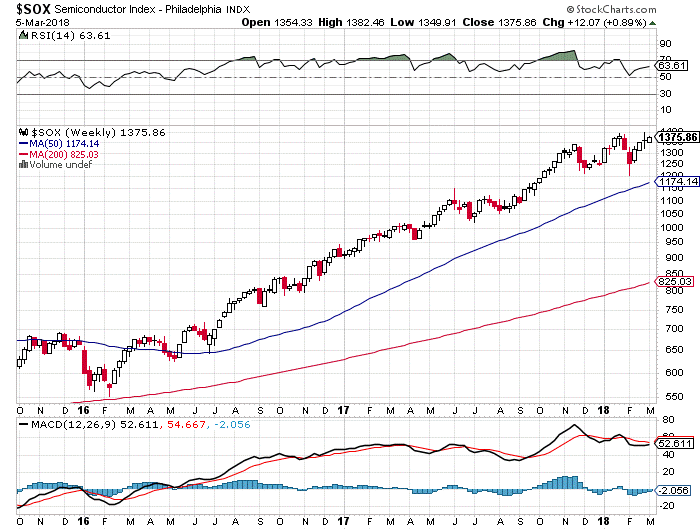
January sales of semiconductors topped records marking a year and a half of consecutive monthly gains, according to the Semiconductor Industry Association in a statement late Monday. January chip sales rose 22.7% to a record $37.6 billion, SIA said. Year-over-year sales in the Americas saw the largest rise with a gain of 40.6%, followed by Europe with a 19.9% rise, “Asia Pacific/All Other” seeing a 18.6% rise, China gaining 18.3%, and Japan rising 15.1%. “After notching its highest-ever annual sales in 2017, the global semiconductor industry is off to a strong and promising start to 2018, posting its highest-ever January sales and 18th consecutive month of year-to-year sales increases,” said John Neuffer, SIA president and chief executive, in a statement. Over the past 18 months, the PHLX Semiconductor Index SOX, +0.89%has grown 71%, compared with a 24% gain by the S&P 500 index SPX, +1.10% and a 39% gain on the Nasdaq Composite Index COMP, +1.00%

Semiconductor Index…More than a double from 2016 pullback.

https://www.marketwatch.com/story/january-chip-sales-reach-record-high-for-18th-month-of-straight-gains-2018-03-05

Continue reading →

Topley’s Top Ten – February, 27 2018

1.Buffet Warns on Margin Debt.

Warren Buffett offers his ‘strongest argument’ against a practice investors are doing in record numbers

Akin Oyedele

Berkshire Hathaway CEO Warren Buffett has argued against borrowing money to invest in stocks.

  • So-called margin debt rose to a record in January.
  • Margin calls, in which brokers demand a cash replenishment of their clients’ accounts, were among the reasons strategists cited for the pace of the recent stock sell-off.

Warren Buffett doesn’t recommend going into debt to buy stocks.

But that’s exactly what investors are doing in record numbers.

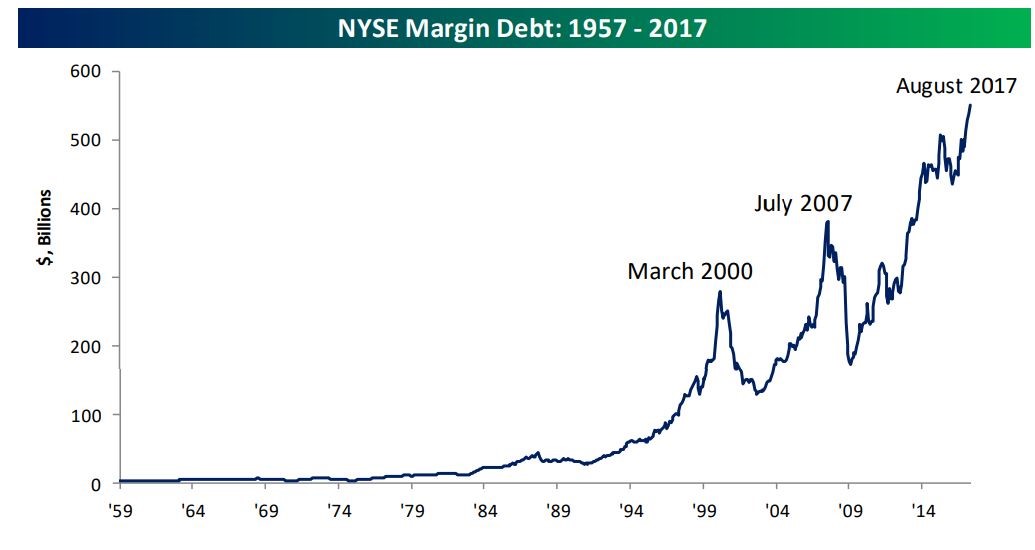
Margin-debt balances — loans individual investors take from their brokers to beef up their portfolios and maximize returns — rose to a record $665.72 billion in January, according to datafrom the Financial Industry Regulatory Authority.

http://www.businessinsider.com/warren-buffett-on-margin-debt-for-stocks-investing-2018-2

https://www.marketwatch.com/story/margin-debt-levels-are-a-poor-tool-for-timing-the-stock-market-2017-09-27

Continue reading →

Why This Correction Was Not the Big One

I am sharing with you an article I wrote on February 6, 2018,  regarding the Market change.  Below this article is my latest viewpoint…..

Keep Calm and Carry On

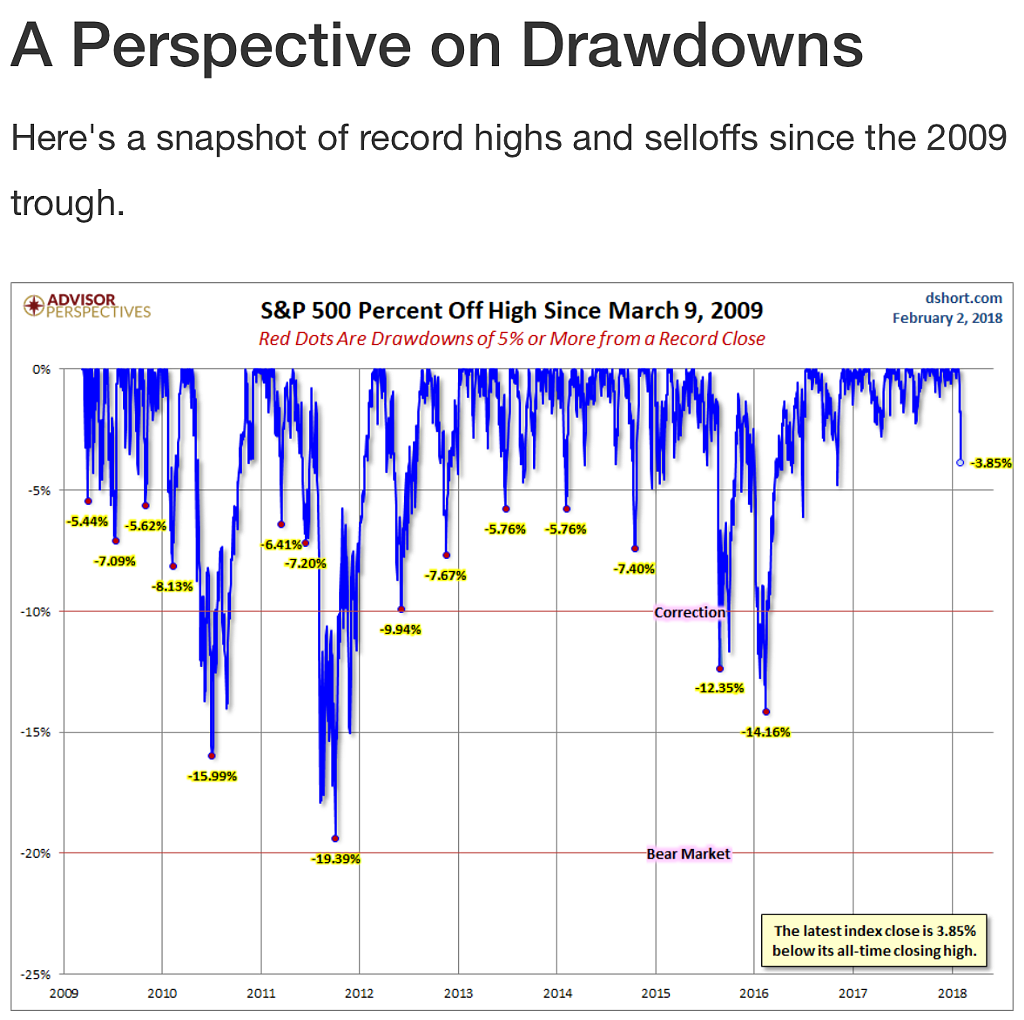
2017 was the anomaly, not the last 3 days. Over the last week, volatility started to happen as major market indices such as the S&P 500 and Dow Jones Industrial Average have fallen around 5%. Concerns over inflation and interest rates moving higher has spooked investors. Though the headlines (“Dow drops 1,000 points!”) may seem troubling, we want to remind our clients that this was to be expected, and in greater context of the last few years, it is a garden variety correction. It is also extremely important to remember that for the financial media, hype sells. The hyperbole driven headlines will be out in force today blasting the Dow’s biggest point drop in history. In percentage terms, it was the 33rd worse decline and there have been 358 prior 3% plus declines, but this was the worse session since 2011.

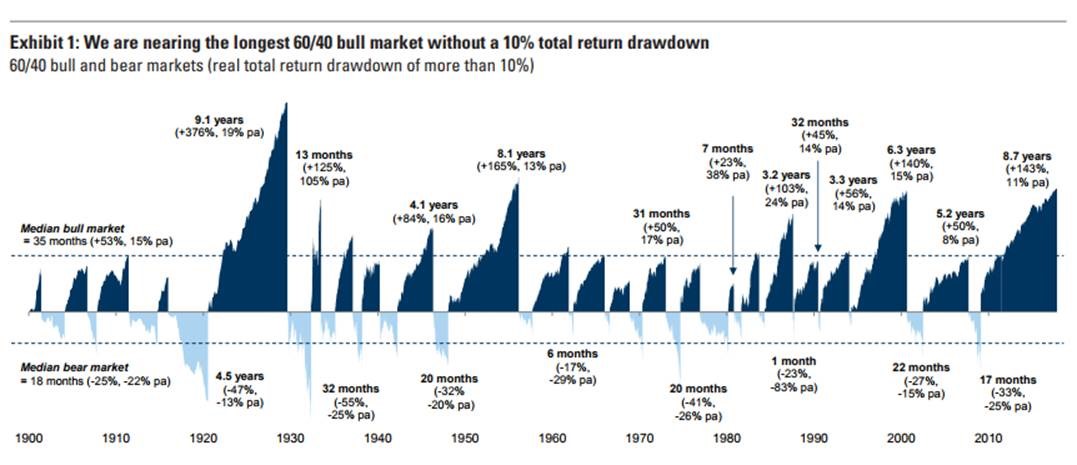
Keeping things in perspective we should remind ourselves we are up 4,000 points in the Dow since the election, we just experienced the longest streak in history without a 3% or 5% correction, the longest streak in history without a 10% correction in a classic 60/40 portfolio, and record low volatility across almost all asset classes. Market corrections are quite normal while low volatility is abnormal, 80% of stock market corrections do not turn into bear markets. The S&P experienced an average intra-year decline of 14.2% from 1980 through the end of 2015 and it achieved a positive return 27 of those 36 years. That’s 75% of the time.
For now, let’s keep calm and carry on, we will update you if this changes in the coming weeks. See chart below on just how common corrections have been during this bull market.

Source: https://www.advisorperspectives.com/

New Comments….


It Is Not Recession Time Yet

As I posted last week, it’s always troubling when we read doom and gloom headlines like (“Dow drops 1,000 points!”). But, in the greater context of the last few years, the most recent market pullback was a garden variety correction.

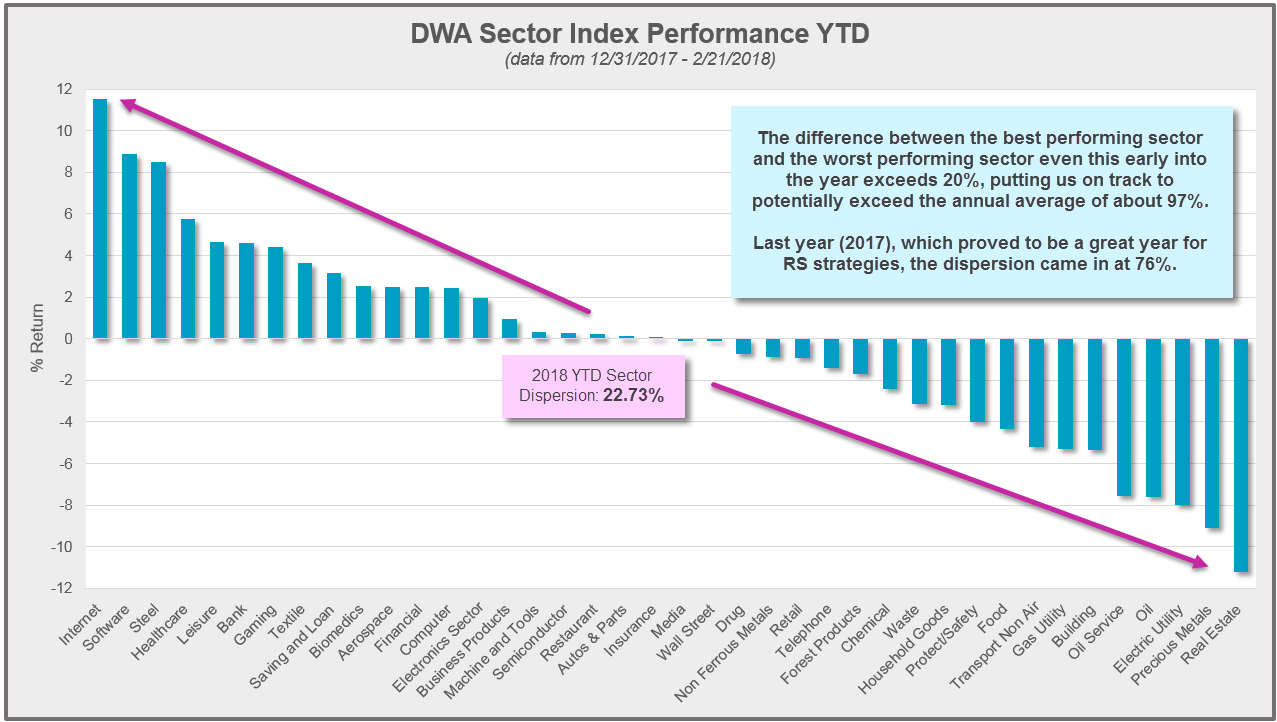
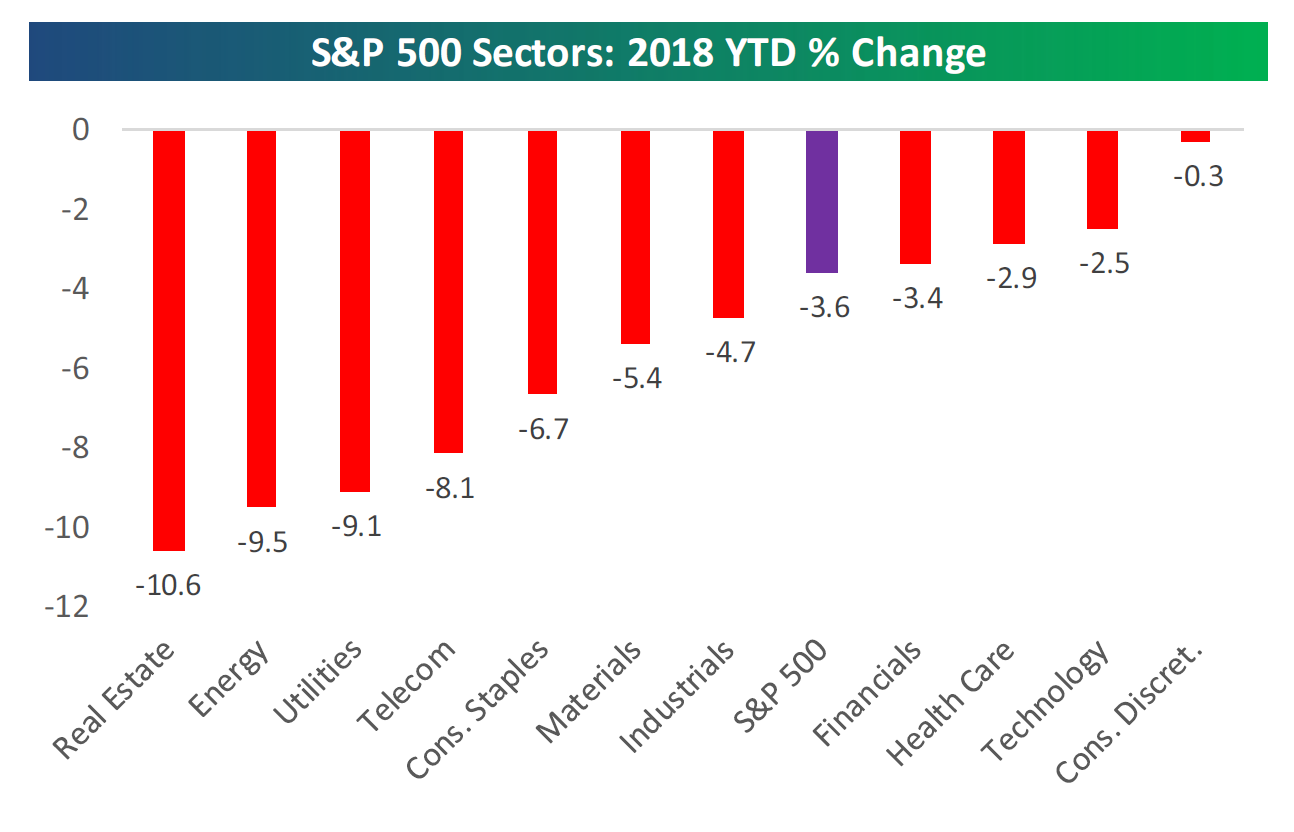
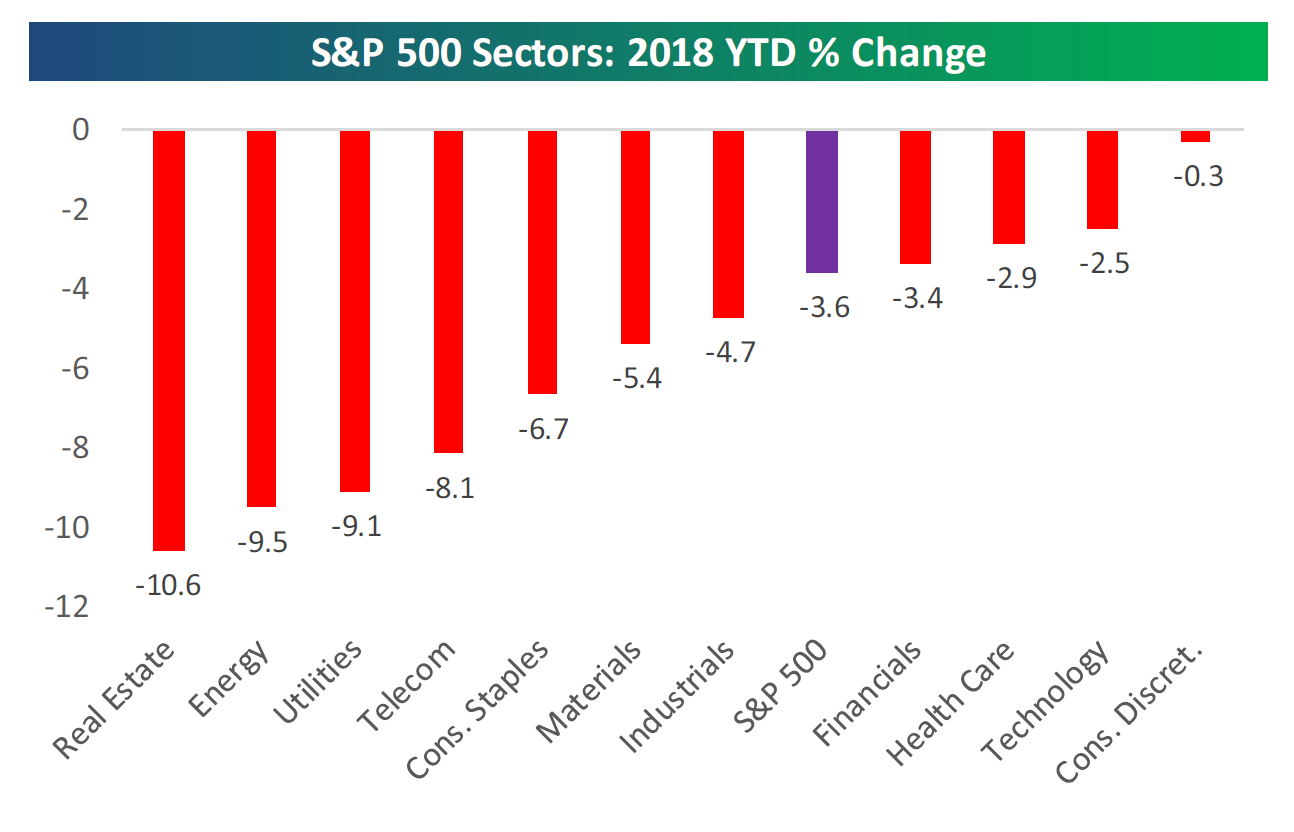
Here are a few simple reasons why I believe recent market volatility is not a bear market in the making. If we were moving into a truly defensive market, we would be seeing rotation out of aggressive sectors like technology and consumer discretionary and into defensive sectors like utilities and consumer staples. As you can see below, during the recent 10-percent market pullback, the (risk-on) tech and consumer discretionary sectors went down the least.

Traditional Defensive Sectors Down Big in 2018 —Risk-On Sectors Still Leading

Source: Bespoke

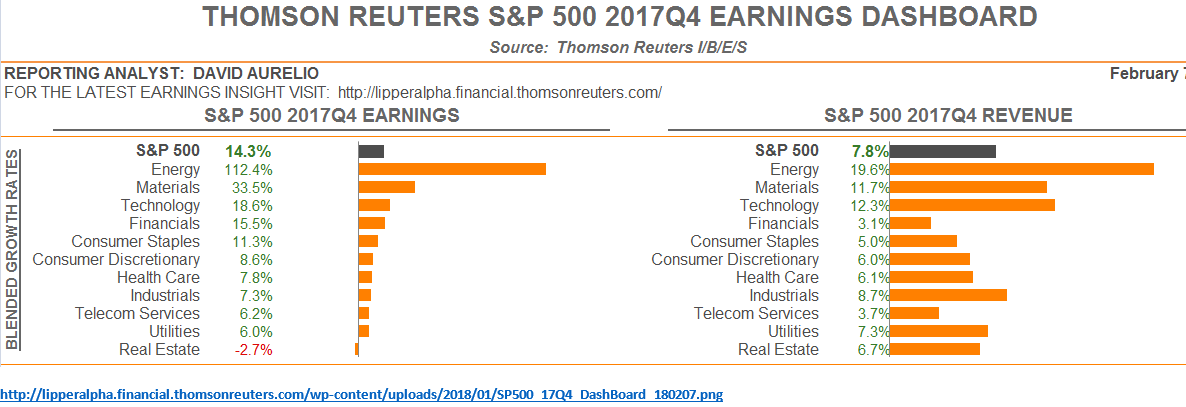
Yes, we’re in the later innings of a long bull market, but the stock market is driven by earnings growth and 80-percent of S&P companies are beating their revenue estimates—even without the tax cut.

80 percent of S&P companies have exceeded their 4th Quarter revenue estimates so far–the best showing in 10 Years.*

Source: Thomson Reuters
*More than 50 percent of companies have reported as we went to press

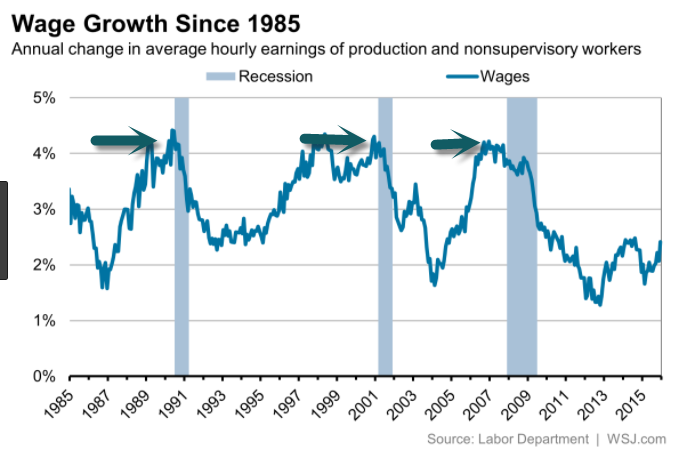
Fear of inflation, driven by strong wage growth, has been a primary driver of the recent market selloff. Strong wage pressure is not something this prolonged bull market has had to deal with much. But, with the unemployment rate at a decade-low 4 percent, the fear is that worker pay will rise too rapidly and thus, trigger inflation. A legitimate concern on the surface, but we are coming out of long pause in wage increases, so I believe, it appears we’re not in a danger zone yet.

Wage growth peaked at 4% leading up to the last three recessions—it’s only at 3% today (see chart below)

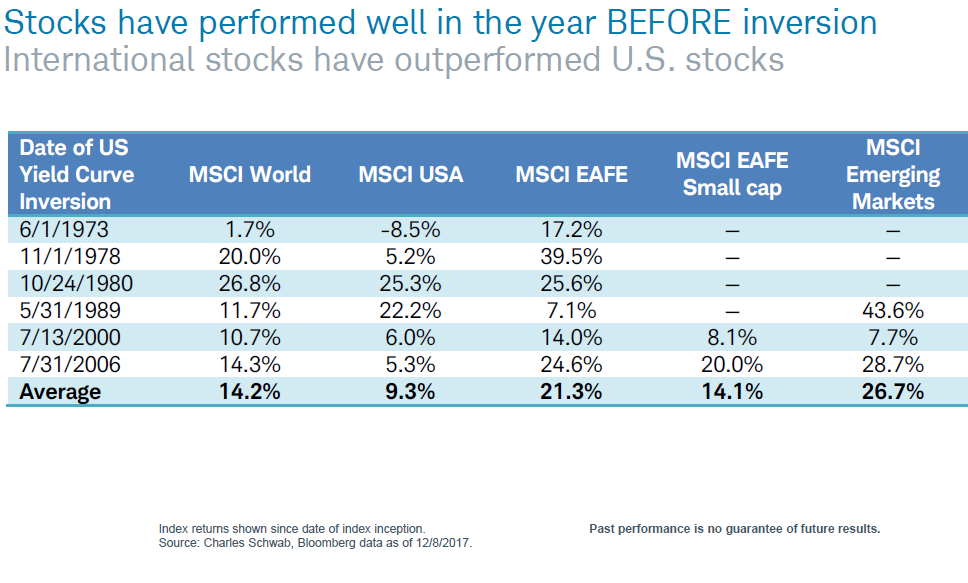
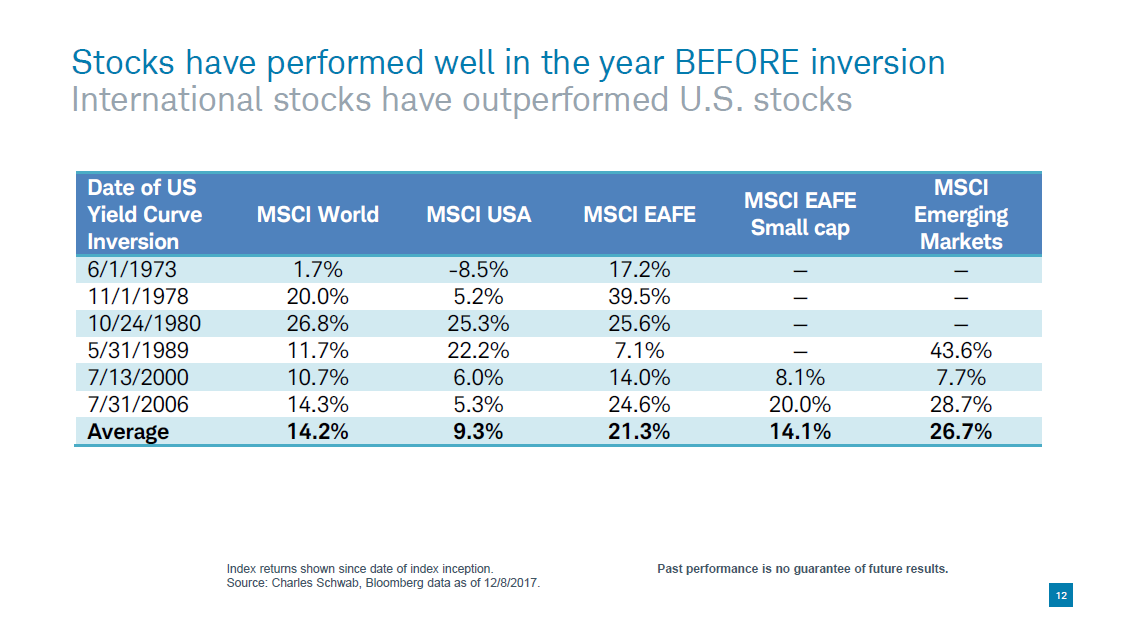
Another fear driver during this selloff has been a flattening yield curve—a situation in which long-term debt is not yielding much more than short-term debt of the same credit quality. But, equities tend to do well leading up to a flattening or inverted yield curve. An inverted yield curve—when short-term debt is yielding more than long-term debt–is one of our firm’s five key recession indicators, but I believe it appears we are not in the danger zone yet.

The flattening yield curve has taken center stage….How do stocks perform leading up to an inverted yield curve?


Source: Charles Schwab

Last but not least, there was absolutely no retail investor panic during the correction. In fact, the average American was buying stock during the recent market pullback. The “buy the dip” mentality is still intact. For a true bear market to ensue, retail investors have to throw in the towel and sell in volume.

Retail investors bought the dip last week

As Diana Britton and Michael Thrasher reported in Wealth Managment.com last week, retail investors bought into the market dip—they didn’t head for the exits. “Retail investors are often painted as the unsophisticated ‘dumb money,’ buying high and selling low at exactly the wrong time,” wrote Britton and Thrasher. “But recent data from last week’s stock market correction shows that view may be misguided.” For instance, Apex Clearing, a custodian that holds 7.6 million direct-to-consumer accounts, primarily for Millennials, said it saw an 84 percent increase in net buying following the February 5 crash,” they added.

William Capuzzi, CEO of Apex, told Wealth Management.com that robo and self-directed investors saw the sharp market pullback as an opportunity. “They got plenty of information from their providers that told them, ‘Don’t panic,’ and ‘These are opportunities for you to buy.’”

Conclusion

My take: Millennials aren’t the only retail investors still confident enough to ride out this bull market. Sure, I believe, it appears we’re in the later innings, but there’s no time clock in baseball and there’s no official expiration date for bull markets.

As always, thanks for trusting me with your money, and please call with any questions or further discussion. (610) 233-1074.

Topley’s Top Ten – February 21, 2018

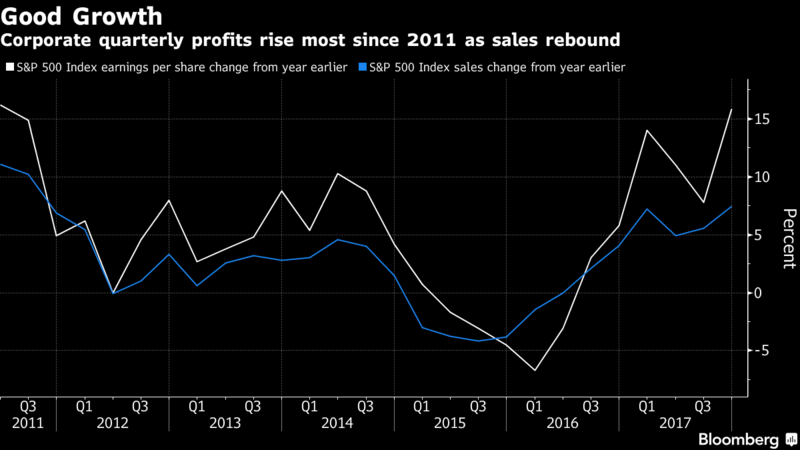
1.Problem for Bears—Fundamentals…Corporate Profits Rise Most Since 2011

  • S&P 500 Index earnings are forecast to grow more than 20%
  • Fundamentals are ‘nothing short of spectacular,’ analyst says

A stream of rosy profit reports has helped soothe the nerves of investors rattled by this month’s stock market plunge. U.S. companies are seeing the biggest growth spurt in quarterly earnings in six years, and the pace is set to accelerate.

The question now is whether that momentum will fuel further stock gains.

https://www.bloomberg.com/news/articles/2018-02-21/as-stock-jitters-recede-focus-shifts-to-surging-company-profits

Continue reading →

Topley’s Top Ten – February 16, 2018

1.Sector Leadership-Tech and Financials Bounce the Most Off Lows. No Sector Leadership Rotation Yet.

Bespoke Investment Group
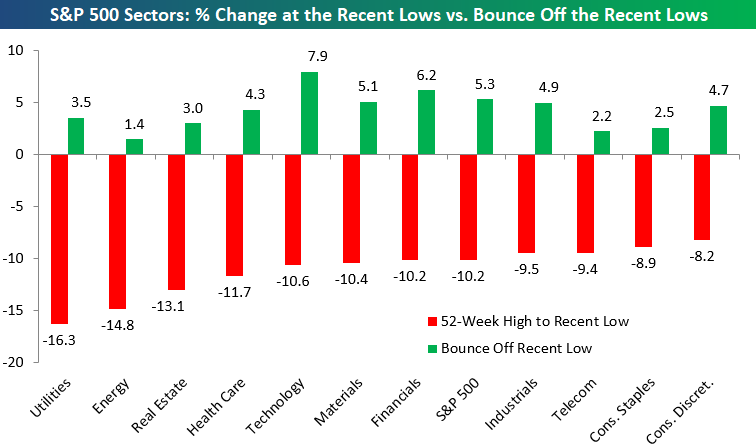
Below is one of the many charts included in this week’s Sector Snapshot, which highlights how much each S&P 500 sector fell from its 52-week highs to its recent low as well as how much each sector has now rallied off of its low.  As you can see, Tech has bounced the most off of its low, followed by Financials and then Materials.  Energy has struggled the most.  It had been down 14.8% from its 52-week high, but it’s only up 1.4% off of its low.

https://www.bespokepremium.com/think-big-blog/

Continue reading →

Topley’s Top Ten – February 14, 2018

1.Stocks and Bonds Going Down Together Like Last Week is a Rare Occurrence.

When Stocks and Bonds Go Down Together
Charlie Bilello

High on the list of the greatest fears among investors is a scenario in which stocks and bonds go down together.

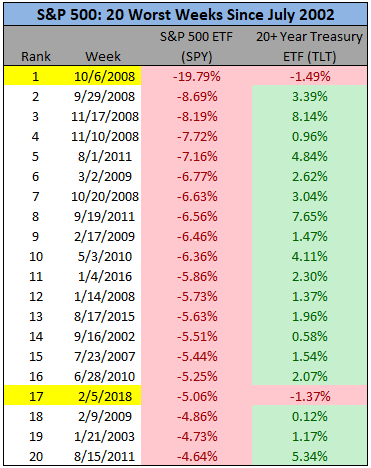
Last week those fears were realized when the S&P 500 (SPY) suffered its worst week since January 2016 while long-term Treasury bonds (TLT) also declined.

Source Data: Pension Partners, YCharts

This was an unusual occurrence to say the least. Of the 20 worst weekly S&P 500 declines since July 2002 (inception of the long duration ETF), last week was only the 2nd time long duration Treasuries also finished lower.

Treasuries tend act as a safe haven during times of equity market stress, showing positive returns on average during the worst stock market declines. This tendency is amplified on the long end of the curve, as investors are often positioning for weaker economic conditions that coincide with falling interest rates. A precipitous drop in interest rates, of course, is the best friend of duration.

However, there are certain times when the very source of equity market anxiety is a rise in interest rates and potential inflation. During such times you can see stocks and long bonds fall together. We last saw this briefly in 2013 during the so-called “taper tantrum”…

https://pensionpartners.com/when-stocks-and-bonds-go-down-together/

Found at www.abnormalreturns.com

Continue reading →

Topley’s Top Ten – February 6, 2018

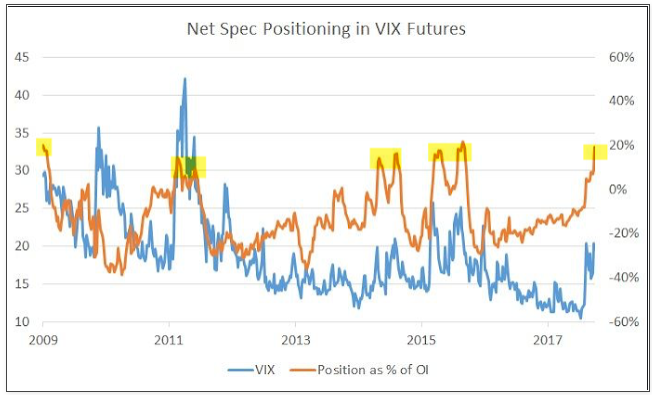
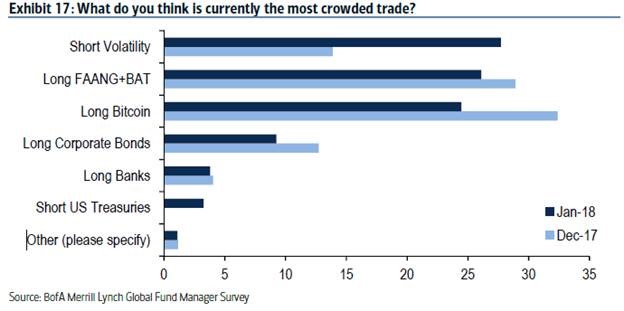
1.In Textbook Fashion…Street was Max Short Volatility Before Yesterday’s 84% VIX Spike.

The stock market is finally getting a long-awaited bout of volatility. The Cboe Volatility Index — or VIX — spiked 84% on the day, its biggest single-day increase of all time, according to data going back to 1990. The VIX reflects expectations for volatility in the S&P 500, and trades inversely to the benchmark roughly 80% of the time.

The Ultimate “Pain Trade” as the street was max short Volin the latest FMS form BofA.   Margin Clerks ramped hard at 2:30-3pm today.  Twits saying “8M SPY options trading on the day after more than 7M on Friday” – @OptionsHawk replied “Highest marks in over 2 years…when everyone finally starts buying protection, we tend to be close to a bottom (June ’16, Nov. ’16, Aug ’17)”

Chart from Dave Lutz at Jones

 
Continue reading →

Topley’s Top Ten – January 24, 2017

1.Euphoric Stage of Bull Kicking in….Investment Accounts Opened by Millennials +72% Annually at Ameritrade. 24 Hour Trading and Bitcoin Futures?

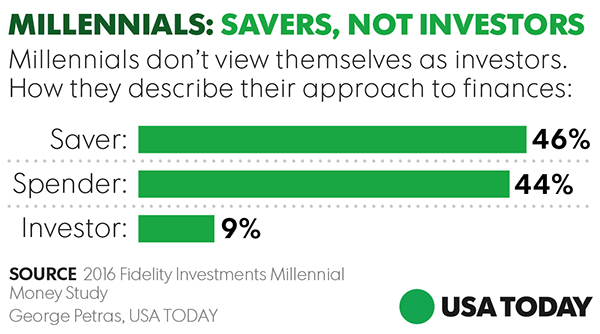
Millennials are leading an investment revolution. Now the largest demographic in the economy, young investors under 35 are catalyzing a transformation in the asset management and stock trading world.

Investment accounts opened by this demographic rose 72% annually, TD Ameritrade CEO Tim Hockey told Business Insider.In a wide-ranging interview following the $1.2 trillion brokerage’s earnings report that beat Wall Street expectations, Hockey said the firm has seen an explosion of interest in cryptocurrencies, cannabis stocks, and ETFs, particularly from millennials.

Hockey: Funny you should ask, last quarter I sat down at a restaurant with my 26-year-old son and we traded 100 shares of stock at the table using Facebook Messenger’s bot. We launched that last quarter.

Rapier: You recently turned on 24-hour trading, what was the logic behind that new offering? Is it receiving the response you expected?

Hockey: I’m glad you asked! It’s 24/5, so that allows clients to participate in after-hours market moving news that they didn’t have before because markets were open 9:30 to 4. Previously they had opportunities to do this only in the futures markets, but now we’ve offered 12 broad-based ETFs that are quite liquid, for example SPY, QQQ, the gold sector, oil, gas, China… these are all broad-based ETFs that can all now be traded 24 hours a day, five days a week. 

It’s only been two days, so it’s just starting to get traction now in the media. It’s still quite narrow, but even last night we’re seeing a three cent spread, which is a nice tight range for people to trade in, even after hours.

Rapier: You also launched bitcoin futures for some clients back in December, how much interest are you seeing from clients in the cryptocurrency space? Will more products show up soon?

Hockey: We just turned on the Cboe product in a very limited release — just to futures clients that were more sophisticated and understood the risk they were taking, and we’ll expand that over time. 

This market is certainly not mature. I would say that what we saw in terms of levels of absolute interest prior to the holiday season seemed to peak. Everybody was talking about crypto of all types all the time because it seemed like it was a one-way increase.

Ever since the pricing has been normalized and there’s been a bit of a correction, then you’ve seen a little bit less froth, if you will, in the market. We’ve actually seen that in the first few weeks of January, crypto trades — not just the Cboe product, but companies that are related to blockchain — have contributed a couple of points less toward our trading activity. It seems to have peaked just before the holidays.

The technology certainly has not matured, and I believe the transformative nature of what blockchain can do is only just starting to be understood by the majority of the world.

http://markets.businessinsider.com/currencies/news/td-ameritrade-ceo-interview-on-bitcoin-cryptocurrency-and-cannabis-2018-1-1013754792

https://www.bespokepremium.com/think-big-blog/

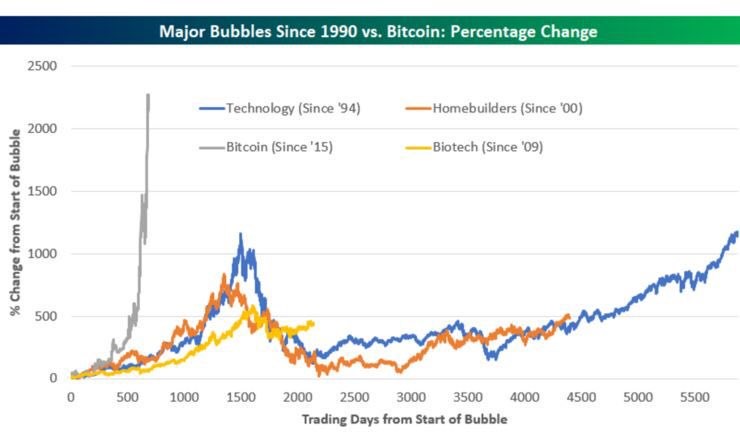
Nothing can reverse this overnight like your friends at bar telling you how much they are making on Bitcoin.

Continue reading →

Topley’s Top Ten – January 19, 2018

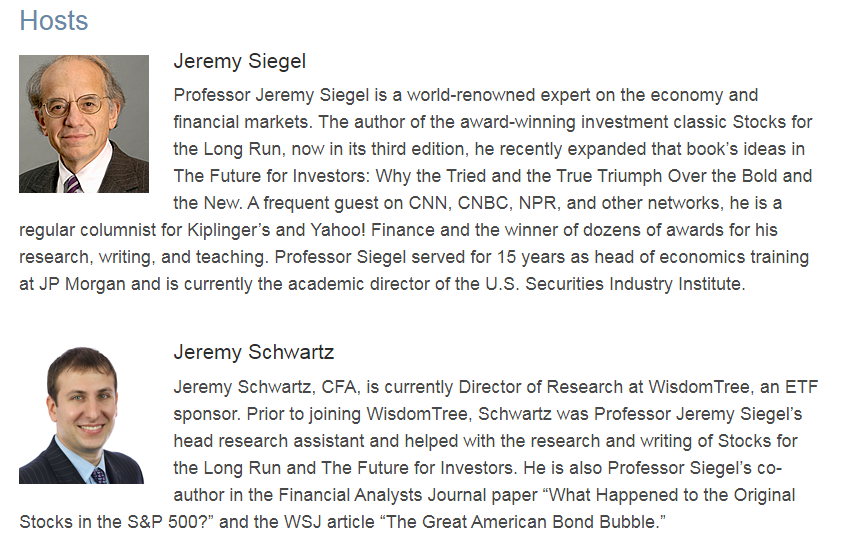
Reminder I will be on “Behind the Markets” Wharton Business Radio Sirius Satellite station 111– 1pm today.

Hosts

https://businessradio.wharton.upenn.edu/programs/behind-the-markets

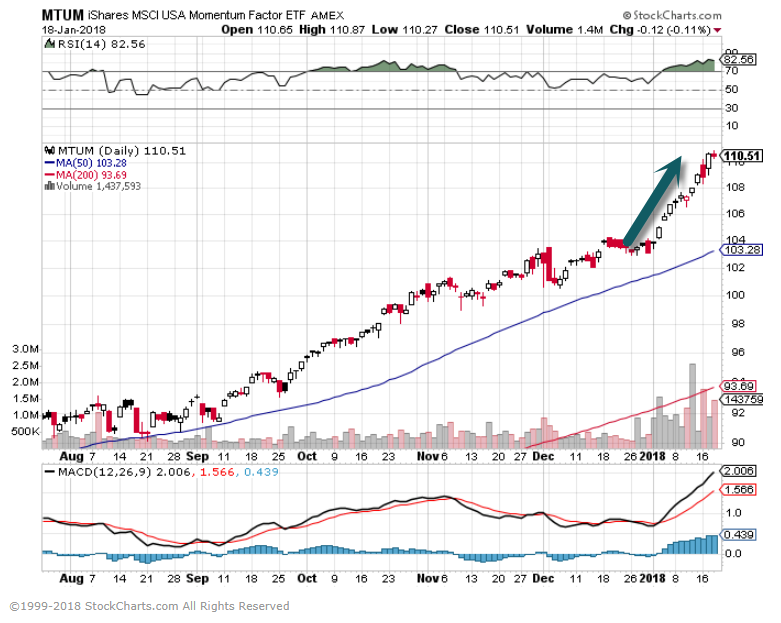
1.Momentum Investing Maintaining Strength.

The power of momentum

The February 2016 kickoff rally continued to build momentum. One way to quantify momentum was shown in the Nov. 19, 2017, Profit Radar Report:

“The S&P 500 was higher 8 of the first 9 months of 2017. This has only happened 8 other times (1936, 1950, 1954, 1958, 1964, 1995, 1996, 2006). 2, 3, 6, and 12 months later, the S&P was higher every time but one (0.7% loss 2 month later in 1964).

Such strong momentum readings (and they are seen across all time frames) are extremely rare. As mentioned in December 2016 and March 2017, stocks rarely top out at peak momentum. We have to go back to 1995/1996 to find similarly strong and persistent upside momentum.”

Simon Maierhofer is the founder of iSPYETF and publisher of the Profit Radar Report. He has appeared on CNBC and FOX News, and has been published in the Wall Street Journal, Barron’s, Forbes, Investors Business Daily and USA Today.

https://www.marketwatch.com/story/this-might-be-the-most-sustainable-stock-market-bubble-ever-2018-01-18

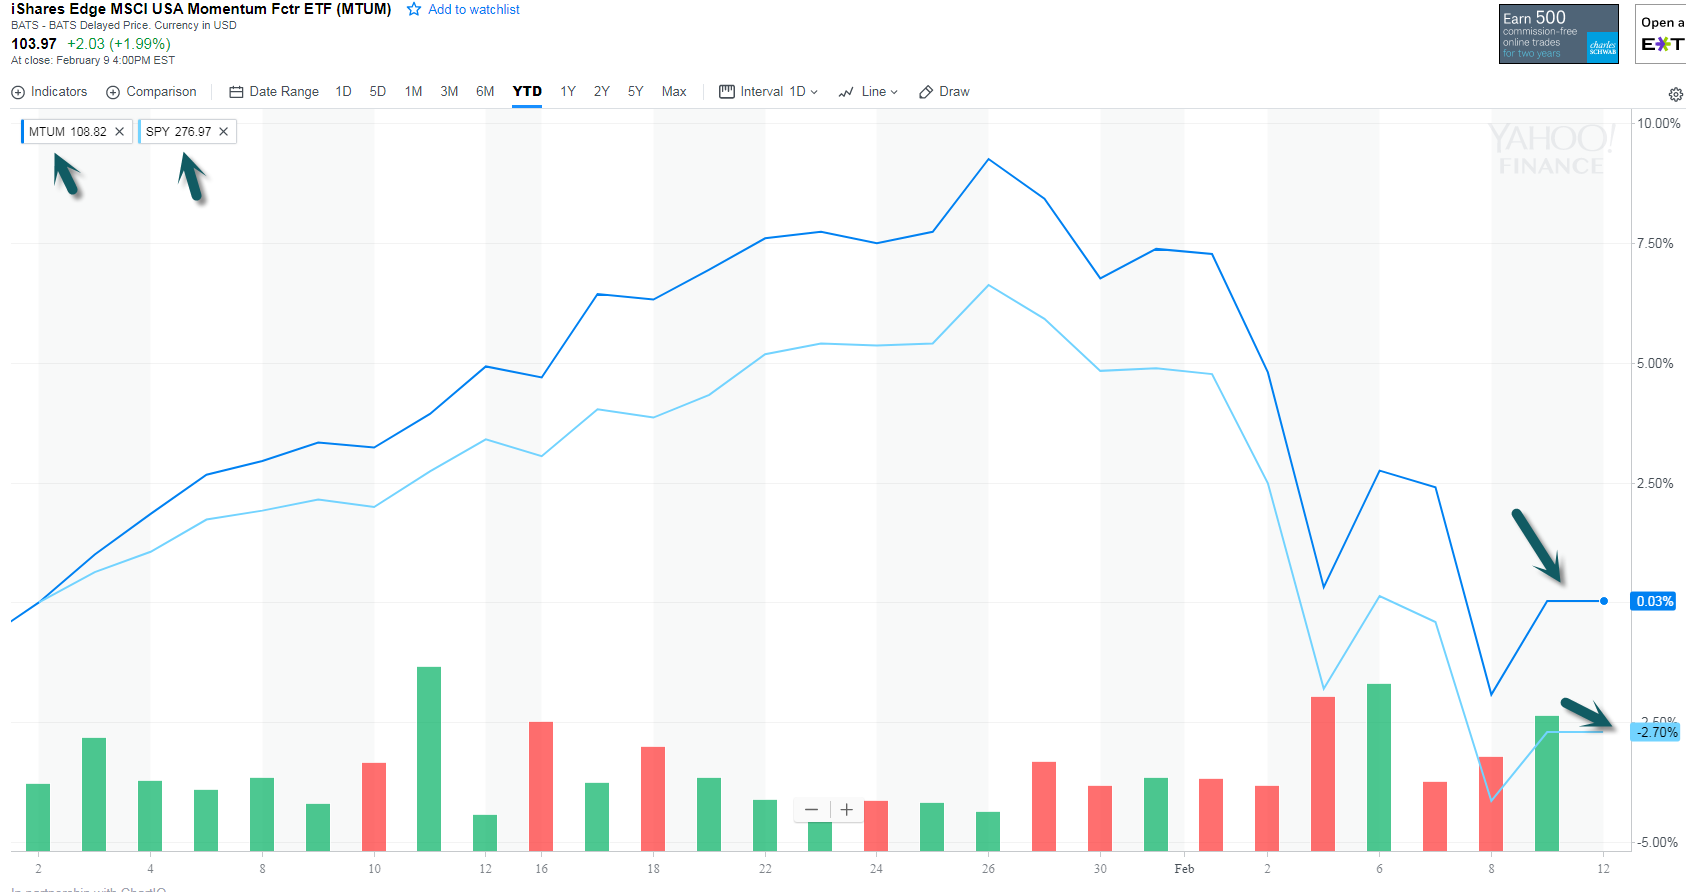
MTUM Momentum ETF Gap Up on Big Volume.

www.stockcharts.com

Continue reading →

Topley’s Top Ten – January 11, 2018 (Short Version)

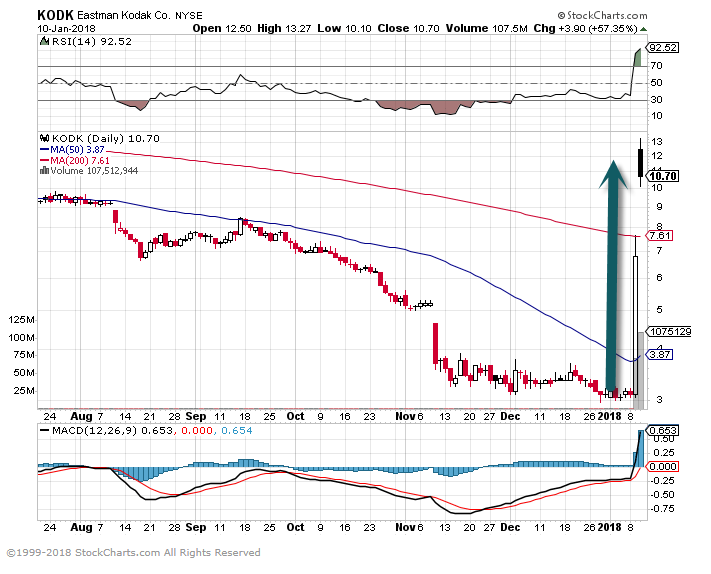
1.Eastman Kodak Becomes Blockchain Company and Spikes 200%.

Kodak Soars as It Joins Cryptocurrency Craze

Shares of Eastman Kodak Co. KODK were rising 64% in premarket trading on Wednesday following a jump of 119% in the previous session after the photo company said it would shift its focus toward blockchain technology and enter the world of initial coin offerings. 

Kodak said Tuesday it would launch its own form of cryptocurrency, KODAKCoin, that would “empower photographers and agencies to take greater control in image rights management” inside its existing KODAKOne platform.

Shares in the group surged more than doubled in Tuesday trading following the release, rising to a three-month high of $6.80 each.

newsletters@thestreet.com

Eastman Kodak.

www.stockcharts.com
Continue reading →

Topley’s Top Ten – December 21, 2017

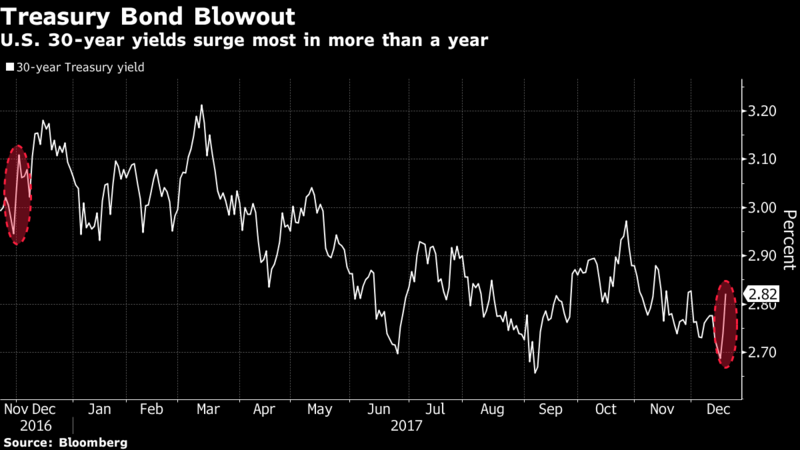
1.30 Year Treasury Spike….Someone Made $60 Million on the Trade.

But at least one large position amassed last week looks prescient. Someone bought 50,000 put options on bond futures at an average price of 1’04 ticks, according to a trader familiar with the transaction, wagering that the price of long-dated Treasuries would fall as 30-year yields increased. That price jumped to 2’21 ticks Tuesday amid a sustained climb in long-end yields to 2.82 percent, leaving the bet showing a profit of about $60 million.

https://www.bloomberg.com/news/articles/2017-12-19/trader-turns-60-million-profit-in-sharpest-bond-selloff-of-2017

Continue reading →

Topley’s Top Ten – December 20, 2017

1.Venture capital investment hits all-time record

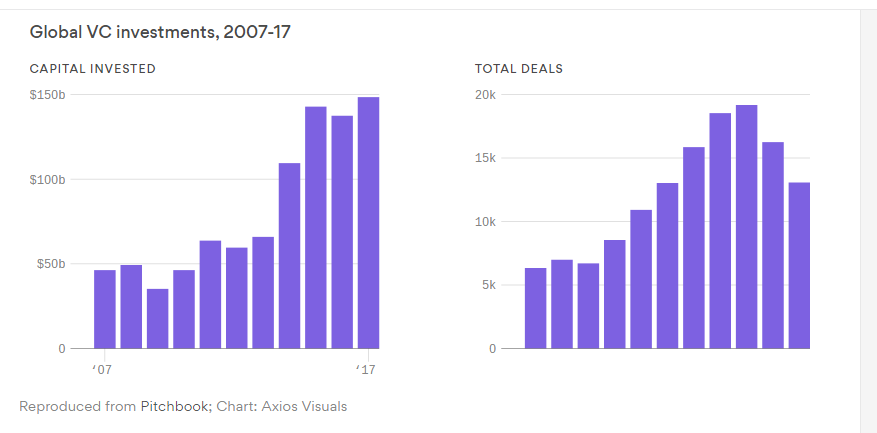
Global venture capital investment has hit an all-time record, with more than $142 billion already disbursed in 2017, according to data provider PitchBook.

  • Fewer startups are raising money, but the round sizes are getting appreciably larger. For example, though mid-October, eight companies had raised rounds of $500 million or more.
  • There has been a boom in fundraising by Chinese startups, partially driven by an increase in local capital sources.
  • S. venture investment has hit $81.2 billion, which still trails dotcom era totals from 2000.

https://www.axios.com/vc-investments-2518448702.html
Continue reading →

Topley’s Top Ten – December 18, 2017

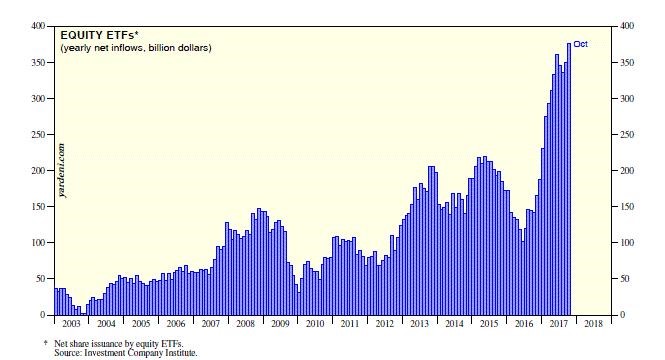
1.New ETF Creations on Track to Hit $500B in 2017 vs. $287B in 2016

https://www.linkedin.com/pulse/whats-fueling-bull-market-edward-yardeni/?trackingId=wmncdgL%2BdiRpZYN%2BEYrsbA%3D%3D

New ETF Assets For 2017 Nears

December 15, 2017

Cinthia Murphy

Investors poured nearly $30 billion into U.S.-listed ETFs in the past week, bringing total net creations so far in 2017 to $466 billion.

The massive, record asset-gathering pace now sits just inches away from what could be a new milestone for the ETF market: $500 billion in net inflows in one calendar year. With two weeks to go in December, hitting $500 billion seems very likely.

For perspective, consider that 2016 also saw record-breaking asset gathering in the U.S. ETF space, with net creations reaching $287.5 billion last year. We are on pace to almost double that haul in 2017. What’s more, combined with performance, the asset inflows grew the ETF market to $3.4 trillion in total assets—that’s almost $1 trillion bigger than where the market sat a short year ago.

http://www.etf.com/sections/weekly-etf-flows/weekly-etf-flows-2017-12-14-2017-12-08

Continue reading →

Topley’s Top Ten – December 12, 2017

1.Annual Price Changes During Bull.

Year-To-Year Market Performance

Dec 11, 2017

The S&P 500 is up nearly 20% in 2017 after gaining 9.5% in 2016.  The chart below highlights the annual price change of the S&P 500 since the current bull market began in 2009.

Contrarian investors might be prone to think that the market is likely to fall after a big up year, while momentum investors like to trade on strength one year turning into strength the next year. But if we look at the correlation between returns one year to the next, we find that there is none.

Below is a scatter chart showing the S&P 500’s move one year versus its move the next year. If the contrarian bet were true, you’d see a trend-line in the scatter chart that goes from the upper left to the lower right.  If the momentum bet were true, you’d see a trend-line that goes from the lower left to the upper right.  In reality, the trend line is flat as a pancake, meaning market returns one year have no correlation with market returns the next.

https://www.bespokepremium.com/think-big-blog/year-to-year-market-performance/?utm_source=sumome&utm_medium=linkedin&utm_campaign=sumome_share

  Continue reading →

Topley’s Top Ten – December 7, 2017

1. It’s Not Over, but the Fat Lady is Stretching in the Warm up Room

It’s the end of the world as we know it
It’s the end of the world as we know it and I feel fine

REM “IT’S THE END OF THE WORLD”

Key Takeaways

  • Professional managers feel pressure to increase risk in order to produce outsized returns in a one-way market that seems to go only up.
  • There is still some steam left in this bull market, but a downturn will eventually occur when earnings are exhausted.
  • Tech will not be immune to the downturn.
  • The good news is that we will face a good-old fashioned correction—not a crisis—and we always come out of recessions stronger than before.

Read Full Story
https://matttopley.com/end-world-know/

Continue reading →

Topley’s Top Ten – November 28, 2017

1.Broad Based 1700 Stock Chart Breaks Out.

I am not familiar with this chart but interesting.

Here’s Ari’s chart and comment:

Advance Is Broader than Many Realize

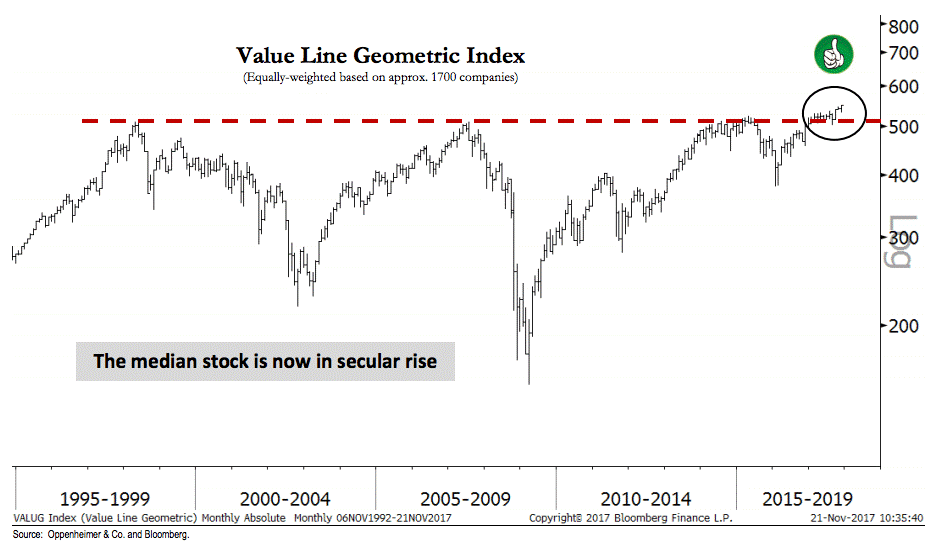
The message coming from our research is that the S&P 500 is in the midst of a healthy middle innings advance and investors should participate by buying cyclical sectors, like Technology, Financials, and Industrials. One key point we continue to stress is the broad-based nature of the rally. For instance, the Value Line Geometric index, an equal-weighted aggregate of approximately 1,700 companies, has broken above secular resistance dating back to the year 2000, and is accordingly positioned for additional gains, in our view. Rallies that include the participation of many stocks are typically the rallies that continue (or conversely, internal breadth typically narrows into a market top), and with the S&P 400 and S&P 600 indexes also making new highs with the S&P 500, we expect strength to continue.


Josh here – last week witnessed a new all-time high for the Nasdaq 100, Dow Jones Industrial Average, Russell 2000, NYSE Advance-Decline Index and a new 52-week high for the All Country World Index-ex US. You’re welcome to interpret that as a negative indicator if you feel the need to, but you’d be on the wrong side of one hundred years of market history.

These things end with a narrowing, not a broadening. Which could certainly happen – it’s just not happening right now. 

Source:
Technical Analysis: Inflection Points
Oppenheimer & Co – November 25th 2017
From Josh Brown Blog.
http://thereformedbroker.com/2017/11/26/secular-bull-takes-flight/

Continue reading →

Topley’s Top Ten – November 27, 207

1.Tech and Financials are Half the Weighting of Emerging Markets.

Sector Weightings: S&P 500 vs Emerging Markets

Nov 22, 2017

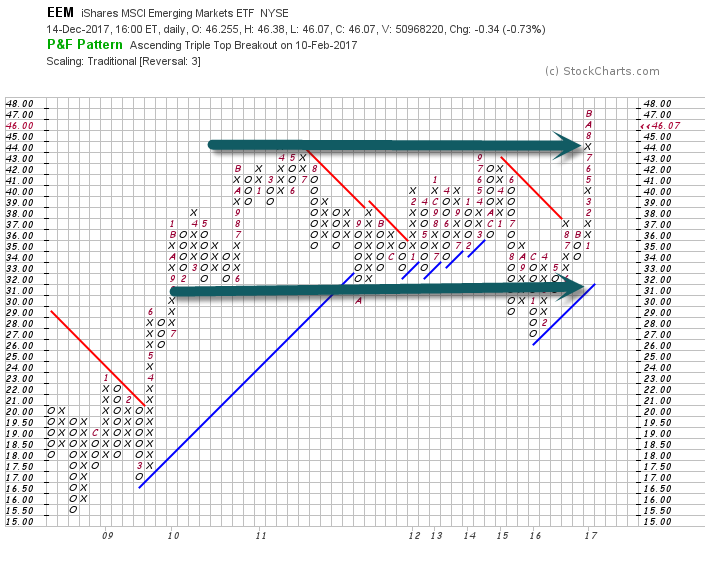
If we had a bitcoin for every time we heard someone say that the S&P 500 has been too reliant on the performance of tech stocks for its gains this year, we would be very rich.  But if you think the S&P 500 is dangerously overweighted towards the Technology sector, beware of emerging markets.  While the Technology sector’s 23% weighting in the S&P 500 makes it by far the largest sector in the index, the ETF tracking Emerging Markets (EEM) is even more heavily weighted towards technology.  The chart below compares sector weightings in the ETFs that track the S&P 500 (SPY) and Emerging Markets (EEM).  As you can see, Technology has a 26.5% weighting in EEM.  So if you think the S&P 500 is too top heavy with tech, EEM is even more exposed.

In addition to the large weighting in tech, EEM also has a lot of exposure to Financials.  That sector’s weighting is nearly 60% larger in EEM (23.1%) than it is in SPY (14.6%).  With such large weightings in both sectors, just under half of EEM’s weighting is in Technology and Financials.  So where is EEM underweighted relative to SPY?  That would be in the Health Care sector.  As shown below, Health Care accounts for 14.5% of SPY, but the sector’s weighting in EEM is a puny 1.95%.


https://www.bespokepremium.com/think-big-blog/
Continue reading →

Topley’s Top Ten – November 20, 2017

1.The 3rd Longest Bull Market Ever is Still Lacking IPOs

Barron’s

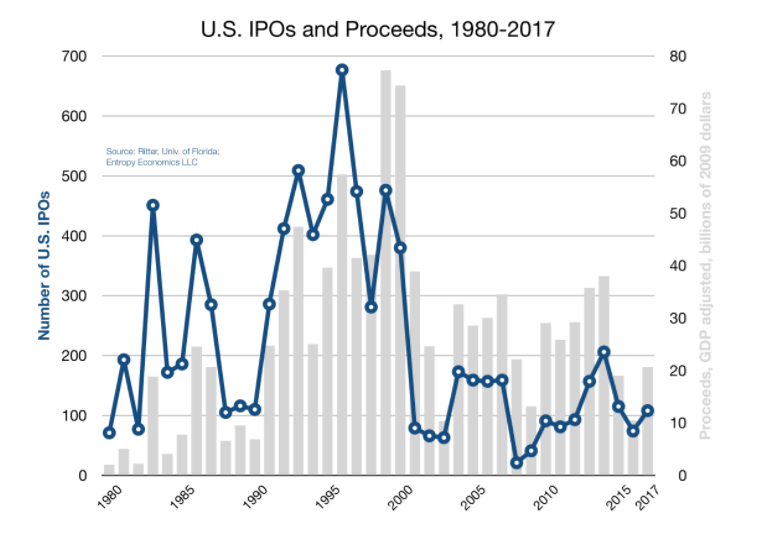
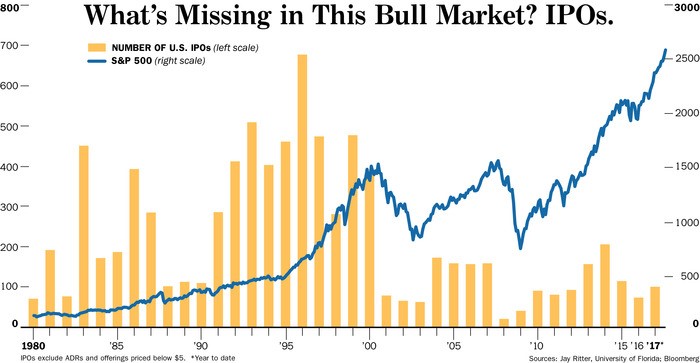
The dearth of companies making their trading debuts is an unusual feature of what has been a record run for the stock market. In the heady 1990s, there were an average of 436 IPOs per year in the U.S., based on Ritter’s data. Last year, there were just 74. A number of reasons have been cited, including increased regulations and scrutiny for public companies, as well as the deluge of private capital.

The flood of private money is overwhelming ..Stat of week

FOR NOW, IT’S HARD to blame entrepreneurs for holding back on IPOs. The flood of private capital has changed the calculus. In one example, Japanese conglomerate SoftBank Group has raised over $93 billion for a technology investment fund. Those dollars alone exceed the $84 billion in total proceeds raised in U.S. IPOs since the start of 2015.

Read full story

https://www.barrons.com/articles/unicorns-what-are-they-really-worth-1510974129

Continue reading →

Topley’s Top Ten – November 15, 2017

1.Investors Starting to Go “All In”

From Dave Lutz at Jones.

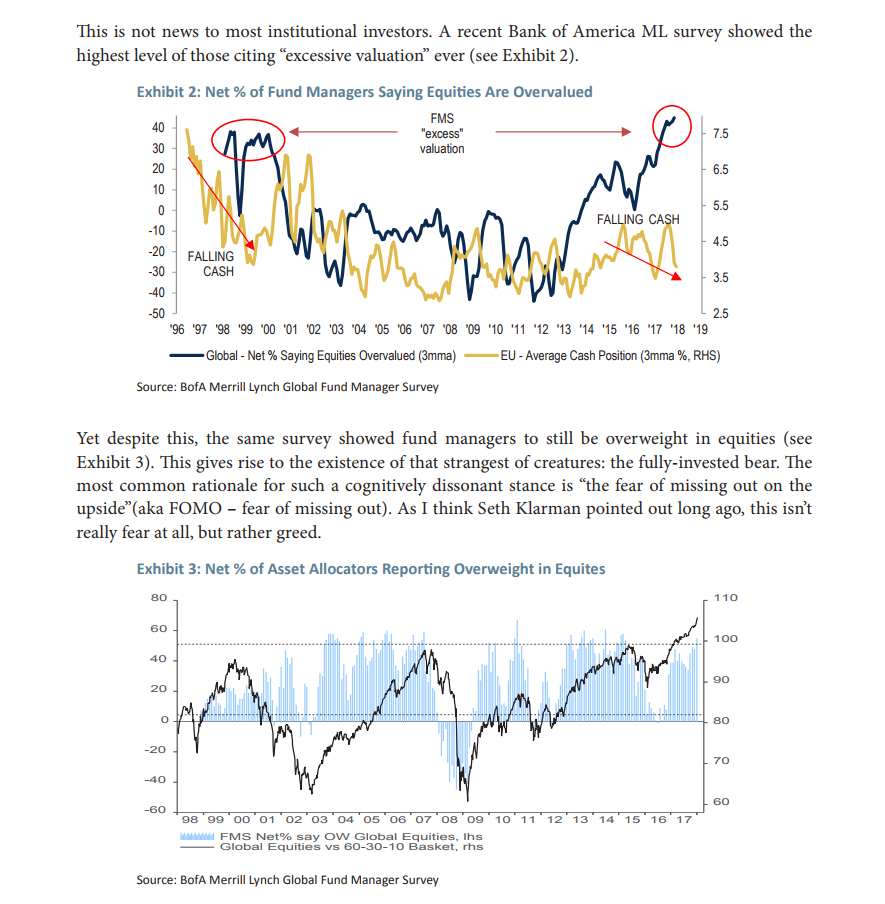
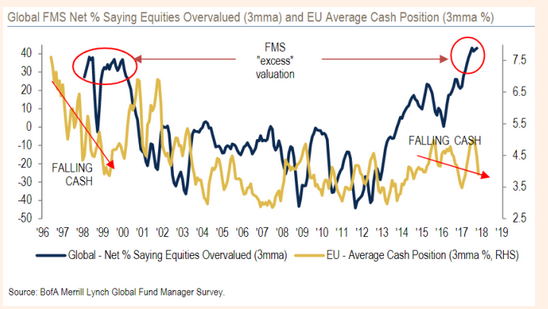
Investors around the globe are increasingly showing signs of “irrational exuberance”, putting more chips on the table even as they worry equities markets have become “overvalued”, according a closely watched survey by Bank of America Merrill Lynch – Forty-eight per cent of investors in BofA Merrill’s November survey said that equities are “overvalued”, a record proportion that has sent the three-month moving average above the level that came at the turn of the millennium ahead of the bursting of the dot com bubble.

At the same time, average cash balance among the 178 fund managers with $610bn in combined assets under management that BofA Merrill surveyed slipped to 4.4 per cent from 4.7 per cent. It marked the lowest level in more than four years and was below the 10-year average of 4.5 per cent, FT reports.

Continue reading →

Topley’s Top Ten – November 9, 2017

Traveling again this week…

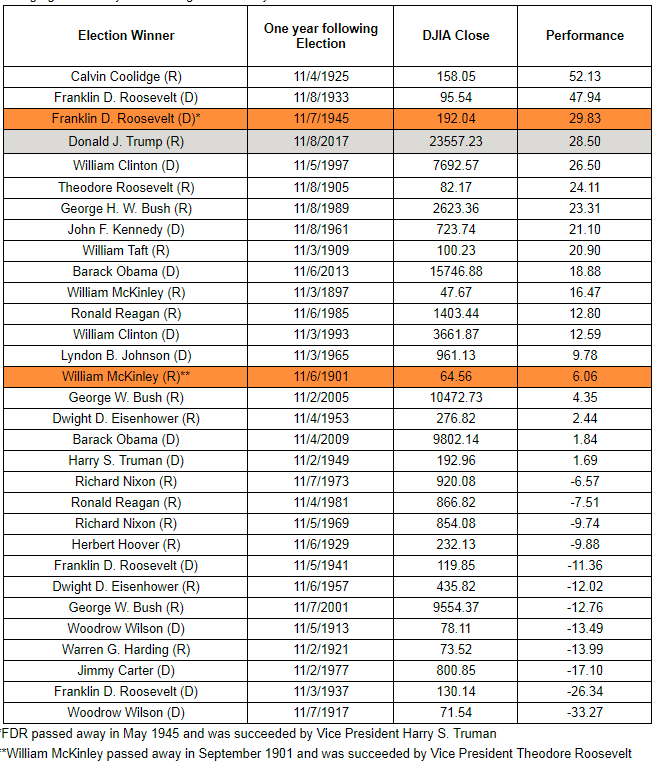
1. Dow’s 1-year gain since Trump’s win is its biggest post-Election Day rise since 1945

By Victor Reklaitis

That represents its best performance after a White House contest since 1945, when the blue-chip gauge was up 29.83% in a year following the election of Franklin D. Roosevelt and his vice president Harry S. Truman. (FDR died early his fourth term, putting Truman in the Oval Office in April 1945.)

Check out: Good news for the president in latest Trump Scoreboard

The table below from WSJ Market Data Group shows that Calvin Coolidge ranks No. 1 by this measuring stick, FDR gets the silver and bronze medals, Trump is fourth, and Bill Clinton, fifth.

https://www.marketwatch.com/story/the-dows-one-year-gain-since-trumps-election-is-its-biggest-since-1945-2017-11-08

https://www.marketwatch.com/story/the-dows-one-year-gain-since-trumps-election-is-its-biggest-since-1945-2017-11-08

Continue reading →

Topley’s Top Ten – November 7, 2017

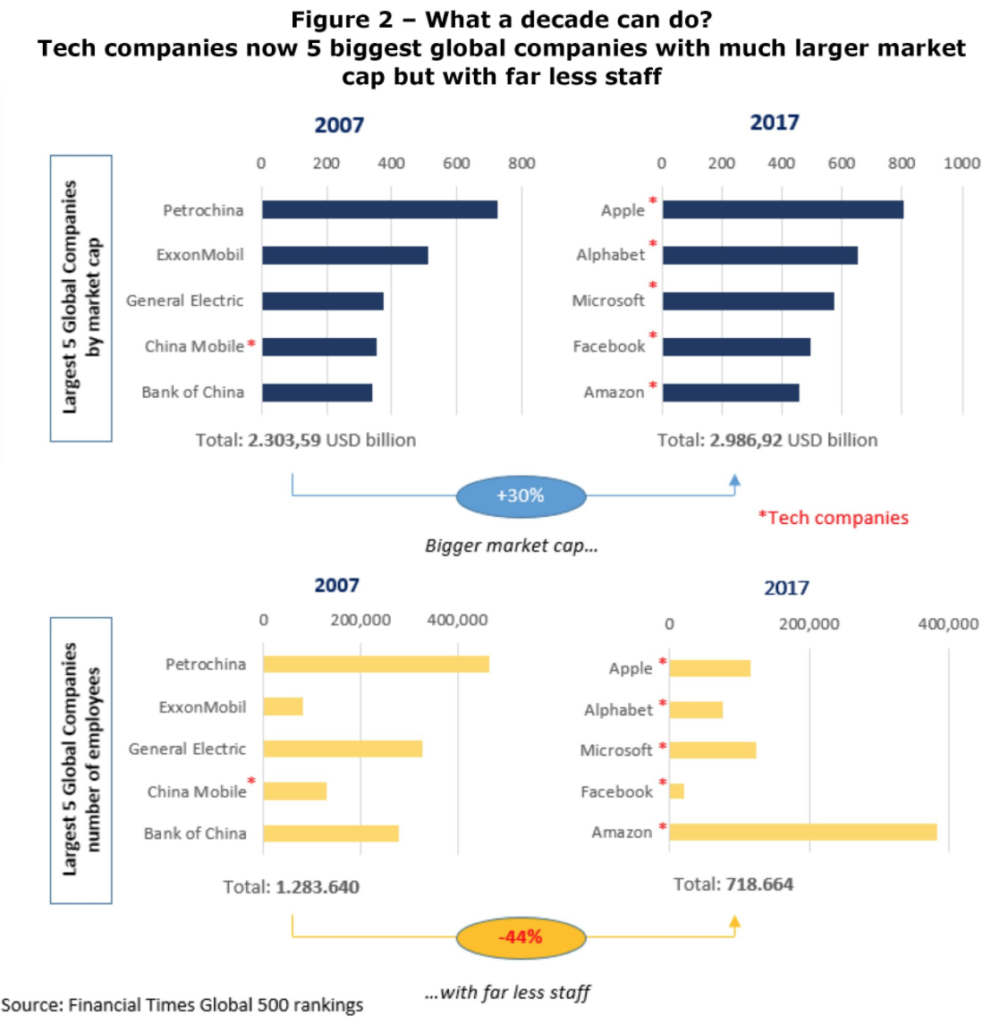
1.Tech Companies Now Biggest Market Cap Stocks with Half the Employees of Former Leaders.

Josh Brown

Chart o’ the Day: How quickly things have changed

Posted November 6, 2017 by Joshua M Brown

Your favorite stock; see if it’s a buy, sell or hold opportunity

I came across this infographic from Wharton via 13D Research and I think it makes a powerful point about how quickly things have changed.

One of the biggest posts of the year here on TRB was “Just own the damn robots.“, where I talked about the mood right now surrounding the automation meteor headed right for us. This is another way of understanding the reality:

Getting bigger by market cap – and by revenues – with less people is the new normal. It’s not going back the other way. The only escape for our children is to join the education arms race and hope they choose the right major – or to embrace entrepreneurialism and create their own jobs.

http://thereformedbroker.com/2017/11/06/chart-o-the-day-how-quickly-things-have-changed/
Continue reading →

Topley’s Top Ten – November 6, 2017

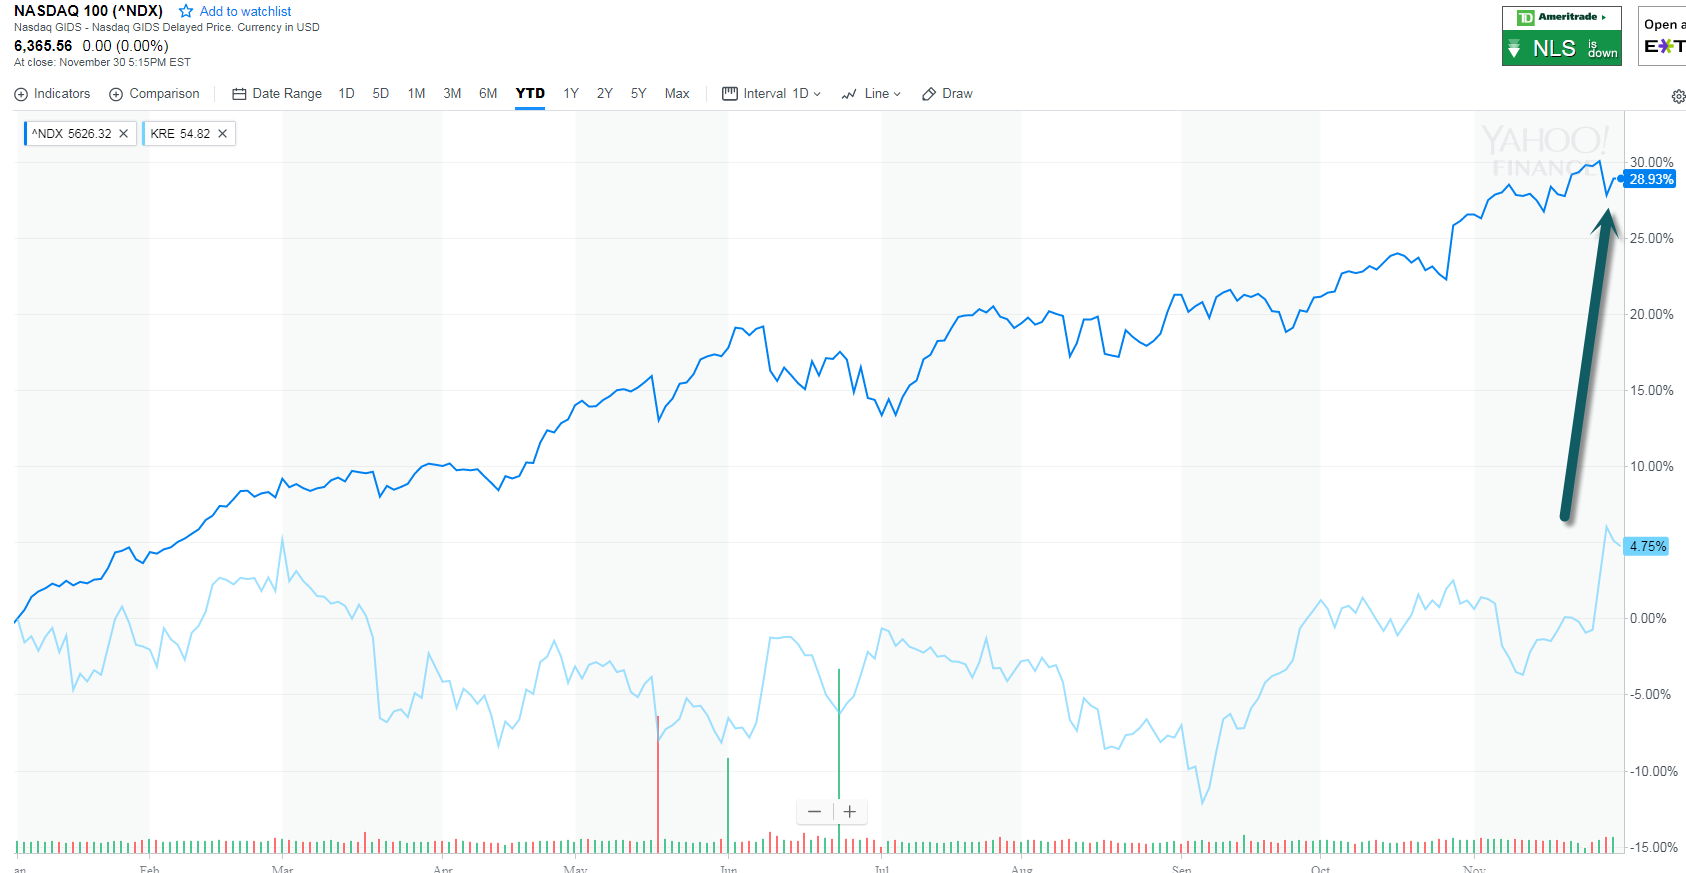
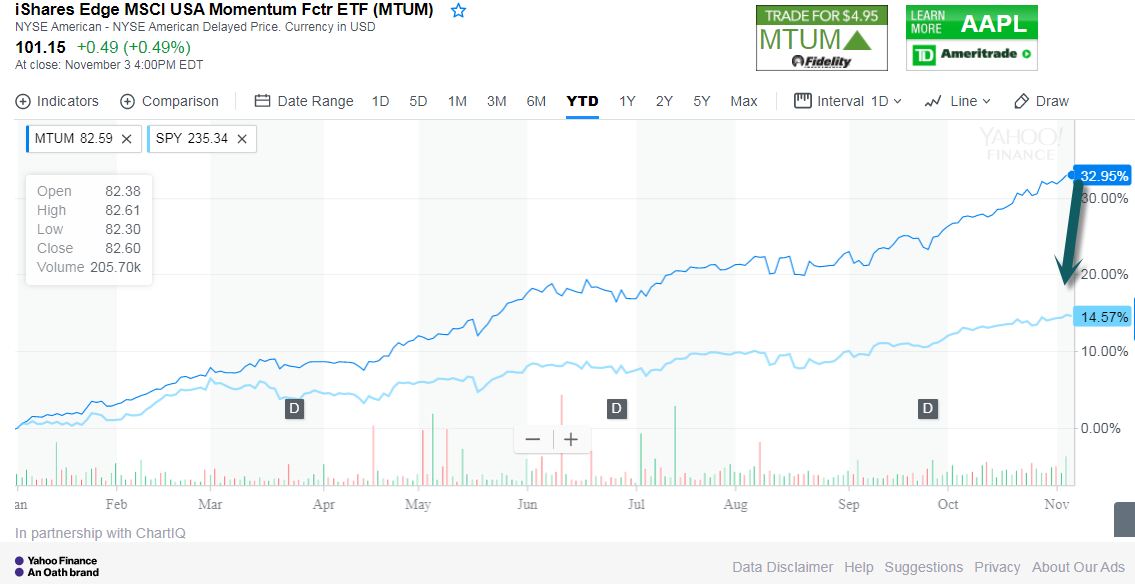
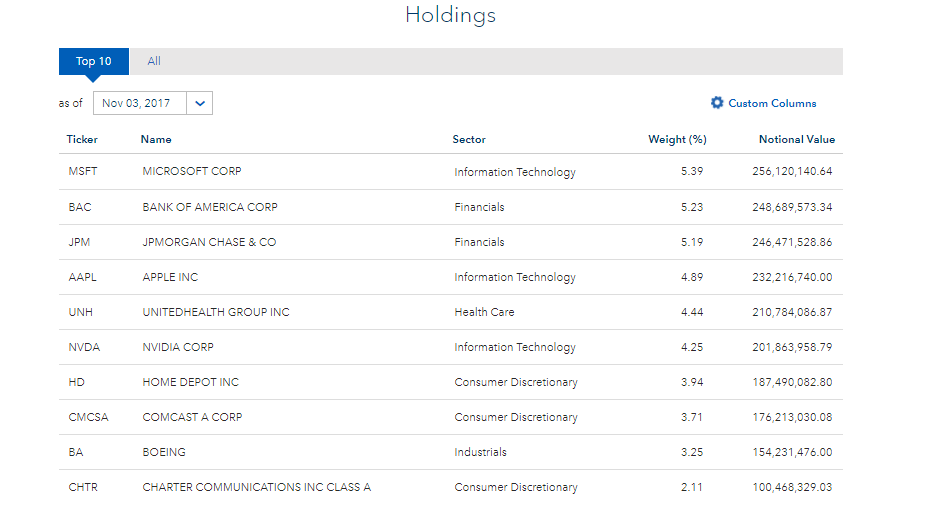
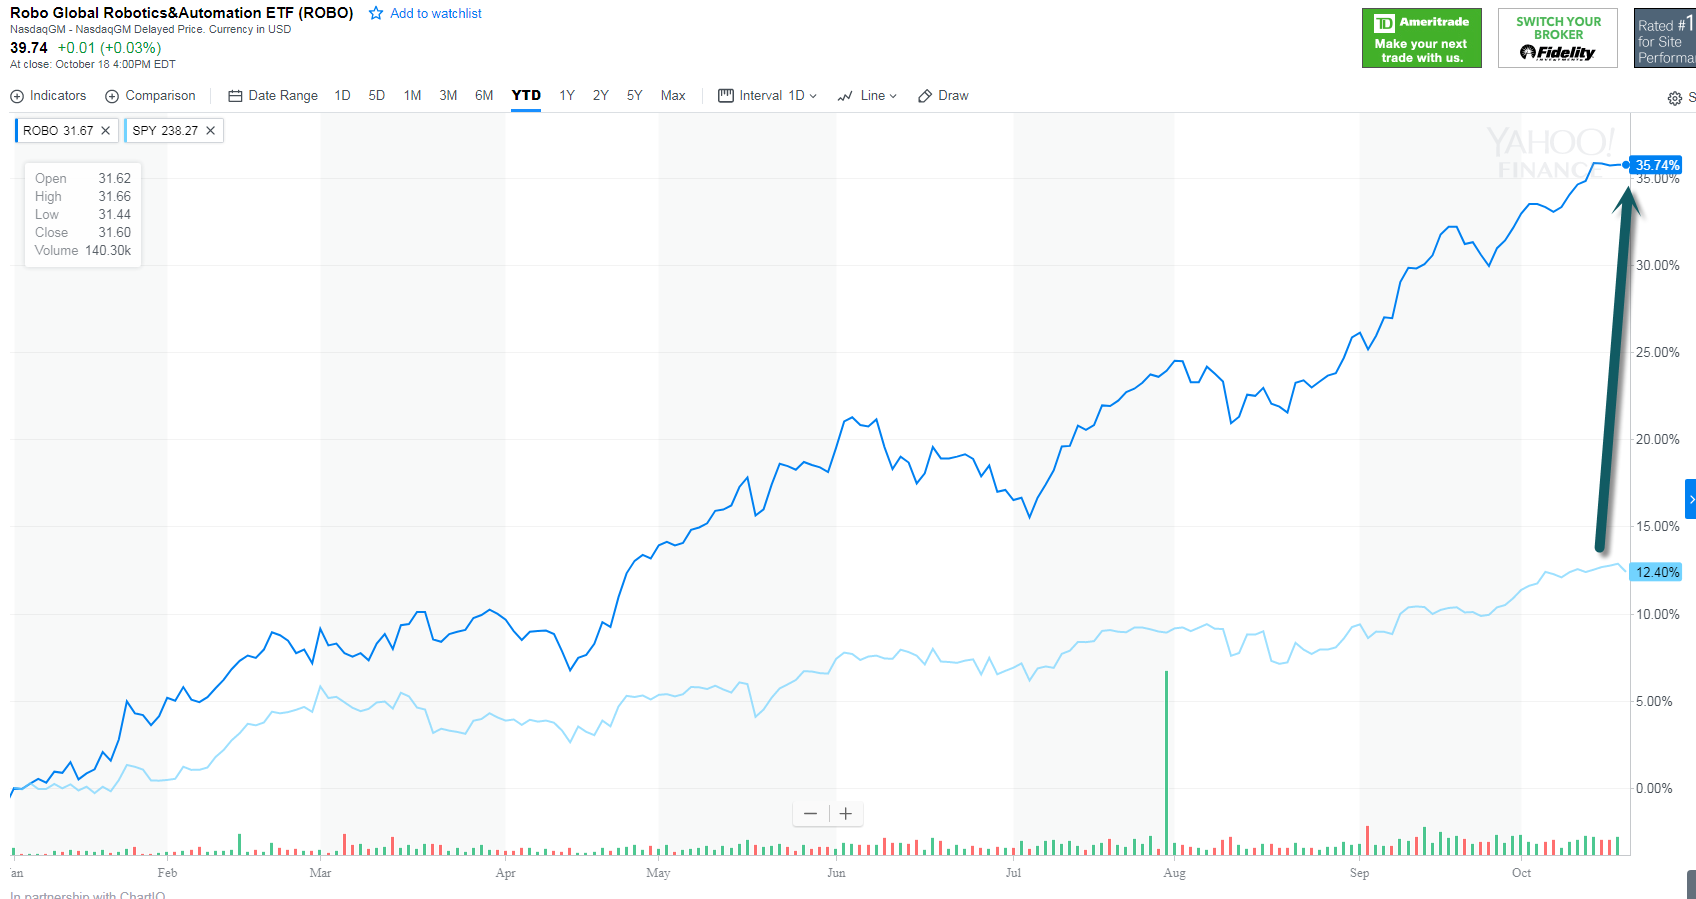
1.Momentum Factor has Dominated 2017….MTUM Up Over Double the S&P YTD

But has the gap between the performance of the two indexes grown too big? MKM Partners technical analyst Jonathan Krinsky compared how big that gap is relative to its 200-day average, and found it’s at a level that often signals a peak in momentum. Sometimes it’s simply a pause—that was the case in 2005—but sometimes it can signal an impending peak, as it did in 2008. “Momentum names are stretched relative to the market,” Krinsky says. “But they can become more stretched.”
http://www.barrons.com/articles/new-highs-for-this-momentum-powered-market-1509765341

www.yahoofinance.com

https://www.ishares.com/us/products/251614/ishares-msci-usa-momentum-factor-etf

Continue reading →

Topley’s Top Ten – Friday Review

1.Annual Cost of Entitlements Now 13% of GDP.

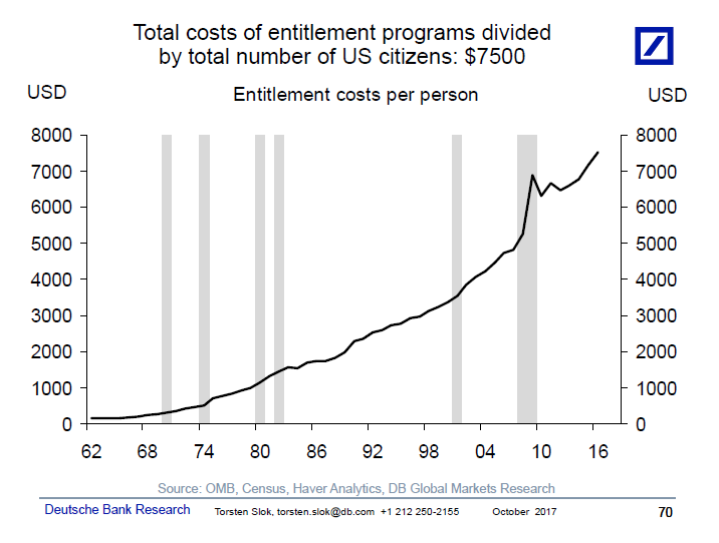
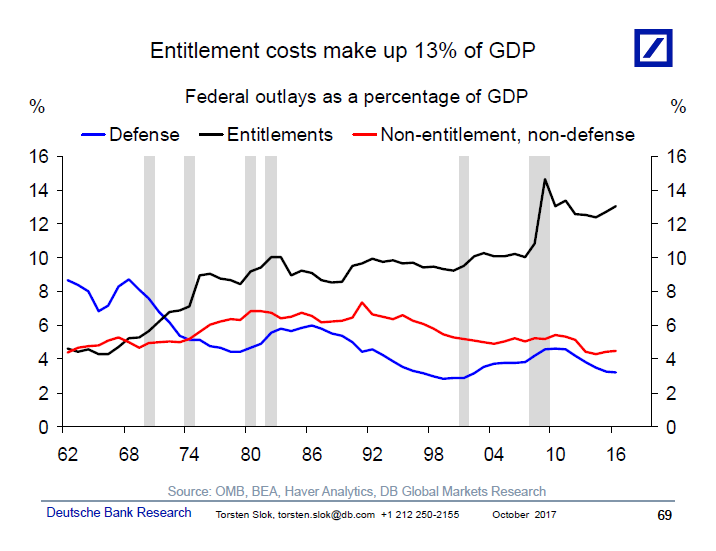
The annual cost of US entitlement programs is now $7500 per US citizen, see first chart below, and entitlement spending is by far the biggest part of US government spending, currently making up 13% of US GDP, see the second chart. If nothing is done, then these costs will continue to grow over the coming decade. For more discussion of the US fiscal situation see also our latest piece here: http://pull.db-gmresearch.com/cgi-bin/pull/DocPull/16008-9F31/84945046/3923bc52-9f75-11e7-a2a8-c5fd342d2ccc_604.pdf
Let us know if you would like to add a colleague to this distribution list.

Torsten Sløk, Ph.D.
Chief International Economist
Managing Director
Deutsche Bank Securities
60 Wall Street
New York, New York 10005

2.This could be the first calendar year ever with positive returns every month

By
Ben Carlson
A Remarkable Run for Stocks Gets More Extraordinary

This could be the first calendar year with positive returns every month.

By
Ben Carlson

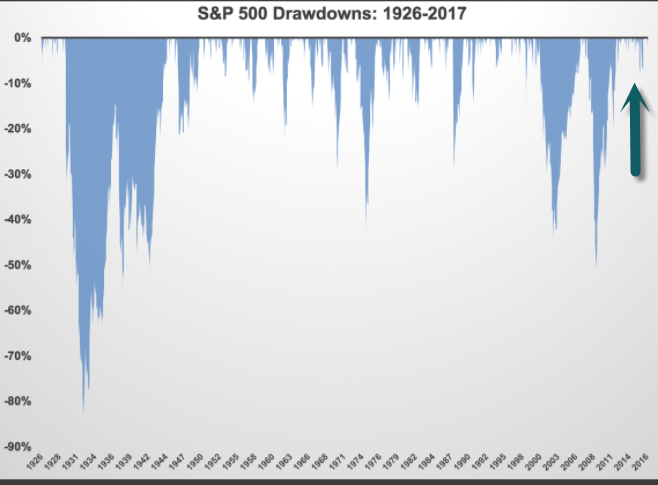
With a 2 percent gain in September, the S&P 500 Index has set a record: positive returns 1  in each of the first 10 months of the year. There’s never been a full calendar year when this has happened every month.

Going back to November 2016, the index has ripped off 12 consecutive monthly gains. The S&P hasn’t had a down quarter since the third quarter of 2015, a streak of eight in a row without a loss. Since the start of 2013, 18 of the past 19 quarters have been positive. And it’s not like stocks are melting up either. They are going up slowly as volatility is slowly going down.

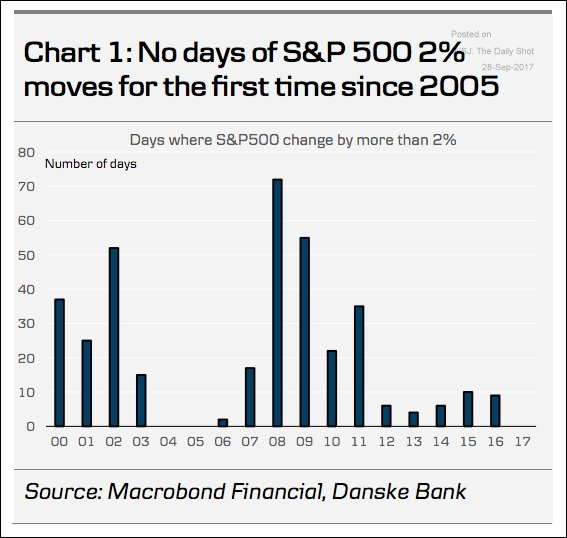
Not only have stocks been consistently profitable recently, but they have done so with remarkably low volatility. This year, there has yet to be a 2 percent move up or down on the S&P 500. For a frame of reference, in 2009, there were 55 separate 2 percent up or down days and there were 35 in 2011. The annualized volatility of daily returns on stocks since 1928 has been 18.7 percent. For 2017, that number is 7 percent, a little more than one-third of the long-term average.

https://www.bloomberg.com/view/articles/2017-10-09/a-remarkable-run-for-stocks-gets-more-extraordinary

 Found at www.abnormalreturns.com

3.90 New Cryptocurrency Hedge Funds in One Year.

There are now more than 120 hedge funds focused solely on bitcoin, digital currencies

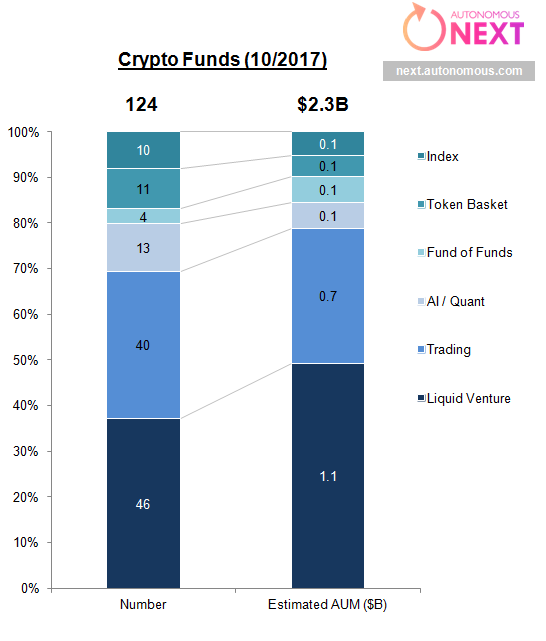
Data shared exclusively with CNBC from financial research firm Autonomous Next shows the number of funds investing in digital assets like bitcoin has grown rapidly to 124.

Autonomous Next also estimates that the “crypto-funds” have about $2.3 billion in total assets under management.

While several leading Wall Street banking executives remain skeptical about bitcoin, more seasoned money managers are moving into digital assets management.

Evelyn Cheng | @chengevelyn

More than 90 funds focused on digital assets like bitcoin have launched this year, bringing the total number of such “crypto-funds” to 124, according to financial research firm Autonomous Next.

Data shared exclusively with CNBC Friday showed that the largest share of the funds, 37 percent, used venture capitalist-type strategies and had about $1.1 billion in assets under management. Funds focused on trading digital assets came second at 32 percent, with about $700 million in assets under management.

Funds specifically using machine learning, data science or statistical arbitrage on digital currencies came in third at 10 percent and $100 million in assets under management, the data showed.

Total assets under management by crypto-funds now stands at $2.3 billion, according to Autonomous Next’s estimates.
 

https://www.cnbc.com/2017/10/27/there-are-now-more-than-120-hedge-funds-focused-solely-on-bitcoin.html

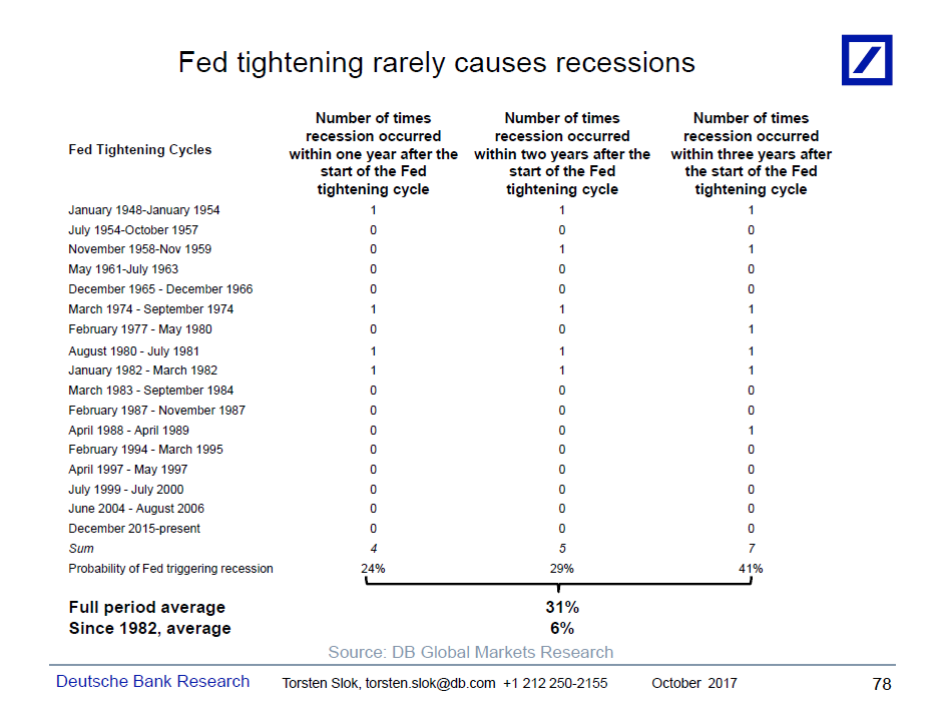
4.Fed Tightening Only Results in Recession 36% of Time.

I often meet investors who argue that long rates will stay low throughout this entire cycle because “Fed tightening always results in a recession.” But the data below shows that Fed tightenings rarely result in a recession. In fact, since WWII Fed tightenings have only resulted in a recession 31% of the time, and since 1982 only 6% of the time.

Looking ahead, once core PCE inflation starts moving back up toward 2% in 2018H1 – as we, the consensus, and the Fed expect – then rates investors will begin to realize that there is no recession on the horizon and therefore short rates, the belly, and long rates be significantly higher than where they are today. And chances are that the economy will do just fine.

For more discussion see also our recent piece: The next US recession. Happy to discuss further, let your DB sales contact know.
Let us know if you would like to add a colleague to this distribution list.

Torsten Sløk, Ph.D.
Chief International Economist
Managing Director
Deutsche Bank Securities
60 Wall Street
New York, New York 10005
Tel: 212 250 2155

5.The Real Bull Market….Longest Bond Bull in 500 Years.

  • New Bank of England paper explores bond bull markets since the 13th century.
  • The current market, at 34 years, is the second longest in recorded history.

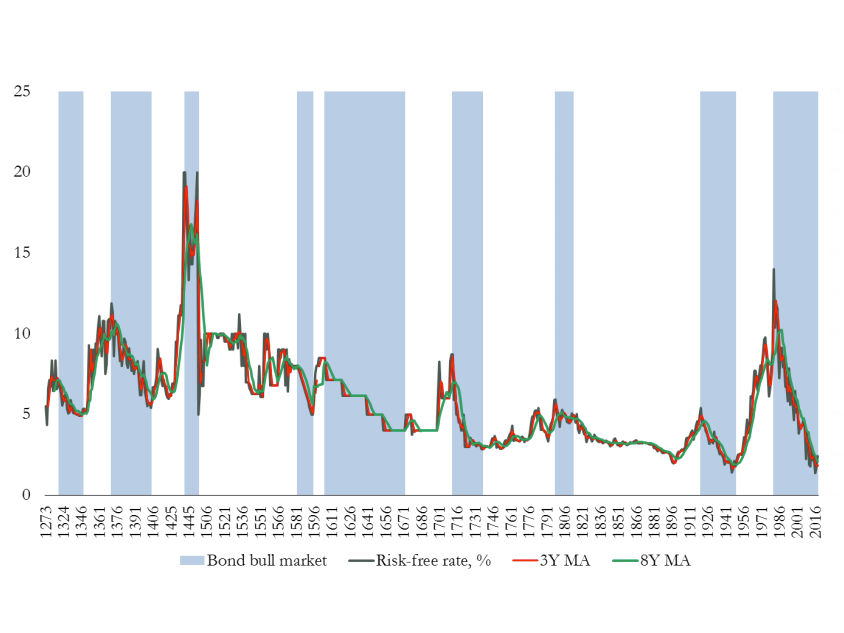
LONDON — We’re currently living through the second longest bond bull market in recorded history, and the longest since the 16th century, according to a new research paper from the Bank of England.

Written by Paul Schmelzing, a Harvard PhD candidate currently working with the bank, the paper, titled “Eight centuries of the risk-free rate: bond market reversals from the Venetians to the ‘VaR shock’” — explores hundreds of years of data around real rates and bonds.

“This paper presents a new dataset for the annual risk-free rate in both nominal and real terms going back to the 13th century. On this basis, we establish for the first time a long-term comparative investigation of ‘bond bull markets’,” Schmelzing writes.

The paper — which started out as an entry on the Bank of England’s staff blog, Bank Underground — argues that the current bull market in bonds is only surpassed by one longer period of growth in recorded history.

“The average length of bond bull markets stands at 25.8 years, and the range falls between 61 years (1451-1511) and 12 years (1718-1729). Our present real rate bond bull market, at 34 years, is already the second longest ever recorded,” Schmelzing writes.

Here’s the chart (note that blue shaded areas represent periods of bull markets):

http://www.businessinsider.com/bank-of-england-paper-on-bond-bull-markets-through-the-years-2017-10
6.Coming Surge of 35-44 Year Olds After 15 Year Decline….Number Could Hit 48 Million by 2030.

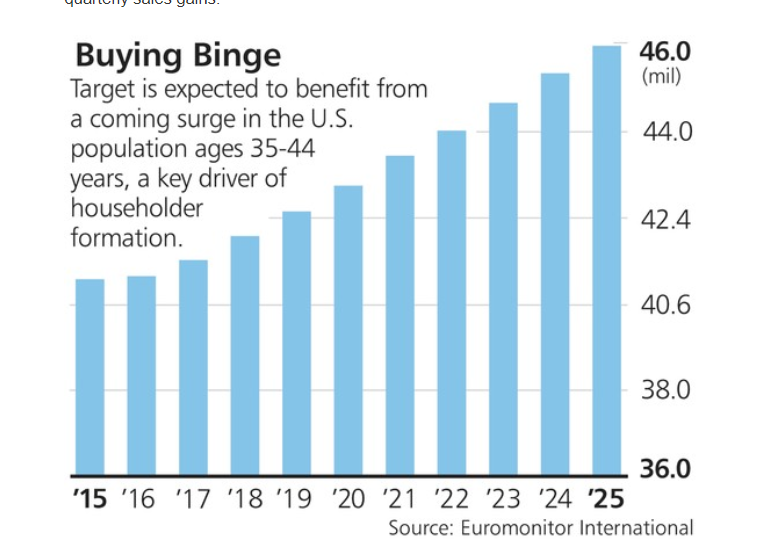
Jason Clark, a senior portfolio manager at AFAM Capital, cites a coming surge in the number of Americans 35 to 44 years old, after a 15-year decline. This population cohort, responsible for a significant share of U.S. household formation, could total about 48 million by 2030, according to Euromonitor International, up from roughly 40 million now. As younger adults marry, buy homes, and have children, says Clark, many will look to Target for its wide selection of low-priced but trendy “stuff” for their kids and homes.

http://www.barrons.com/articles/targets-renovation-could-pay-off-nicely-for-investors-1509161942
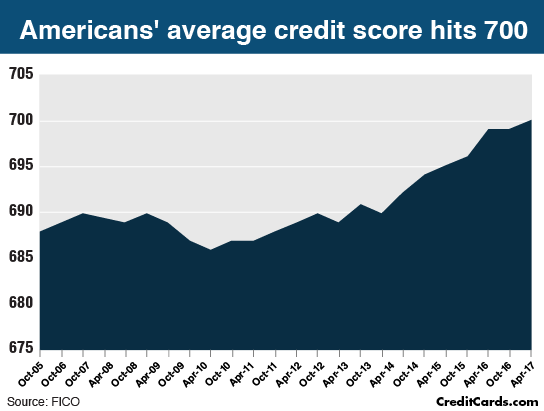
7.America is a Nonprime Nation….Two-Thirds of Americans Have a Nonprime Credit Score Below 700.

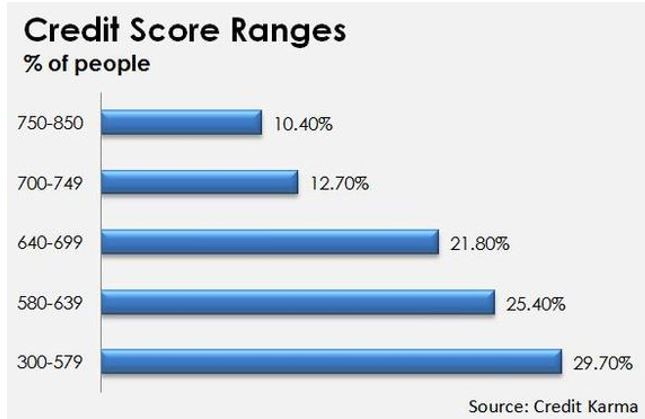
America is a nonprime nation. An astounding two-thirds of Americans have a nonprime credit score (below 700) or no score at all, according to the Corporation for Enterprise Development and FICO. Due to high credit-score requirements, some 160 million Americans find it difficult or impossible to access traditional bank credit. The way for banks to grow and better serve their communities is to figure out how to lend again, safely and profitably, to a much broader range of customers. Banks need a new generation of nonprime credit products.

https://www.wsj.com/articles/regulators-can-help-american-workers-get-the-credit-they-deserve-1509059100?tesla=y
The Good News is Improvement Since Great Recession.
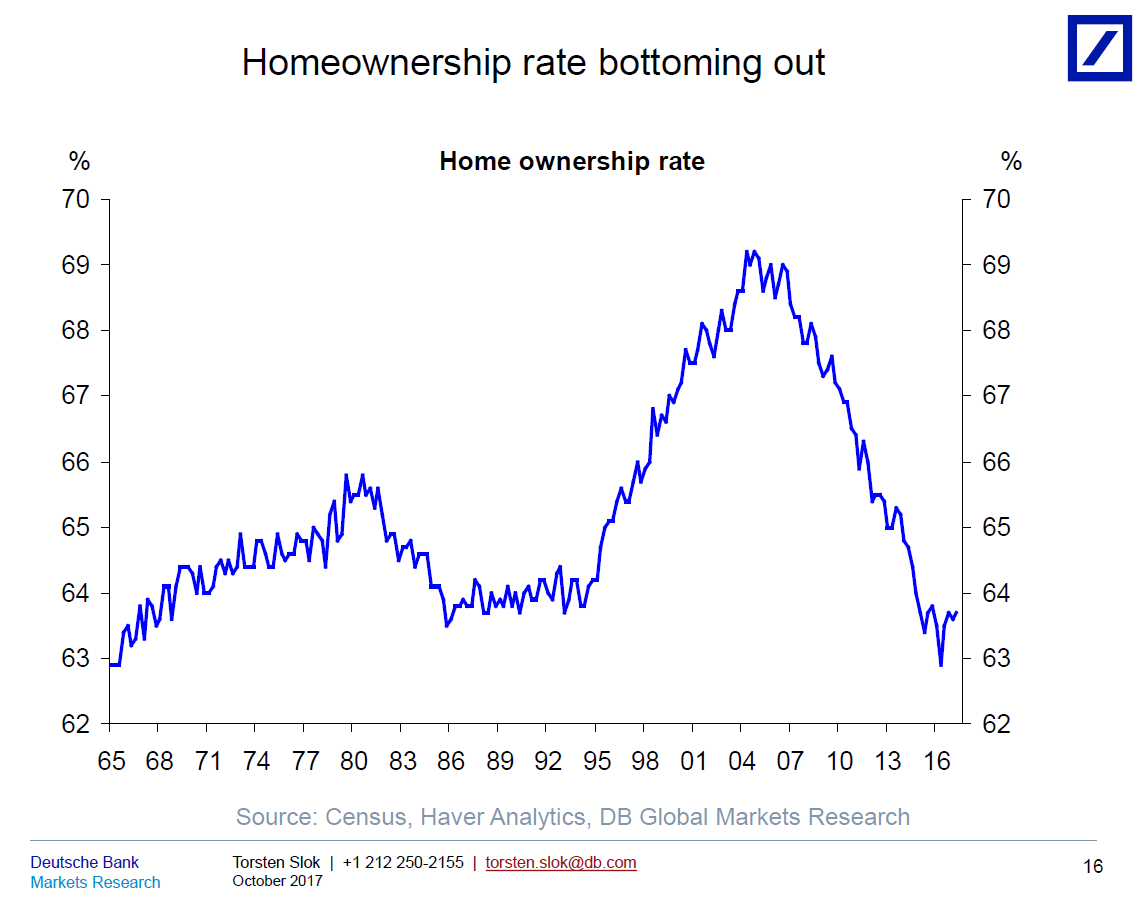
8. Has the Home Ownership Rate Bottomed Out?

Torsten Slok DB Bank
9.Read of the Day…A  Moment of Silence Please…World wine production ‘to hit 50-year low’

24 October 2017
Share this with Twitter

Global wine production is expected to fall to its lowest in more than 50 years, according to the International Organisation of Vine and Wine (OIV).

The group blamed the decline on extreme weather in Italy, France and Spain – the world’s top three producers.

Total world output is projected to fall 8% from last year to about 247 million hectolitres.

This could raise prices and dissipate a global surplus caused by a demand slump in the wake of the financial crisis.

According to OIV estimates, Italian wine production will fall 23% to 39.3 million hectolitres.

Levels will drop 19% to 36.7 million hectolitres in France which is predicted by the European Commission to be facing its worst harvest since 1945.

Meanwhile in Spain, production will be 15% lower at 33.5 million hectolitres.

A hectolitre is 100 litres, equivalent to about 133 standard 750mL bottles.

As a result, small producers hit by several years of small harvests “are facing the very real problem of having to sell family domains because, unless the banks are going to help them in some way, they’re stuck,” according to Rupert Millar, fine wine editor of industry journal The Drinks Business.

“But just how many this is happening to is another question,” he adds.

For wine-growing regions outside Europe, OIV’s forecasts are more optimistic.

Australian production is expected to rise 6% to 13.9 million hectolitres, and by as much as a quarter in Argentina to 11.8 million hectolitres.

Output in the US – the world’s fourth-largest producer and its biggest wine consumer – is also due to fall by only 1% since reports indicate wildfires struck in California after the majority of wine producers had already harvested their crops.

There was no data available for producers such as China, which produced 11.4 million hectolitres last year.

View comments
http://www.bbc.com/news/business-41728536

10.Don’t Justify What You Want to Change

Steven Stosny, Ph.D.Anger in the Age of Entitlement

Free yourself from the chains of resentment.

Justifying resentment is like justifying hunger; you never have to do it. You never have to ask yourself, “Is my resentment justified?” The more important question is, “Do I want to be resentful?” If you don’t, you need to understand that justifying resentment strengthens and prolongs it.

There’s a neurological explanation for this. Resentment keeps us focused on a perception of unfairness – we’re not getting the help, appreciation, praise, reward, or affection we deserve. Mental focus amplifies and magnifies, whatever we focus on becomes more important than what we don’t focus on. Repeated focus over time forms mental habits. Justifying resentment strengthens the neural connections underlying it, and over time makes it more or less automatic, the default perception of consciousness. Resentful people complain and criticize out of habit.

Resentment is likely to become a bedrock of ego-defense, due to its low-grade adrenaline, which temporarily increases energy and confidence. We feel animated by the perception that we’ve been wronged, which feels better than the self-doubt and low energy that often occurs when we feel vulnerable. The problem with adrenaline is that it borrows energy from the future. After a bout of resentment, a crash into some form of depressed mood is inevitable. Worse, adrenaline enhances memory – experience marked by adrenaline is, in general, recalled more easily. (It’s often hard to get it out of your mind.) When you resent your partner, you’ll remember every perceived offense since you started living together. Instead of experiencing negative feelings as temporary states, it seems like you’re reacting to unfair or unreliable behavior that will not change and that overshadows most positive experience.

The other problem with adrenaline is that we build a tolerance to it so that it takes more and more of it to get the same level of energy and confidence. That means we have to justify more by amplifying and magnifying more. At that point resentment becomes chronic, the lens through which we see the world.

Characteristics of chronic resentment are:

  • External regulation of emotions – other people seem to control your emotional states – they “push your buttons” or make you feel what you don’t want to feel.
  • Vulnerable emotions – guilt, shame, sadness – are seen as punishments to be blamed, denied, or avoided, rather than motivations to heal and improve
  • Narrow and rigid emotional range – you’re either resentful or numb.

Characteristics of chronic resentment in relationships:

  • High emotional reactivity – a negative feeling in one triggers chaos or shut down in the other
  • Power struggles – the goal is to win and be right rather than reconcile and connect
  • Criticism, stonewalling, defensiveness, contempt.

The Urge to Justify

We justify resentment by citing evidence of other people’s unfairness.But the adrenaline we need for justification makes us subject to confirmation bias. The human brain is highly susceptible to confirmation bias under the influence of emotion arousal; it automatically looks for evidence that confirms its assumptions and ignores or discounts evidence that disconfirms them. Many studies have shown that whatever the brain looks for, it tends to find, in reality or in imagination.

The urge to justify is essentially self-talk, that is, we justify our feelings more to ourselves than to others. The urge to justify tells us that the emotion is probably not good for us, or else we wouldn’t have to justify it. You probably don’t have to justify an emotion that’s more conducive to health and well-being, such as compassion. You don’t go into work and say, “I was under so much stress last night and my partner pushed all my buttons and I lashed out with compassion, I took her perspective and felt more humane – it wasn’t the real me!”

You have an absolute right to your resentment. And you have a more compelling right to a live value-filled life, which is impossible with resentment.

https://www.psychologytoday.com/blog/anger-in-the-age-entitlement/201710/don-t-justify-what-you-want-change

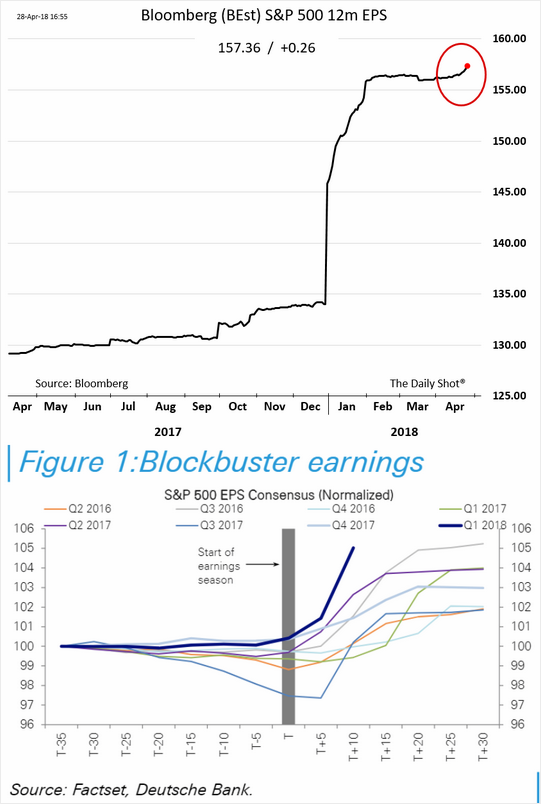
Topley’s Top Ten – October 30, 2017

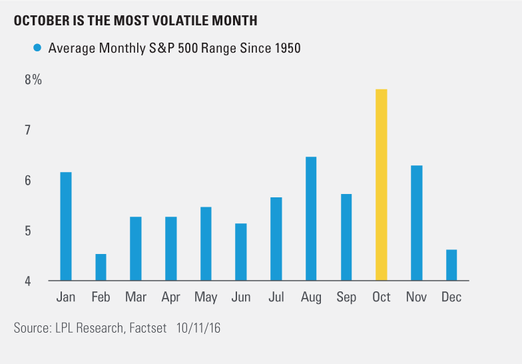
1.2017-The Least Volatile October Since 1928

And it is strange how quiet the market is. October, remember, is supposed to be the market’s most volatile month. Through Thursday, however, it was the least volatile October on record going back to 1928, according to Ben Bowler, global head of equity derivatives research at Bank of America Merrill Lynch
http://www.barrons.com/articles/stocks-surge-to-highs-as-tech-roars-again-1509158124

 The Most Volatile Month Not This Year.


Continue reading →

Topley’s Top Ten – Ocotober 24, 2017

1.ISM Hits a 14 Year High

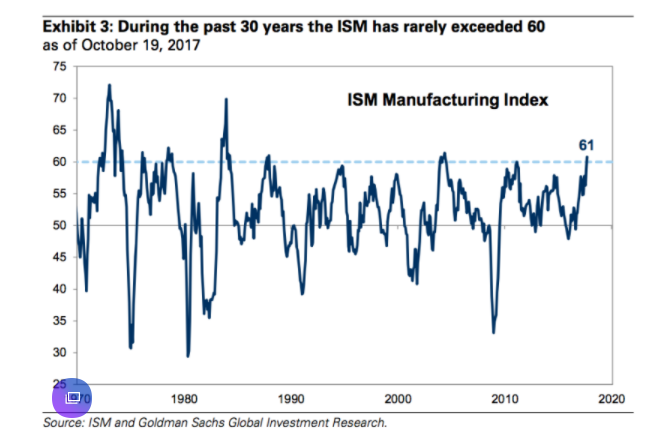
But now, Kostin warns that this could be as good as it gets. He points to the ISM Manufacturing Index, which jumped to a 13-1/2-year high of 60.8 in September. Any reading above 50 signals growth.

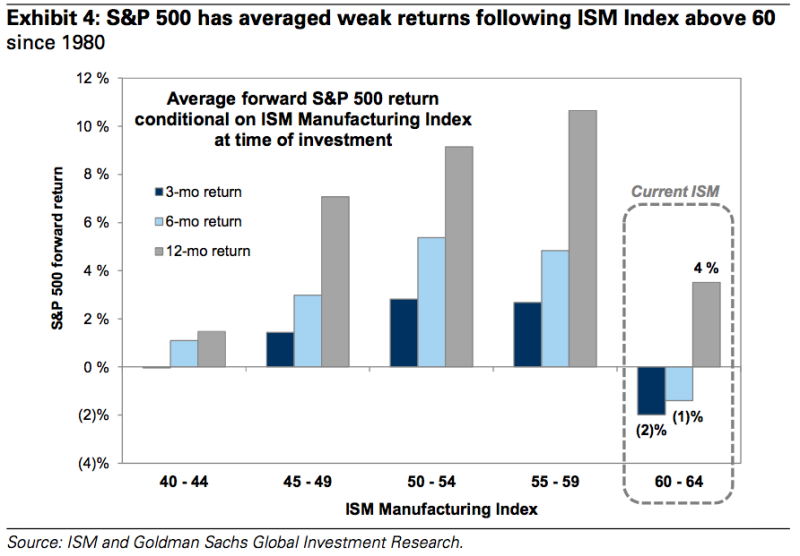
“Although economic data are extremely strong now, an ISM reading above 60 typically marks the peak of growth and presages economic and equity deceleration,” he said. “Since 1980, the ISM has exceeded 60 in eight separate episodes; four of those lasted only one month.”


“Economic growth is the most important driver of corporate earnings and equity performance,” Kostin said.

https://finance.yahoo.com/news/goldman-sachs-warns-peak-growth-falling-stock-prices-3-6-months-100353338.html

Continue reading →

Topley’s Top Ten – October 16, 2017

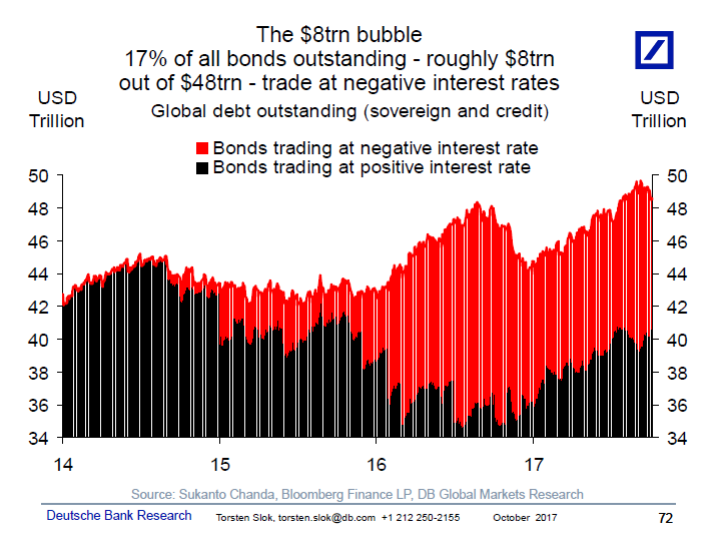
1.Stock Bubble? $8 Trillion in Bonds Outstanding have Negative Interest Rates.

Torsten Slok

Sometimes clients ask me “Where is the bubble in financial markets?”. I think the answer to that question is easy: It is the red area in the chart below. $8trn in global debt is trading at negative interest rates. Think about it; almost a decade after the financial crisis we still have $8trn in bonds which yield negative returns.

It is the unattractiveness of these bonds for investors which is the biggest bubble in markets today. These $8trn in negative yielding assets have forced investors around the world into all kinds of other asset classes such as IG credit, loans, mortgages, HY bonds, equities, and even emerging markets fixed income and equities.

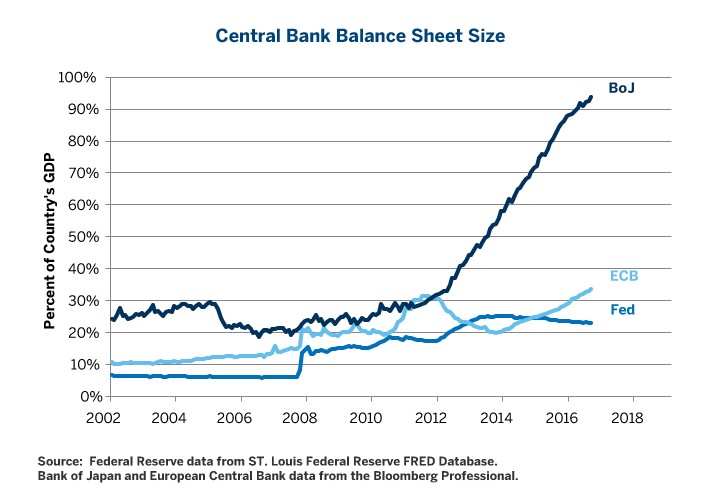
The Fed running down their balance sheet by a 50 billion here and $50 billion there is not going to make a difference to this chart. The real test will be when the red area in the chart below turns black. When these $8trn suddenly begin to yield a positive return how are global investors going to react? The fear is that when the risk-free interest rate goes higher then credit spreads will widen and equities underperform as investors leave risky assets and come home to higher-yielding government bonds. In finance terms, if the risk-free rate goes higher why should I then be buying risky assets?

When will this bubble burst? It will happen the day we begin to see inflation in the US. Because higher US inflation will mean more and faster rate hikes from the Fed, which will mean higher rates globally, including in Europe and also Japan. The good news is that consensus doesn’t expect US core inflation to move higher until 2018Q2. The bad news is that the $8trn in the chart below shows that investors don’t believe we will ever see inflation again. The bottom line is that the central bank exit has barely started and once inflation does start to move higher then checking out from Hotel Easy Money will be a lot more difficult than checking in.

Torsten Sløk, Ph.D.
Tel: 212 250 2155

Continue reading →

Topley’s Top Ten – October 11, 2017

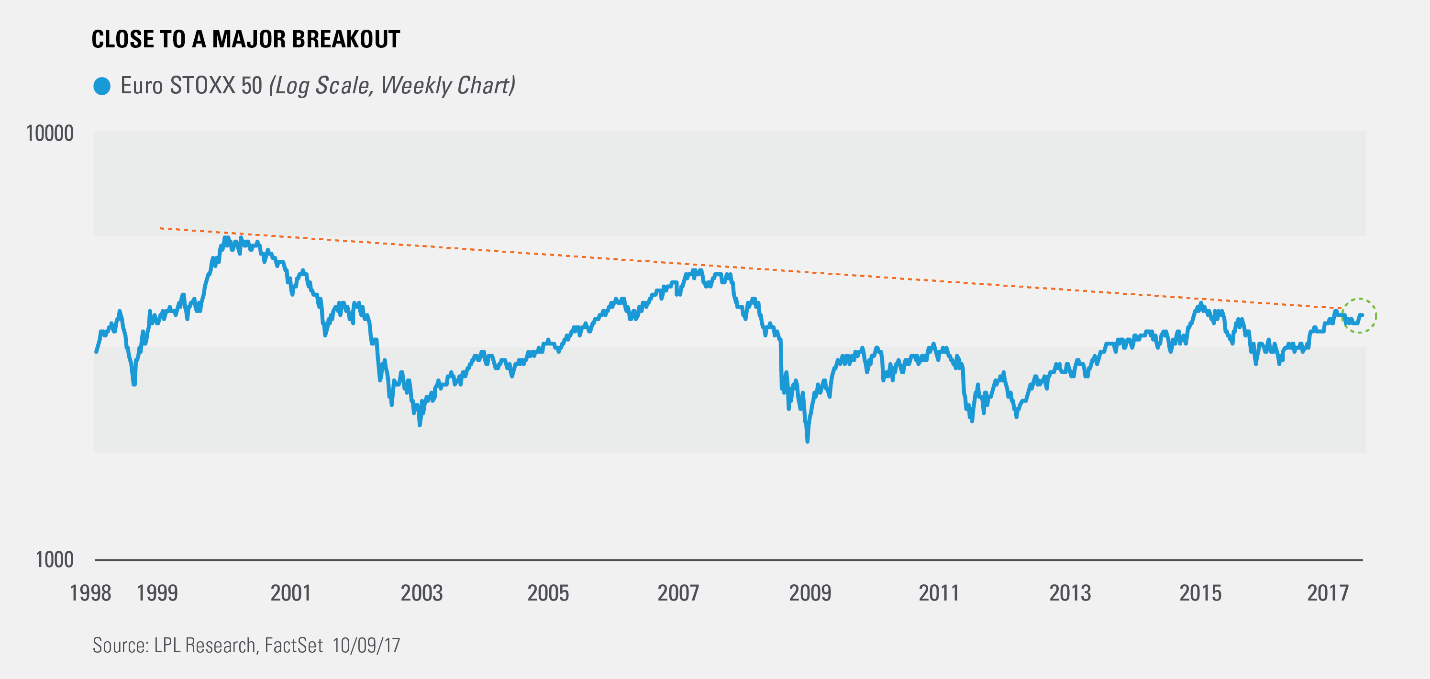
1. Eurostoxx 50 …Close to a Break-Out Level that Goes back to 1999.

Here’s where things get interesting. The monthly chart above shows the Euro STOXX 50 has broken above its long-term trend, but the weekly chart below shows us that the breakout hasn’t happened yet. This is why it is important to look at varying timeframes.

Given various global markets are already breaking out, it is likely only a matter of time until the Euro STOXX 50 breaks out above this trendline. Per Ryan Detrick, Senior Market Strategist, “Though when looking out into 2018 we continue to see better opportunities domestically and in emerging markets, Europe is finally pulling its own weight. This is yet another sign that we are amid a global bull market and it should continue into 2018, if not further.”

https://lplresearch.com/

Continue reading →

Topley’s Top Ten – October 10, 2017

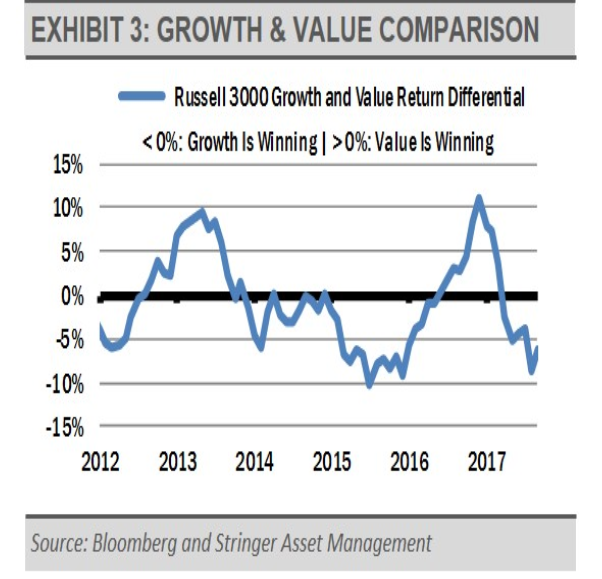
1.The Cycle to Watch Growth vs. Value….Growth is Hitting Record Spreads Versus Value.

As the domestic equity market has appreciated this year, performance has been led by companies in the traditional growth style sectors, such as information technology. The value style has lagged, which results in interesting price dispersions that can create opportunities for investors.

http://www.etf.com/sections/etf-strategist-corner/value-about-outperform-growth/page/0/1

Continue reading →

Topley’s Top Ten – October 6, 2017

1.Foreign Investors Sell U.S. Bonds and Buy U.S. Stocks.

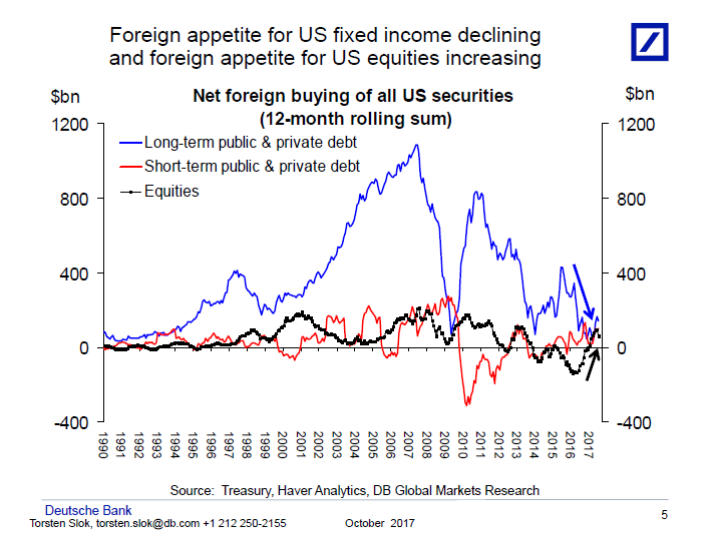
This chart book looks at who is buying and selling US assets and a striking recent trend is the decline in foreign appetite for US fixed income and increase in foreign appetite for US equities, see chart below and chart book here: http://pull.db-gmresearch.com/cgi-bin/pull/DocPull/11626-F2BF/269784806/f77e8642-a92e-11e7-a585-056cc5e4a602_604.pdf

Torsten Sløk, Ph.D.
Chief International Economist
Managing Director
Deutsche Bank Securities
60 Wall Street
New York, New York 10005
Tel: 212 250 2155

Continue reading →

Topley’s Top Ten – September 26, 2017

1.September Rotation Out of Winners Into Losers

Sep 25, 2017

The S&P 500 is currently up more than 1% during the month of September, and if it can simply finish the month in the green, it will be considered a big win given that September has historically been the worst month of the year for stocks.

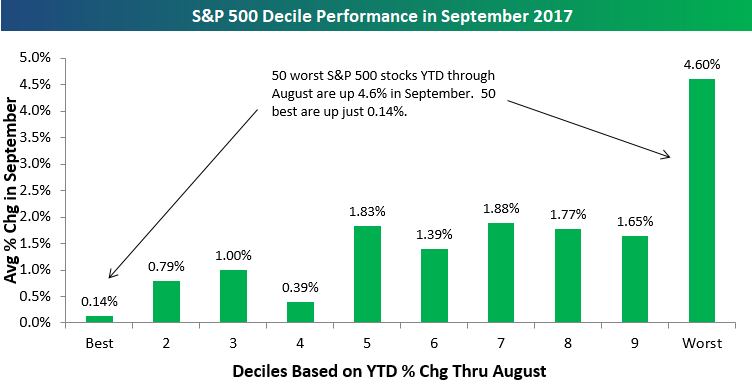
What’s interesting about the market’s performance this month is the underlying stocks that are driving major indices higher.  We broke the S&P 500 into deciles (10 groups of 50 stocks each) based on year-to-date performance through August to see how the year’s biggest winners and losers heading into September are doing this month.

As shown below, it’s 2017’s biggest losers that have posted the biggest gains in September, while the year’s biggest winners have taken a breather.  The 50 S&P 500 stocks that were performing the worst on a YTD basis through August are up 4.6% in September, while the 50 best-performing stocks YTD through August are up just 0.14%.

These stats show that momentum traders are likely under-performing in September.  If you stuck your neck out and bought the most beaten down names, you’re likely having a banner month.

https://www.bespokepremium.com/think-big-blog/

Continue reading →

Topley’s Top Ten – September 25, 2017

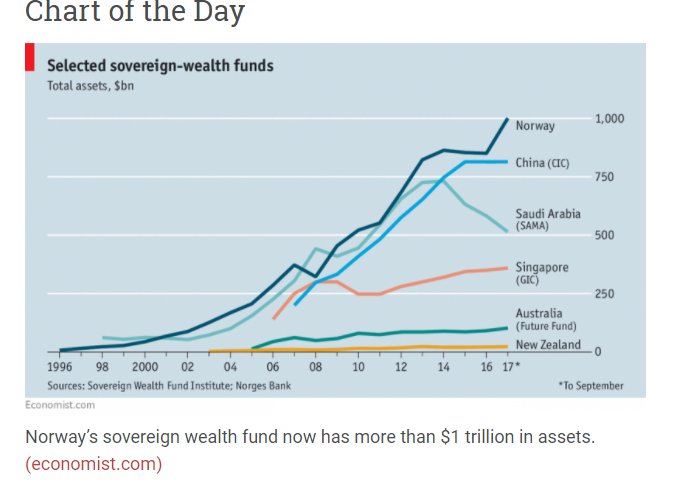
1.Norway Sovereign Wealth Fund Hits $1 Trillion….A Little Larger Than New Mexico.

From
www.abnormalreturns.com

Map of Norway in relation to the United States

When I posted the map of Norway a few days ago, Annie made a comment saying that she didn’t really know the scale of the country and that it was interesting to compare it with its neighbors. When reading that, my very technologically advanced boyfriend said he could make a graphic superimposing Norway atop a map of the US, to see the size in comparison. And here it is! As you can see, it is a long and narrow country, almost as long as the US East Coast. On the West Coast, it would cover the distance from San Diego to Seattle. Enjoy:

Graphic: JY

A few facts:

  • Norway has 4.7 million inhabitants
  • The country is slightly larger than the US state New Mexico
  • It borders Sweden, Finland, and Russia
  • The four biggest cities are Oslo (the capital), Bergen, Stavanger and Trondheim. They are the only cities with more than 100,000 people.
  • Oslo has 573,388 inhabitants

http://www.slowtrav.com/blog/chiocciola/2009/02/map_of_norway_in_relation_to_t.html

Continue reading →

Topley’s Top Ten – September 18, 2017

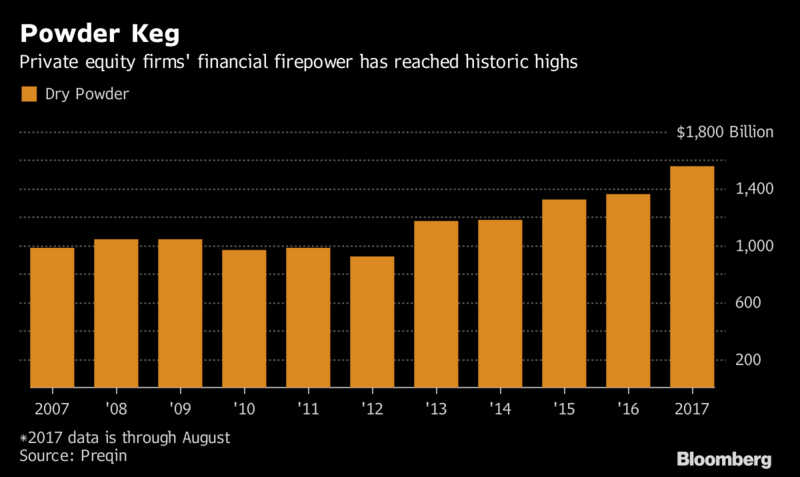
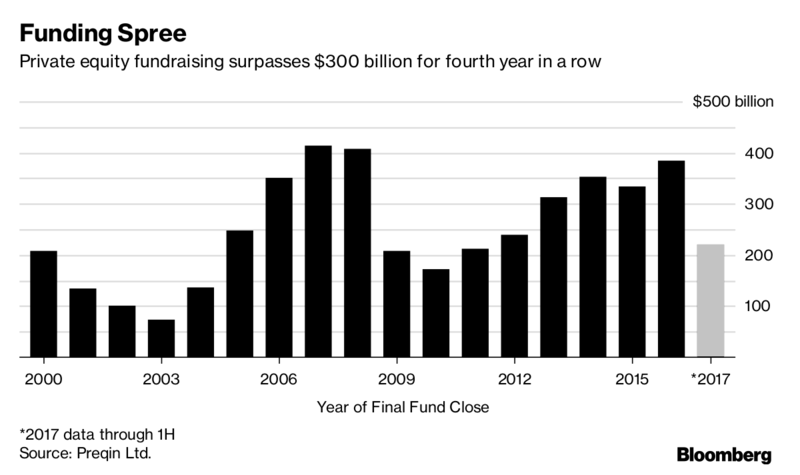
1.Global Private Equity Sitting on $1.5 Trillion in Cash…Up 50% Since 2012

Preqin noted in its 2017 annual report that 48% of institutional investors plan to increase allocations to private equity.

http://www.barrons.com/articles/big-ipo-gain-dont-bet-on-it-1505529036

https://www.bloomberg.com/news/articles/2017-08-08/why-private-equity-is-betting-on-your-online-shopping-addiction

Continue reading →

Topley’s Top Ten – September 12, 2017

1. Longest Rally Since…

Sep 11, 2017

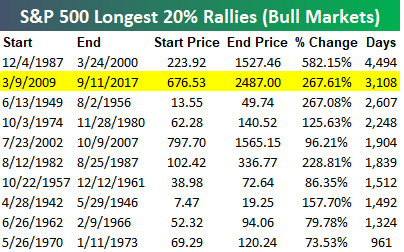
Back in late July we published a Chart of the Day looking at the current rally and how it ranks in terms of length without a significant pullback of any kind.  With the S&P 500 closing at a new all-time high today, it has now been 3,108 calendar days since the last 20% decline (the standard bull/bear market distinction).  As shown in the table below of the longest bull markets on record, the current bull is the second longest behind the 4,494 days that passed between December 1987 and March 2000 without a 20%+ pullback.

Today’s close was also a big deal in terms of gains for the current bull market.  As shown, the S&P’s gain of 267.61% makes this the second strongest bull market on record as well.

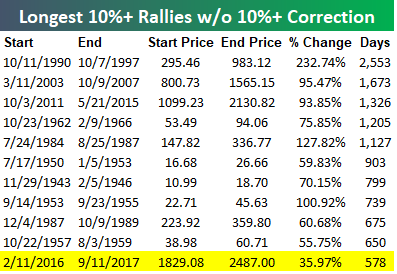
It has also been a long time since the S&P 500 had a 10% correction.  As shown, the current streak of 578 days since the last 10%+ correction is the 11th longest on record going back to 1928.

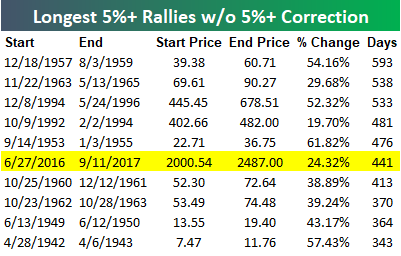
Not only have we not had a 10% correction in more than 18 months, but we also haven’t even had a 5%+ correction since last June.  The 441-day streak without a 5%+ correction is the sixth longest on record for the S&P 500.

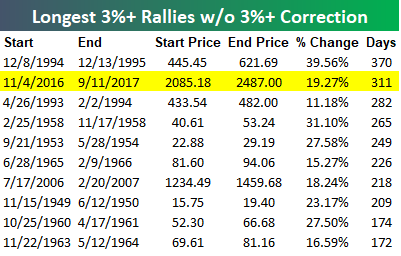
And finally, it has now been 311 days since the S&P 500 last experienced just a 3% pullback.  As shown below, this is the 2nd longest streak of all-time without a 3%+ pullback.

To break this record, we’ll need to go another 59 days without declining 3% from today’s close.

Pay just $1 to access any of Bespoke’s premium membership levels for the next month!

https://www.bespokepremium.com/think-big-blog/

  Continue reading →

Topley’s Top Ten – September 11, 2017

1.Tipping Point for Fed Funds Rate???

 Wells Fargo comments in Barrons

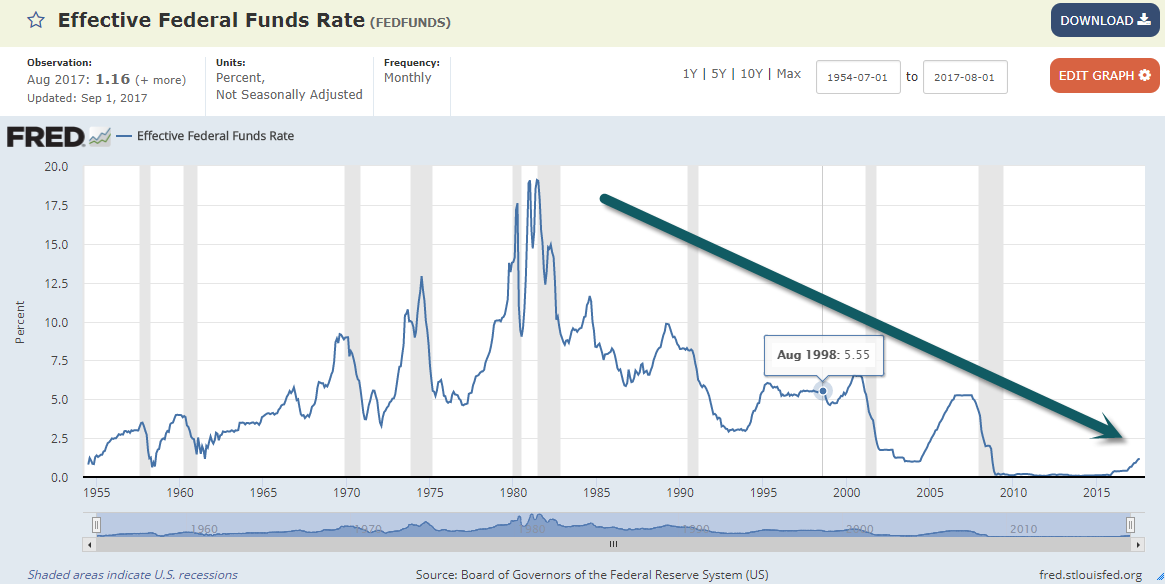
Looking back over six decades, the Wells Fargo team found that the tipping point came when the fed-funds rate exceeded the 10-year Treasury yield’s cyclical low. This has predicted every recession since 1955, with an average lead time of 17 months—producing a significantly earlier warning signal than waiting for the yield curve actually to invert.
What about the current cycle? The 10-year Treasury’s low yield was 1.36%, touched on July 5, 2016. An increase in the fed-funds rate to 1.5%, which the Wells Fargo economists expect at the December FOMC meeting, would trigger the recession early-warning signal. Specifically, their research puts a 69.2% probability of a downturn within 17 months after that.

http://www.barrons.com/articles/trump-and-the-art-of-the-deficit-1504932418


Continue reading →

Topley’s Top Ten – September 5, 2017

1.U.S. Dollar Hitting Some Serious Technical Levels.

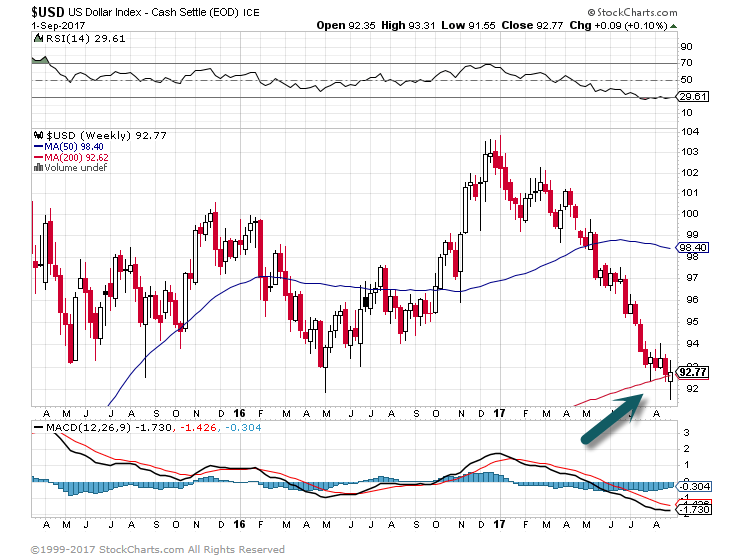
U.S. Dollar Sitting on 200day Moving Average Long Term Weekly Chart.

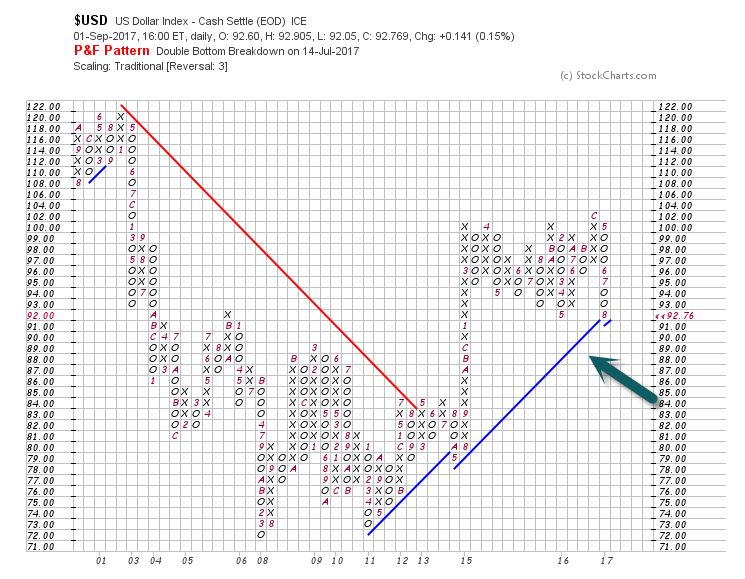
U.S. Dollar approaching uptrend line dating back to 2011

www.stockcharts.com

WSJ-

Shares in U.S. companies with more than half their revenue from outside the country rose by an average of 13%, identical to the gain on MSCI’s (dollar-denominated) index of developed markets excluding the U.S. S&P stocks with less than half their income from abroad gained only 5.9%, according to analysis of FactSet data.

The pattern is even clearer when the market is sliced into five segments from those most exposed to foreign revenues to those least exposed. The most-international fifth of stocks have gained 15% on average this year, while the least-international are up just 2%

https://www.wsj.com/articles/watch-out-the-weak-dollar-gives-shareholders-money-illusion-1504195376

Continue reading →

Topley’s Top Ten – August 25, 2017

1.Revenue and Earnings Growth Per Sector Q2

Ed Yardeni

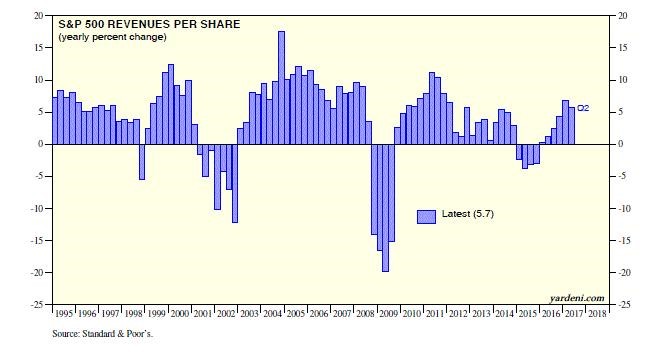
Some sectors shone more brightly than others during Q2. Here is the y/y performance derby for the S&P 500 revenues growth: Energy (14.3%), Tech (9.7), Industrials (7.8), S&P 500 (5.7), Utilities (5.3), Consumer Staples (4.8), Financials ex-Real Estate (4.4), Consumer Discretionary (3.5), Health Care (2.4), Real Estate (0.8), Materials (-1.4), and Telecom (-3.9). 

Here is the same for earnings growth: Energy (returned to a profit), Telecom (45.8%), Tech (34.3), S&P 500 (19.6), Utilities (14.2), Financials ex-Real Estate (13.0), Industrials (12.5), Health Care (8.6), Consumer Staples (6.7), Consumer Discretionary (1.9), Materials (-0.4), and Real Estate (-14.6).

https://www.linkedin.com/pulse/sp-500-earnings-shining-edward-yardeni

Continue reading →

Topley’s Top Ten – August 18, 2017

1.It May Be A Slow IPO Market But Venture Capital Backed Tech Breaks Out to New Highs.

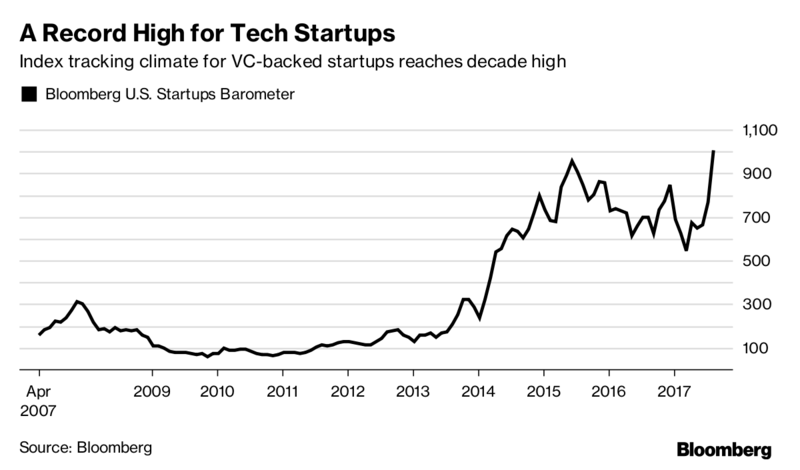
Funding Conditions for Tech Startups Soar to a New Record

An index tracking business conditions for U.S. private companies surged 44 percent from a year earlier.

By
Isabel Gottlieb
August 11, 2017, 8:00 AM EDT

There’s rarely been a better time for American technology startups.

The Bloomberg U.S. Startups Barometer, which tracks the business conditions for U.S.-based private technology companies, reached a record high. A 44 percent increase from a year earlier was driven by a surge in the number of businesses that raised money for the first time, reflecting investors’ appetite to back the riskiest companies. The index, which goes back to 2007, doesn’t account for the frenetic days of the dot-com bubble.

“If you’re leaving Google or Facebook to go do your startup, this is probably the best time ever to do so,” said Wesley Chan, managing director at the venture capital firm Felicis Ventures. “There’s a lot of frothiness in early stage and seed investing.”

https://www.bloomberg.com/news/articles/2017-08-11/funding-conditions-for-tech-startups-soar-to-a-new-record

Continue reading →