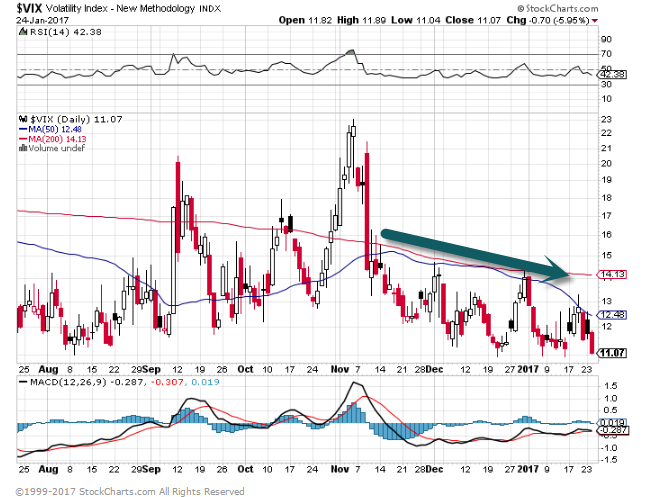
 Clear Vision of Possible New Lows.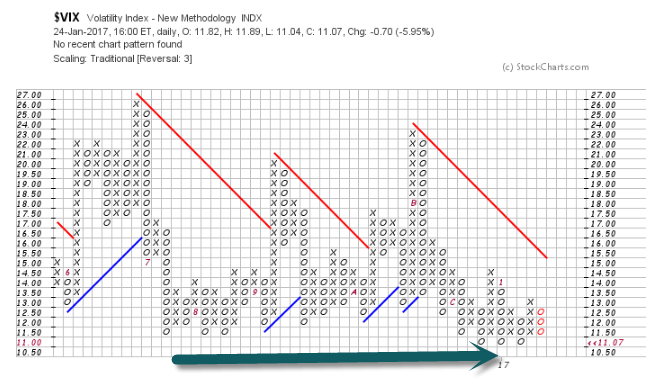
Daily Top Ten – January 24, 2017
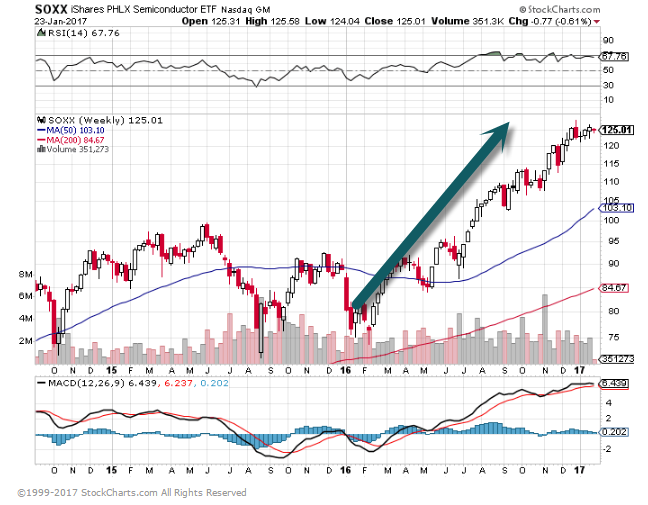
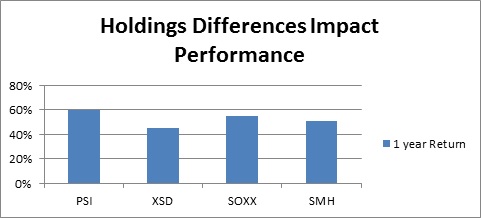
1.Semiconductor ETF +62% Off 2016 Lows.
Cyclical symbol of rising economy.
 Semiconductor ETFs To Consider
The iShares PHLX Semiconductor ETF (SOXX) has $660 million in assets. Exposure is primarily in semiconductor stocks (87% of assets), while semiconductor equipment stocks (13%) like Applied Materials (AMAT) are much less represented. In addition to U.S. stocks, the ETF has exposure to companies based in Singapore and Taiwan, The ETF trades on average 515,000 shares on a daily basis and has a 0.48% net expense ratio.
http://www.etf.com/sections/blog/semiconductor-etfs-looking-another-banner-year
Continue reading
Daily Top Ten – January 23, 2017
1.Jeff Gundlach Barron’s Picks.
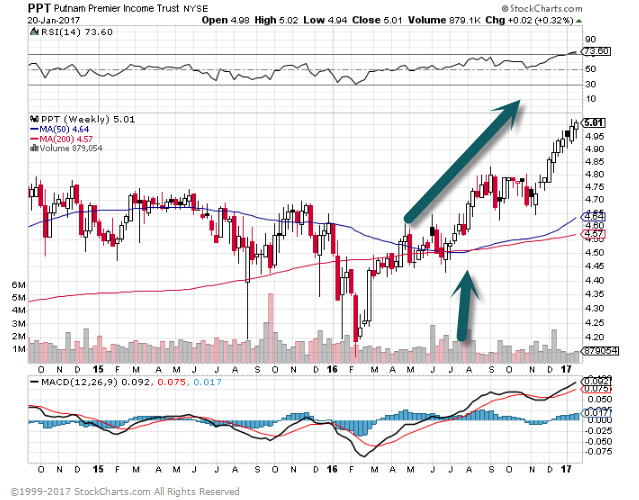
PPT-“one stop shopping, low-risk bond portfolio”
Long India-INDA Positive on Demographics
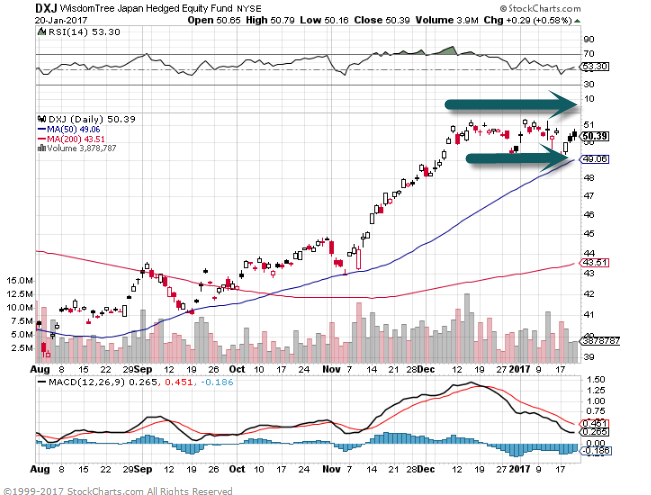
 Long Japan Hedged…Central Bank now Buying Stocks.
 Read Full Gundlach Comments
http://www.barrons.com/articles/2017-roundtable-part-2-manual-for-a-mixed-up-market-1484976857?tesla=y&mod=BOL_twm_ls
Continue reading
Daily Top Ten – January 20, 2017
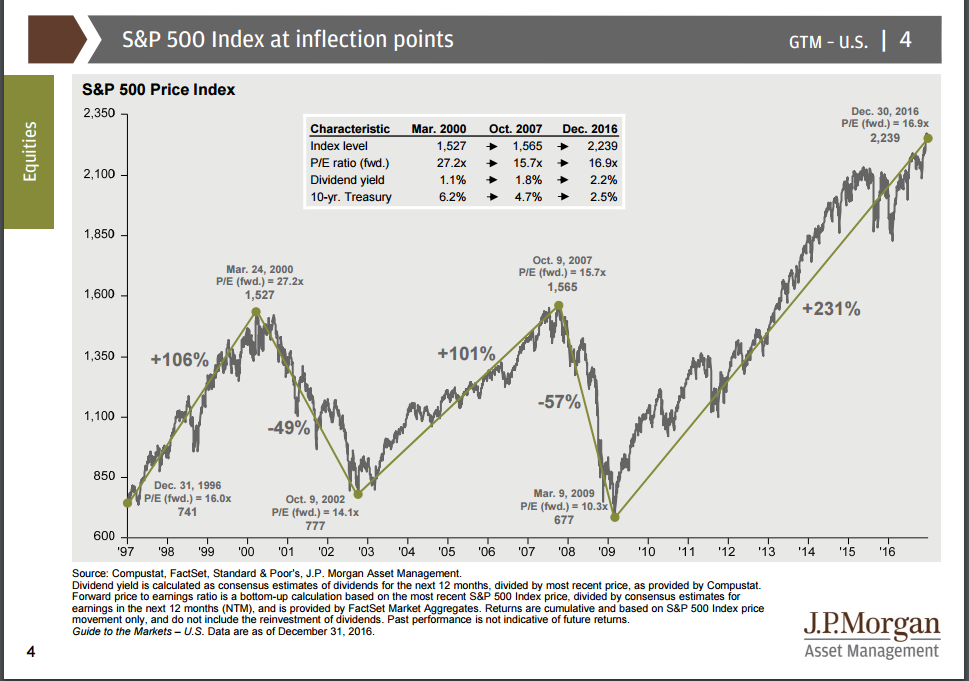
1.Where we Stand on Inaguration Day?
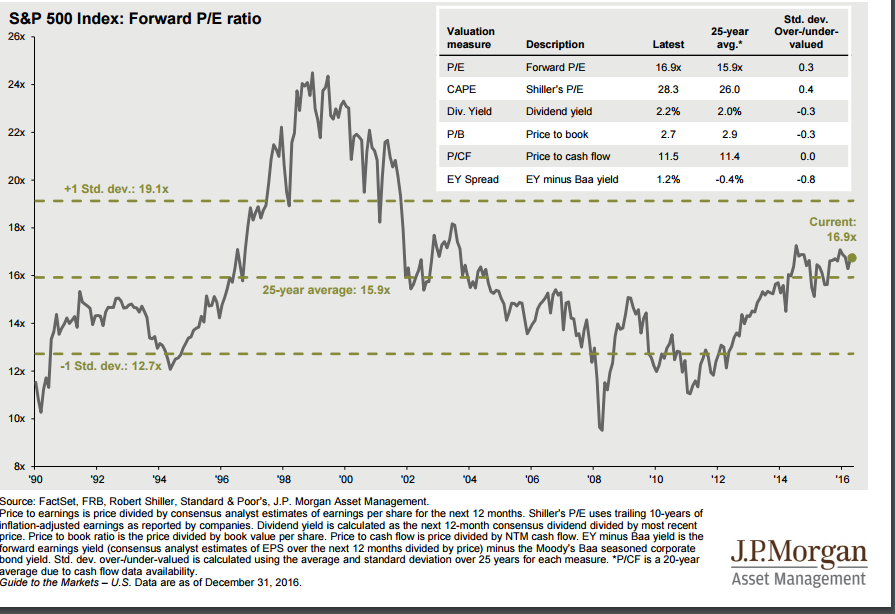
https://am.jpmorgan.com/blob-gim/1383280028969/83456/jp-littlebook.pdf
Daily Top Ten – January 18, 2017
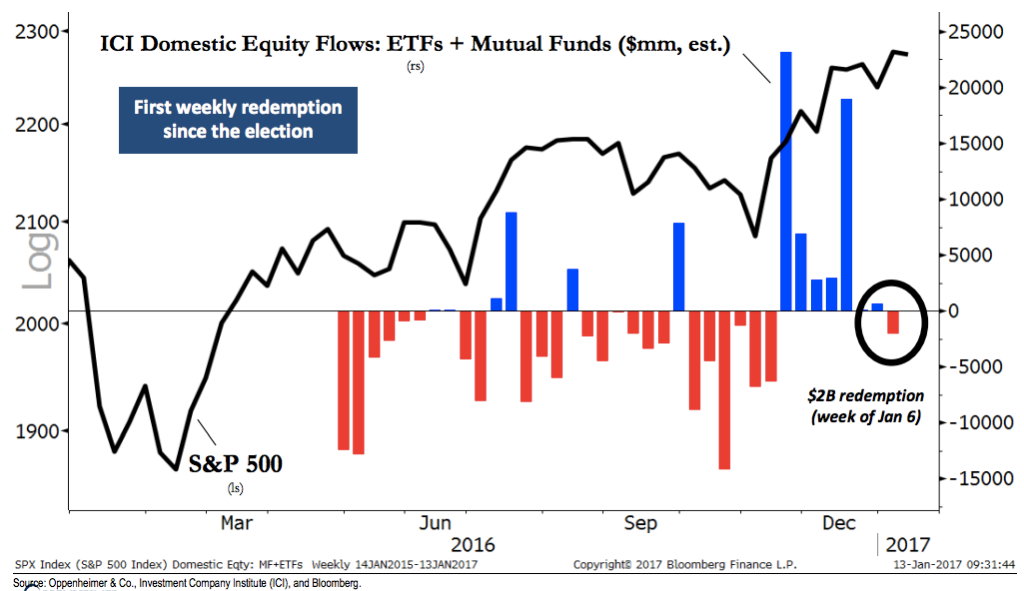
1.The Most Hated Bull Market Ever Continues….January Redemptions in Domestic Equities.
Euphoria? Okay, sure. Maybe in word, but not in deed. Here’s Oppenheimer’s Ari Wald highlighting a divergence that merits attention…
While newsletter surveys are signaling optimism, recent fund flow data suggests that investor skepticism still lingers. For instance, ICI estimated a $2B net outflow from domestic equity ETFs and mutual funds for the week of Jan 6 which marks the first redemption since the US election. What investors are doing is often more important than what they’re saying, and we therefore view this lack of euphoria as a positive for the overall equity cycle.
From Josh Brown Blog
http://thereformedbroker.com/2017/01/17/chart-o-the-day-bullish-but-selling/
Daily Top Ten – January 17, 2017
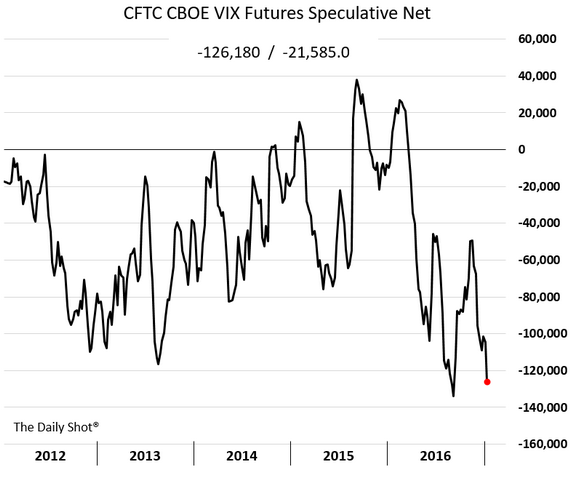
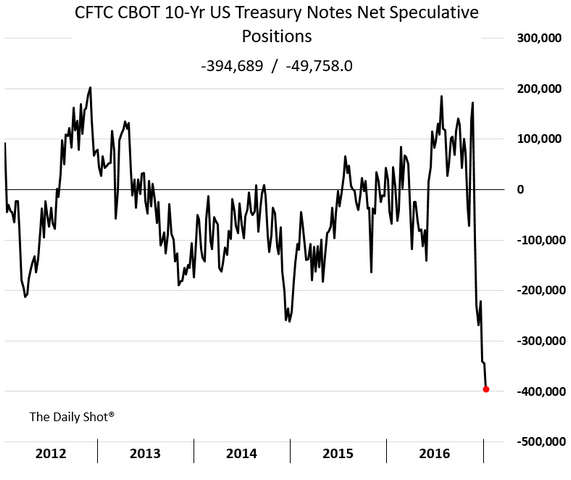
1.Speculators are Massively Short Stock Market Volatility and Short Treasuries….Contra-Indicator???
Equity Markets: Risk appetite in the equity markets remains near multi-year highs. The chart below shows speculative accounts massively short VIX futures.
Rates: Short Treasuries is increasingly becoming a crowded trade. The chart below shows speculative accounts piling into the short 10yr note futures position.
Daily Top Ten – January 16, 2017
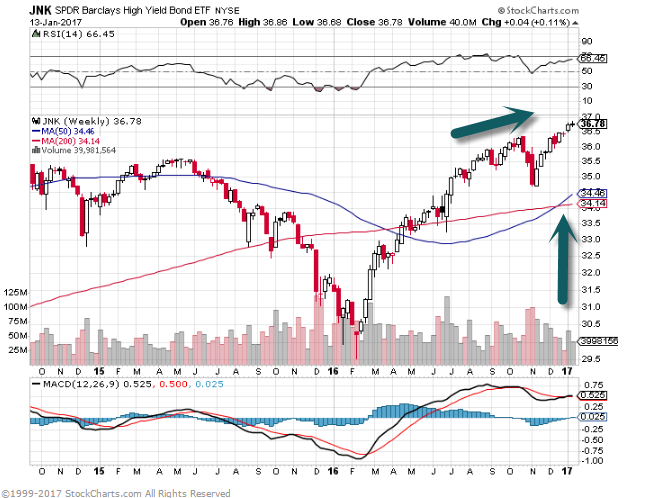
1.Junk Bond ETF Makes New Highs in 2017…$434 Billion of maturing junk paper must be refinanced in next 2 years.
50day thru 200 day to upside on Weekly Chart
Daily Top Ten – January 13, 2017
1.Measuring Europe Thru German Leadership.
German economic growth accelerated more than analysts forecast last year to its fastest pace since 2011,
as falling unemployment and record-low interest rates boosted spending. According to the Federal Statistics Office, GDP growth rose 1.9%, after a gain of 1.7% the previous year. Germany is the first of the world’s biggest developed economies to provide preliminary GDP data for 2016.
www.seekingalpha.com
German DAX-Sideways then Breakout….7% Spike 2017
Daily Top Ten – January 12, 2017
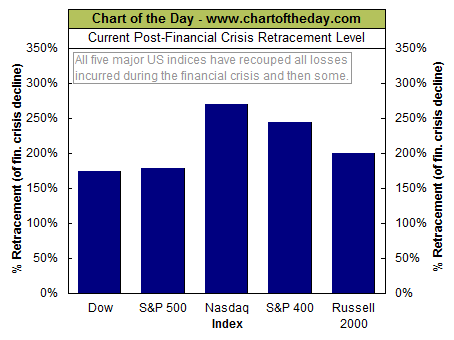
1.Nasdaq 269% Off Bottom.
Chart of the Day
For some perspective on the post-financial crisis rally, today’s chart illustrates how much of the downturn that occurred as a result of the financial crisis has been retraced by each of the five major stock market indexes. For example, the Dow peaked at 14,164.53 back in October 9, 2007 and troughed at 6,547.05 back on March 9, 2009. The most recent close for the Dow is 19,855.53 — it has retraced 174.7% of its financial crisis bear market decline. As today’s chart illustrates, each of these five major stock market indices have retraced over 170% of their financial crisis decline. However, it is the tech-laden Nasdaq that leads the pack with a retracement of 269% — impressive considering the severity of the financial crisis bear market.
Daily Top Ten – January 11, 2017
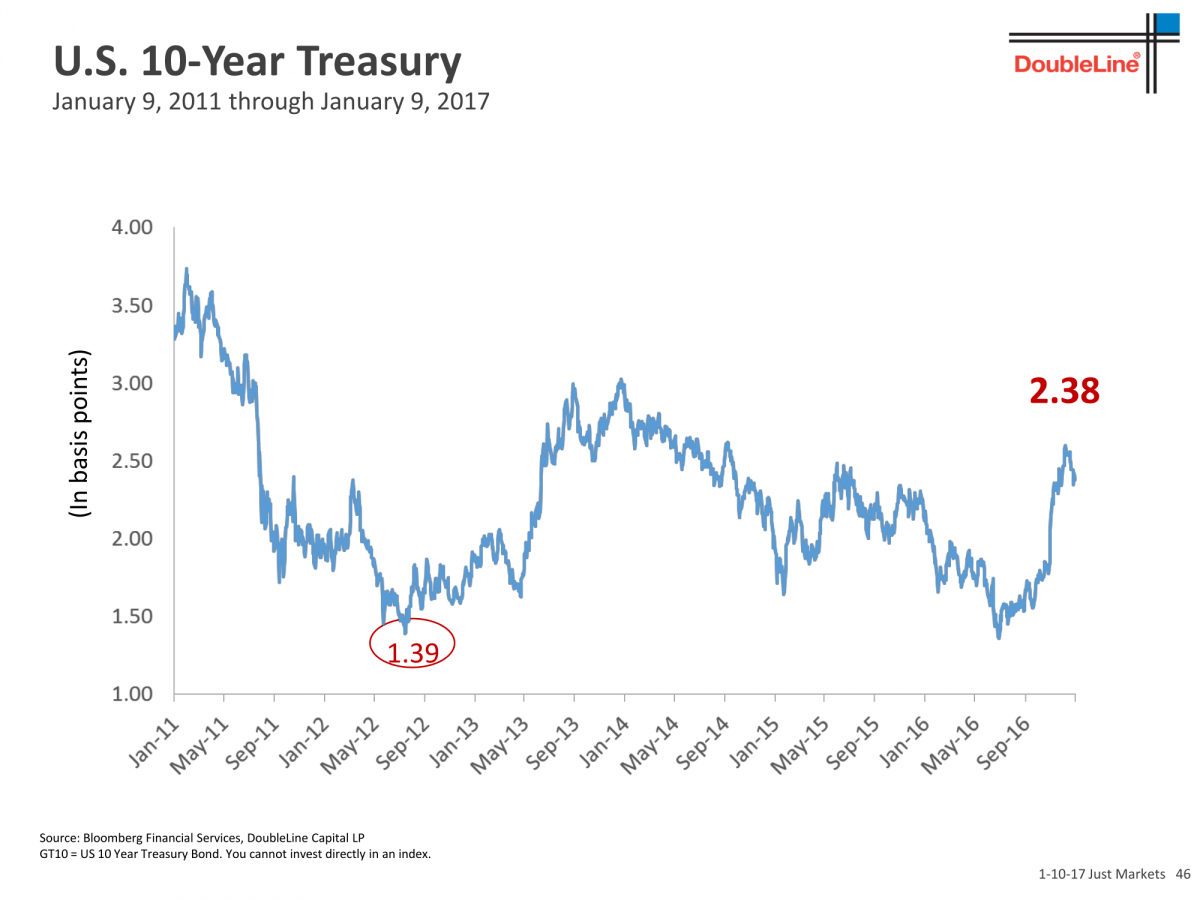
1. Gundlach Deck is Out…10 Year Taking Out 3% in 2017—End of 35 Year Bond Bull?
“Almost for sure we’re going to take out 3% on the 10-year in 2017,” Gundlach said. If we exceed 3% (not 2.6%) in 2017, it’s goodbye to the bull market because you would no longer have declining peaks in yields.
A 10-year above 3%, with the 30-year yield approaching 4%, would also be trouble for the equity market because they would start to look like ‘real’ yields to investors.
Gundlach said it’s not radical to forecast a 6% yield on the 10-year by 2020.
View Full Deck
http://www.businessinsider.com/jeff-gundlach-webcast-2017-outlook-just-markets-2017-1
Daily Top Ten – January 10, 2017
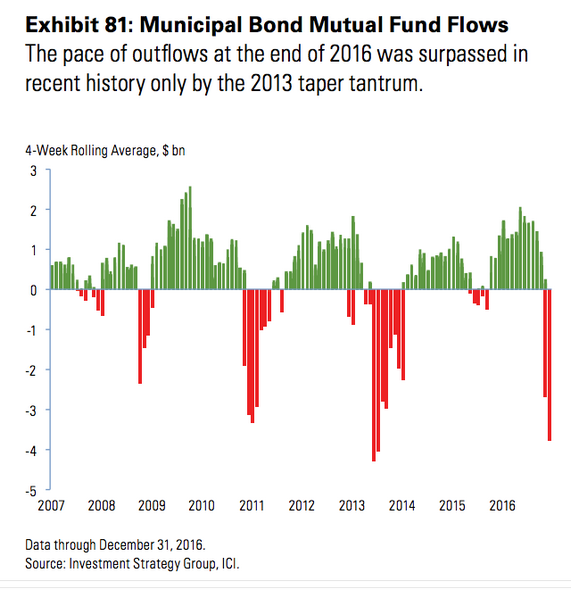
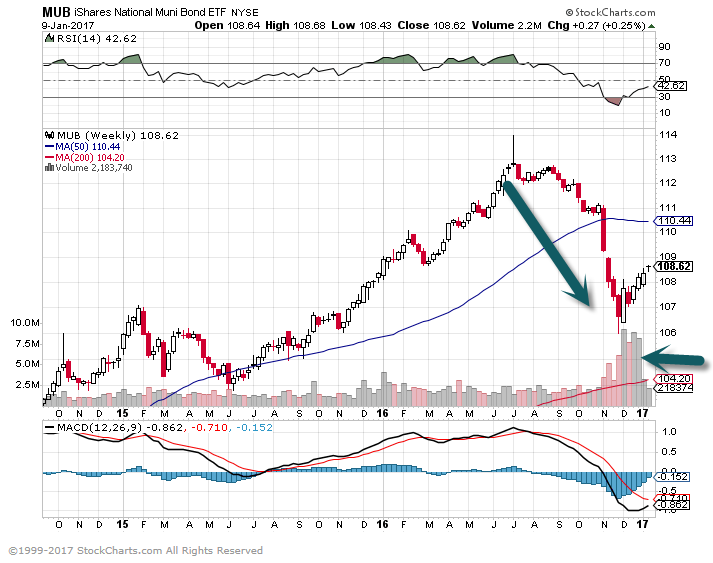
1.Munis See Big Outflows in 2016
Credit: The muni market capital outflows have been substantial, resulting in a rare loss for intermediate-maturity bonds.
Source: Barclays, @NickatFP, @joshdigga
See Huge Volume on Sell Off….Bars at Second Arrow. Big Picture 5% Off Highs.
Daily Top Ten – January 9, 2017
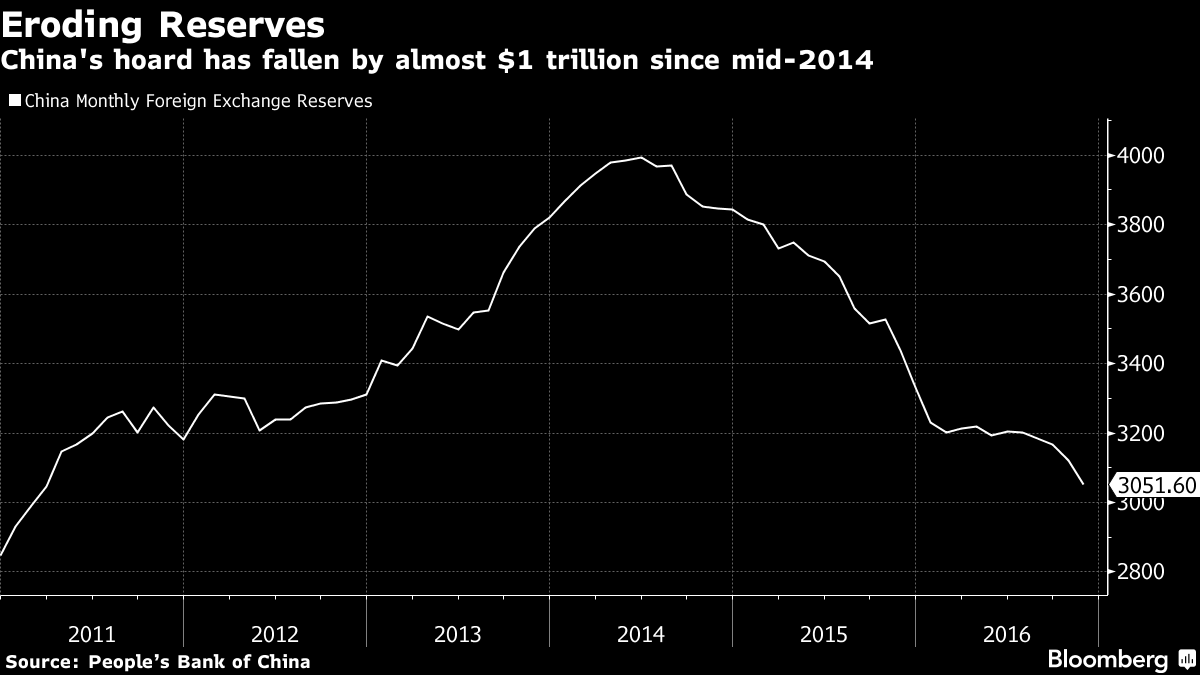
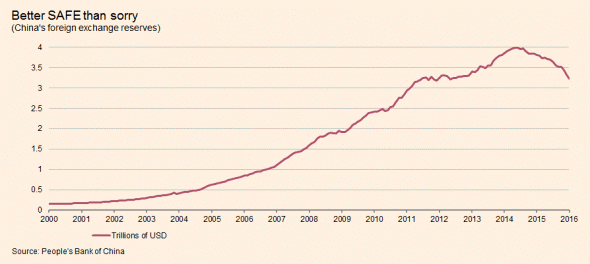
1.China’s Reserves have Fallen by About $1Trillion
China is making it harder to short the Yuan and more difficult to take money out of the country, but time will tell if they can protect the currency forever. …If not, a free floating Yuan will be a new ball game for all currencies.http://www.barrons.com/articles/the-growing-threat-to-global-trade-a-currency-war-1483767171
Longer-Term Look
Daily Top Ten – January 5, 2017
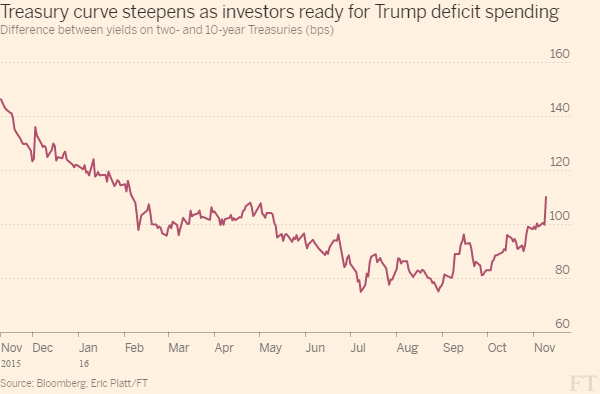
1.Yield Curve Steepening and Showing No Signs of Recession.
The Yield Curve Reflects Good News
I find more reason for optimism in the yield curve – the plot of the yields on 3-month through 30-year Treasury securities. The yield curve has steepened since the election, and this is good news.
The slope of the yield curve has borne a consistent relationship with economic activity. The yield curve has predicted all U.S. recessions except one since 1950. Recessions, as you would expect, correlate positively with bear markets. When the yield curve flattens, or inverts, a recession usually looms and so does a bear market.
That’s not the case today. The yield curve is just the way we should like it – progressively higher with each maturity and upward sloping to the right. When the yield curve steepens, economic growth usually follows.
Yield Curve Slope

http://etfdailynews.com/2017/01/04/dow-20k-is-just-the-beginning-of-a-massive-rally-in-2017/
Daily Top Ten – January 4th, 2017
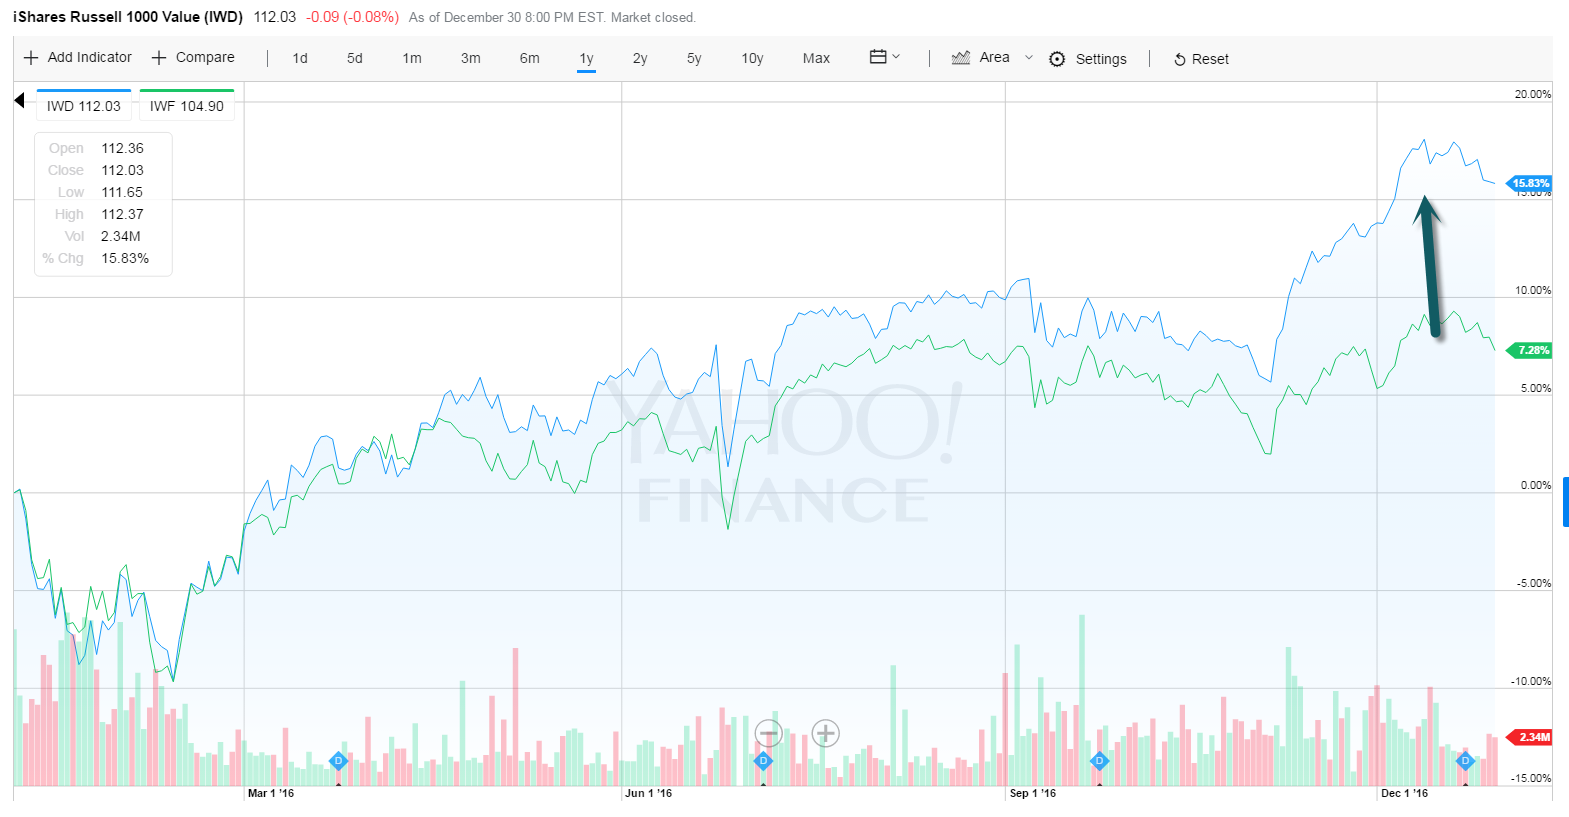
1.2016–Russell 1000 Value +15.83% vs. Russell 1000 Growth +7.28%.
Since then, the iShares Russell 1000 Value ETF (ticker: IWD) has returned 17%, versus 9.1% for the iShares Russell 1000 Growth (IWF). The last stretch of significant outperformance for value ended in 2006, and it was a whopper. Value beat growth by double-digit percentages in five out of seven years, starting with the 2000 dot-com stock bust.
http://www.barrons.com/articles/will-2017-be-the-year-of-the-trump-rooster-1483169072
Daily Top Ten – January 3, 2017
Happy New Year! Thanks for Reading Top 10 in 2016.
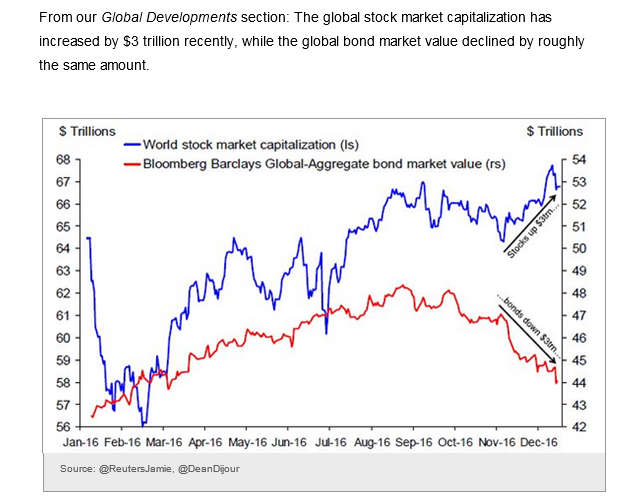
1.Out of Bonds and into Stocks in One Chart
Stock Market Capitalization Up $3 Trillion…Bond Market Capitalization Down $3 Trillion.
Daily Top Ten – December 20, 2016
1.Read of the Day….Josh Brown with a Look at Why it’s Impossible to Time Markets Based on Fundamentals.
Candidate for Read of the Year.
The one thing you need to understand about stock market valuation
Published on December 19, 2016CEO at Ritholtz Wealth Management
Last week, we held our quarterly conference call for Ritholtz Wealth Management, in which Chairman and CIO Barry Ritholtz tackled a host of topics – from presidents’ impact on stock markets to interest rates to annual returns. The call was accompanied by our regular quarterly letter.
One section I found to be very helpful for clients had to do with the CAPE ratio and the concern that valuations on US stocks are elevated relative to history right now. Here’s what Barry and our director of research, Michael Batnick, had to say on the subject:
Let’s start with CAPE – the Cyclically Adjusted Price to Earnings ratio. Think of it as the 10-year P/E. It is high for US equities by historical averages, elevated for Japan, moderate for Europe, and low for emerging markets. If we wanted to scare people, we would selectively pull data out showing at present we have the highest reading outside of 2000 (43.2), 1929 (32.5) and 2007 (27.6). But we don’t cherry pick dates to scare people, instead we use data to look for evidence.
Since 1990, the S&P 500 has been trading above the average CAPE ratio during 307 out of 324 months – that’s a total of 95% of the time. If you exited US equities when the CAPE ratio was overvalued, you would have missed gains of more than a 1000% over that time. In fact, had you only invested when the CAPE was 25% overvalued – i.e. when stocks were “very expensive” – your total returns since 1990 would have been 650%. This is one of the many reasons why it is ill advised to use valuation as a timing mechanism.
The most we can really say about a higher than average CAPE is that when it is significantly above its long-term average, we should lower our expectations for future returns. When we look around the world, we see the United States is more expensive than Europe, or emerging markets, or Japan on nearly every single valuation metric. This should not be surprising, given how much the United States has outperformed other countries since the financial crisis ended in 2009. The good news is that our portfolio is exposed to global equities, and as the equity leadership shifts – whenever that might be – our portfolios will benefit from it.
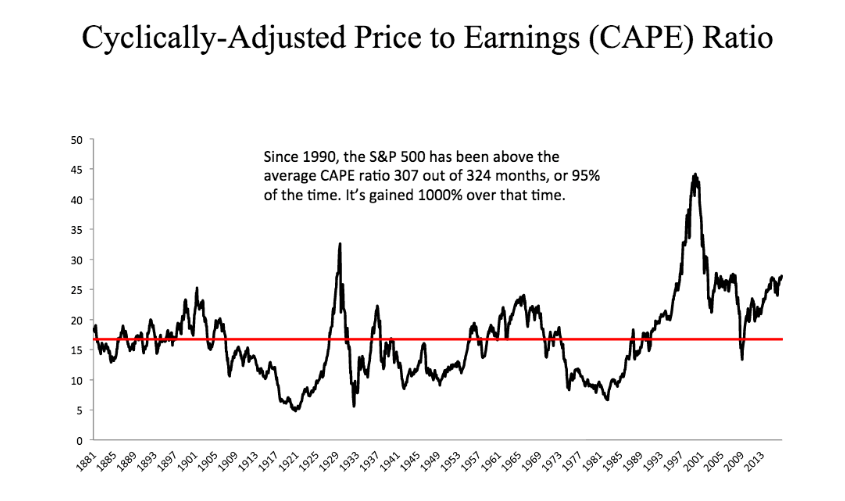
Josh here – one interesting thing to keep in mind is that, while the CAPE for US stocks is currently 25.5, the CAPE for Europe is a more reasonable 15.6 and just 14.4 for Emerging Markets stocks. Additionally, the massive profit wipeouts from 2009, which are obviously biasing the ratio higher, will be rolling off in 2020. Finally, as Professor Jeremy Siegel has pointed out, we’re comparing apples to oranges to some extent, given the fact that the accounting treatment of earnings and losses has changed from one era to the next, which changes the composition of as-reported numbers.
Rather than dismissing valuation concerns out of hand, we prefer to think about them in the context of an overall asset allocation plan. For as long as you will be an investor, there will always be valuation concerns for one asset class or another.
If you’re interested in learning more about how we work with clients on their financial plans and investment portfolios, talk to us here:
Daily Top Ten – December 16, 2016
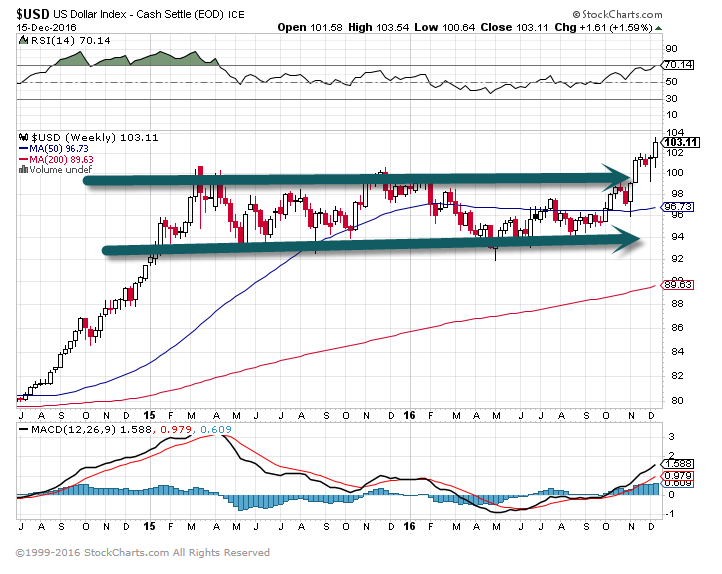
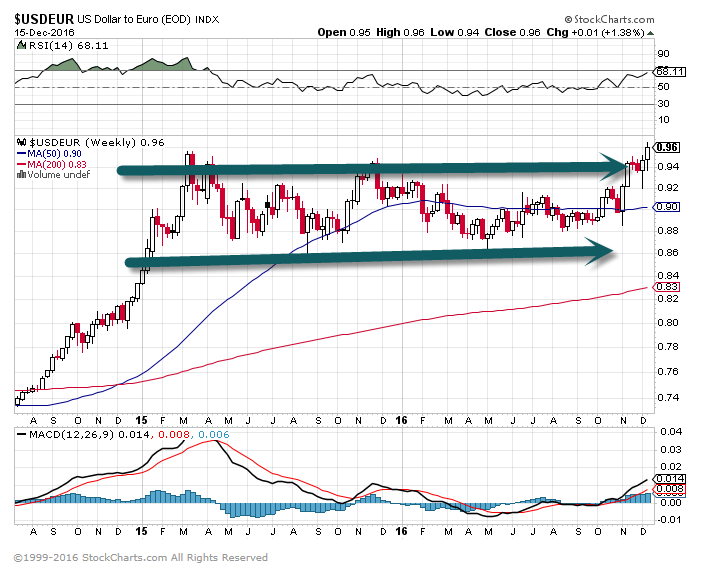
1.U.S. Dollar Breaks Out of 2 Year Band…..Surges to 14 Year High Versus the Euro.
U.S. Dollar Chart—See 2 year band.
This chart shows U.S. dollar versus Euro…Same breakout…14 year high versus Euro.
Daily Top Ten – December 14, 2016
1.U.S. Dollar Impact Upon Asset Class Returns.
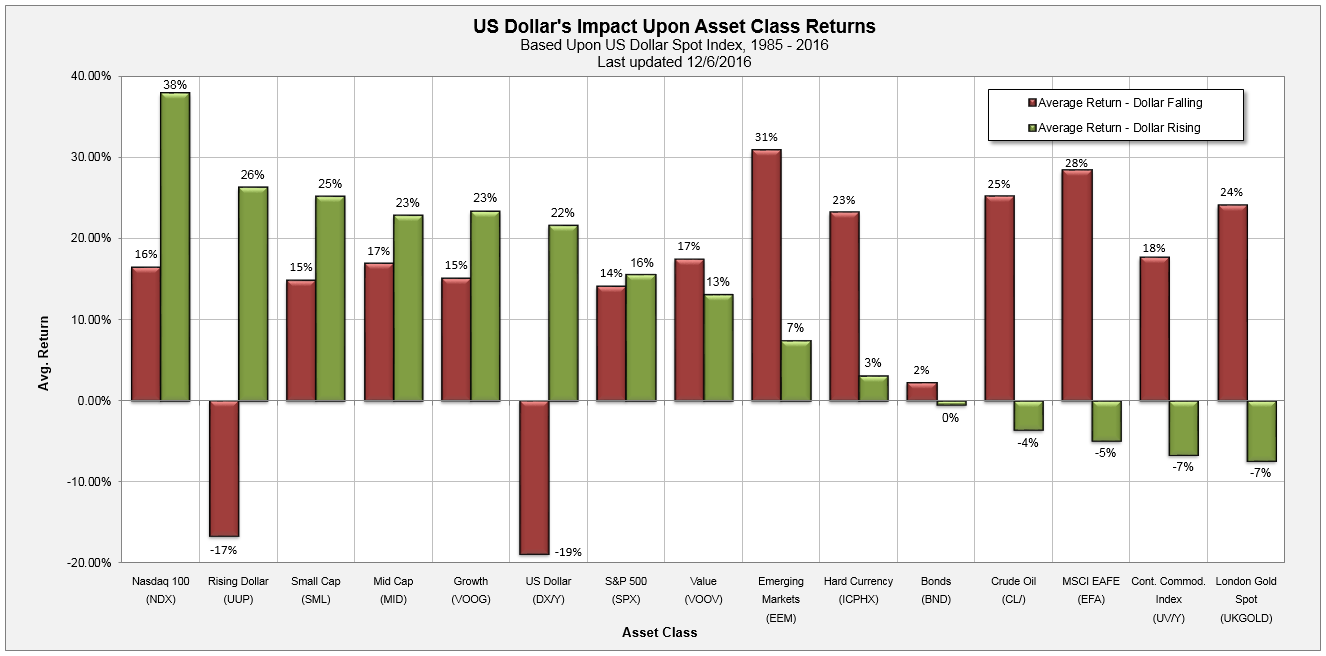
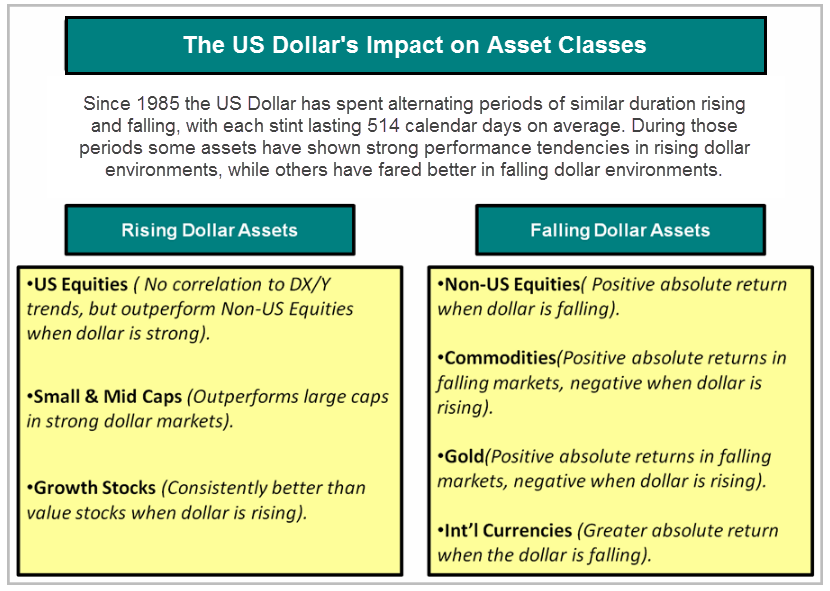
From Dorsey Wright
Daily Top Ten – December 13, 2016
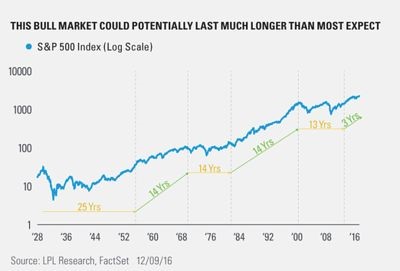
1.S&P Just Broke Out of 13 Year Consolidation Period in 2013-We have shown this before in a different chart form but same story.
While the S&P 500 SPX, -0.11% has been in a bull market since the bottom of the financial crisis in 2009, it only broke out of a 13-year consolidation period in 2013, according to Ryan Detrick, senior market strategist at LPL Financial. In the past, when such lengthy periods of essentially flat returns came to a close, the result was an equally long advance. (While markets were extremely volatile between 2000 and 2013, an era marked by both the dot-com bubble and the financial crisis, it failed to make decisive new highs for an extended period in that timeframe.)
Daily Top Ten – December 12, 2016
Daily Top Ten – December 8, 2016
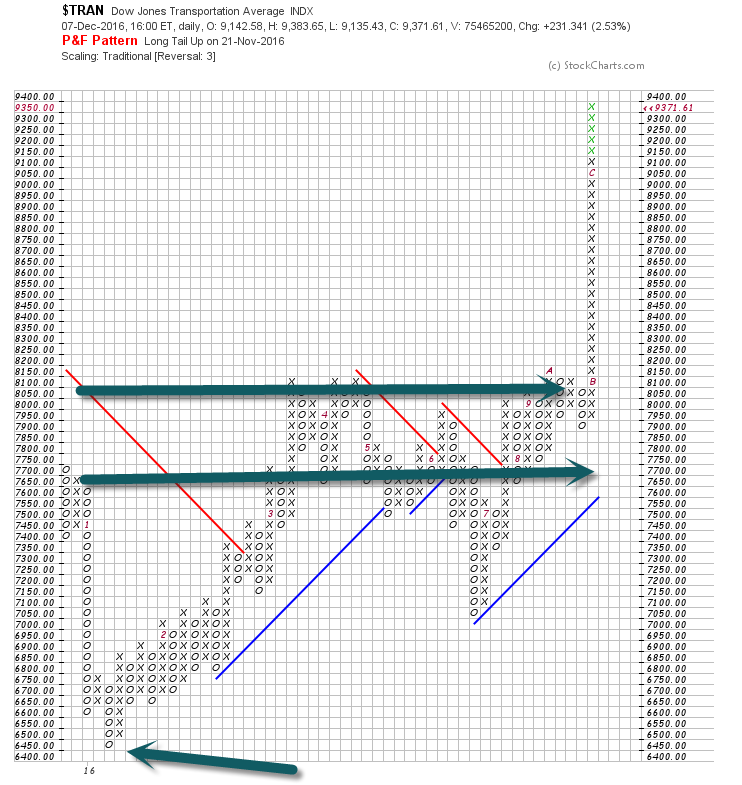
1.Dow Transports Massive Post Election Bump….15% Rally….45% Rally Off 2016 January Bottom.
Hard to Believe, but Transports are 45% Above Jan. Low….See bottom arrow.
Daily Top Ten – December 7, 2016
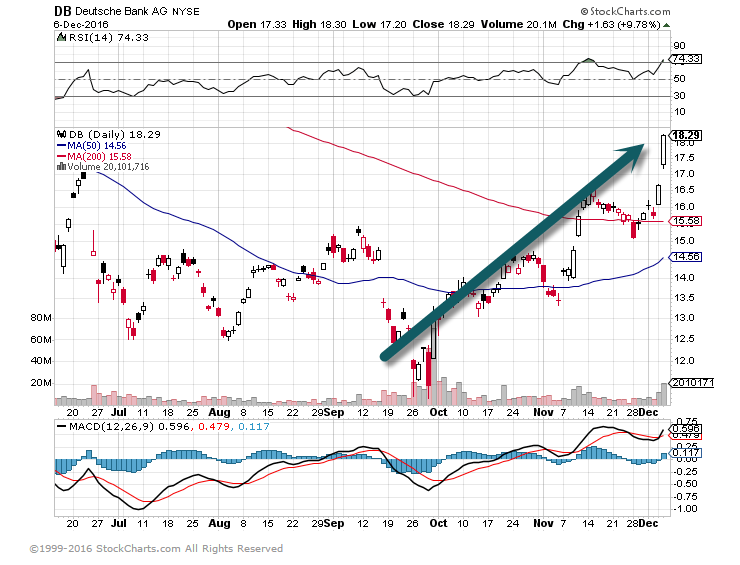
1.Big European Banks not Worried About Italian Referendum??
Italy is preparing to take a €2B controlling stake in Monte dei Paschi di Siena (OTCPK:BMDPY), which the bank hopes will attract private investors to fill the gap in rescue funding. According to Reuters, the government plans to buy junior bonds to boost its stake to 40%, making it the biggest shareholder by far. Questions whether this amounts to state aid will surely arise in Brussels.
www.seekingalpha.com
DB 60% off October Lows.
Daily Top Ten – December 5, 2016
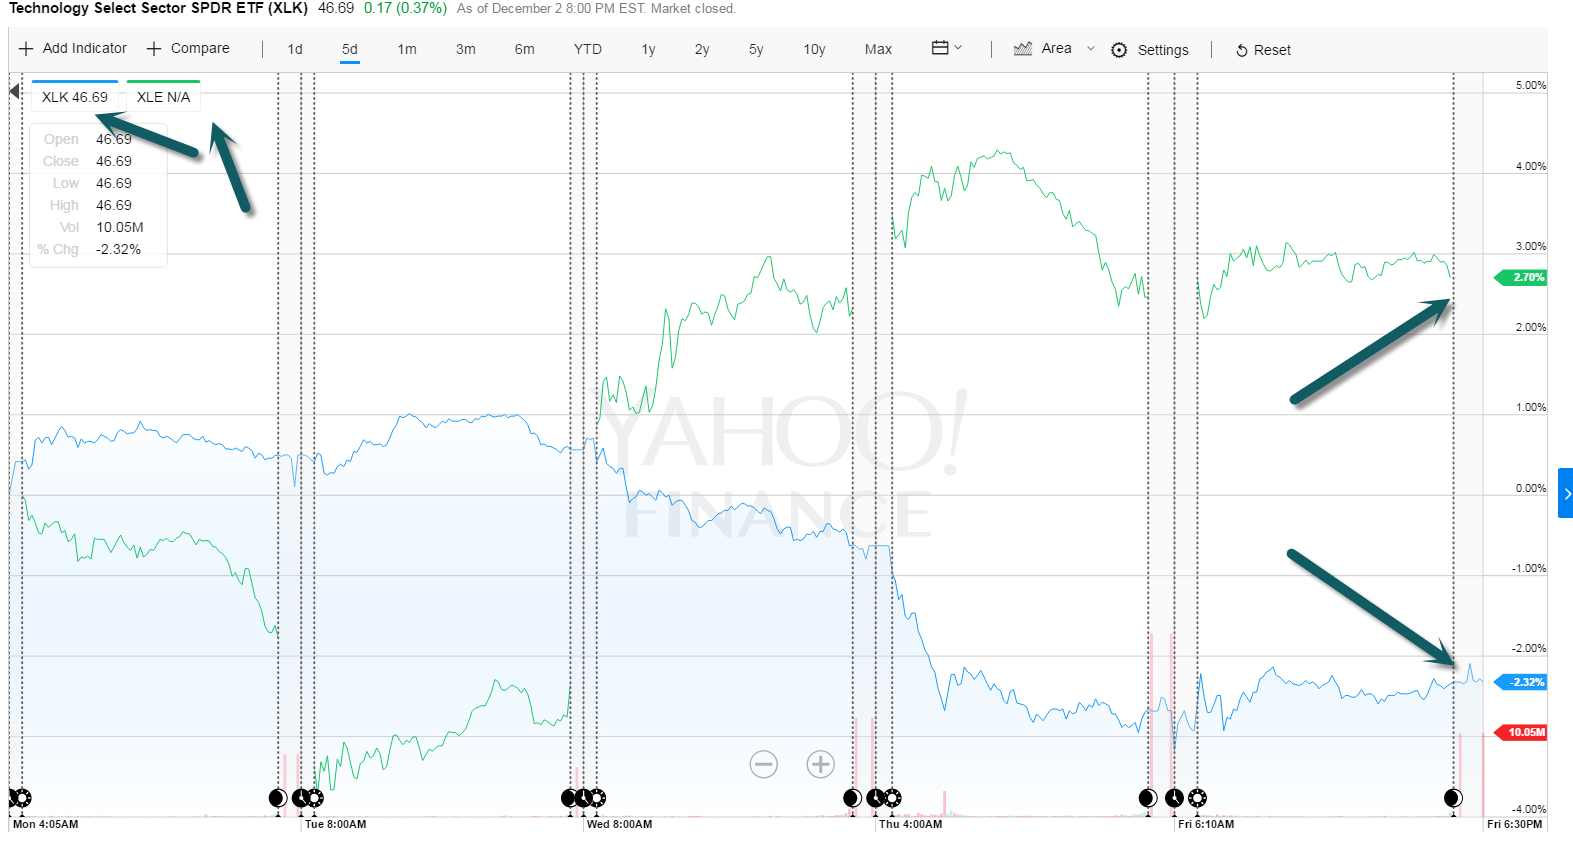
1.Big Rotation Last Week….Tech -2.32% vs. Energy +2.70%
XLK Tech ETF vs. XLE Energy ETF
Daily Top Ten – December 2, 2016
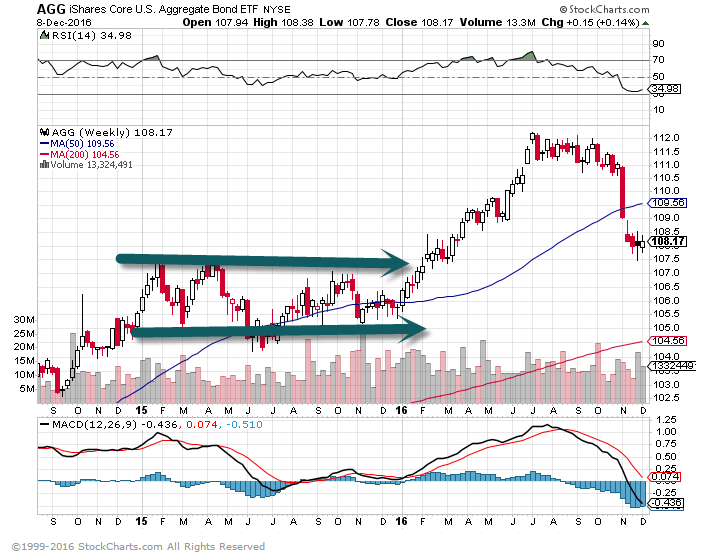
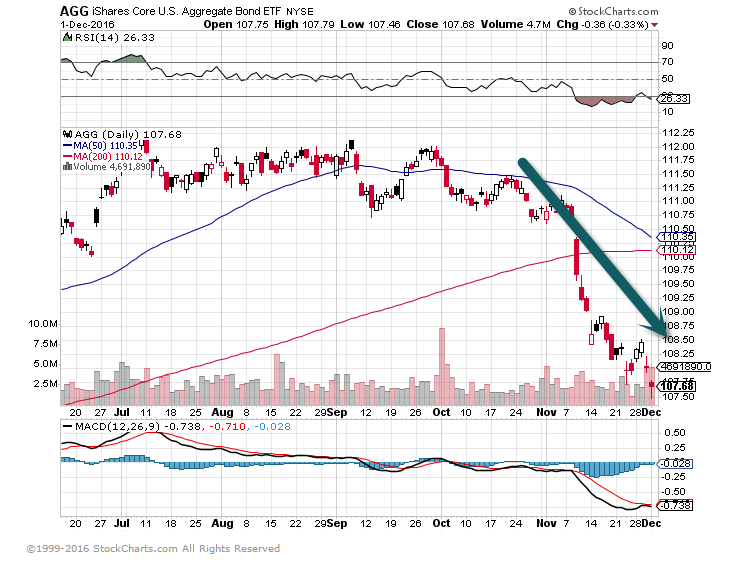
1.AGG U.S. Aggregate Bond Market Lost 2.37% in November….It’s Worst Monthly Performance in 12 Years.
AGG Chart November Rollover.
Daily Top 10-December 1, 2016
1.Happy Holidays from the U.S. Consumer…The Surest way to go Broke is Betting Against the American Consumer.
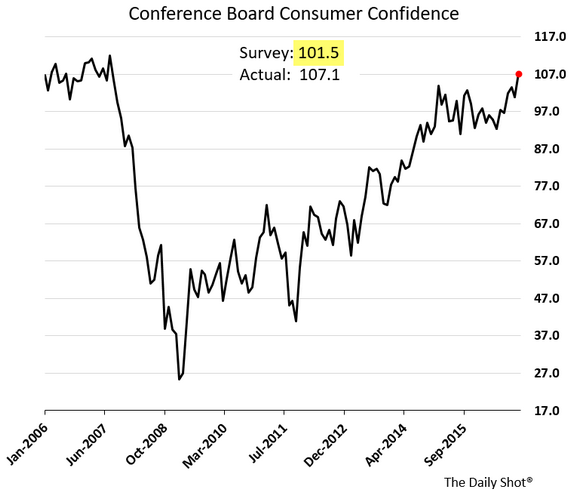
From our United States section: Consumer confidence is at its highest level since 2007. However, much of the data was collected before the election results.
2.Small Cap Rip….Historical Data.
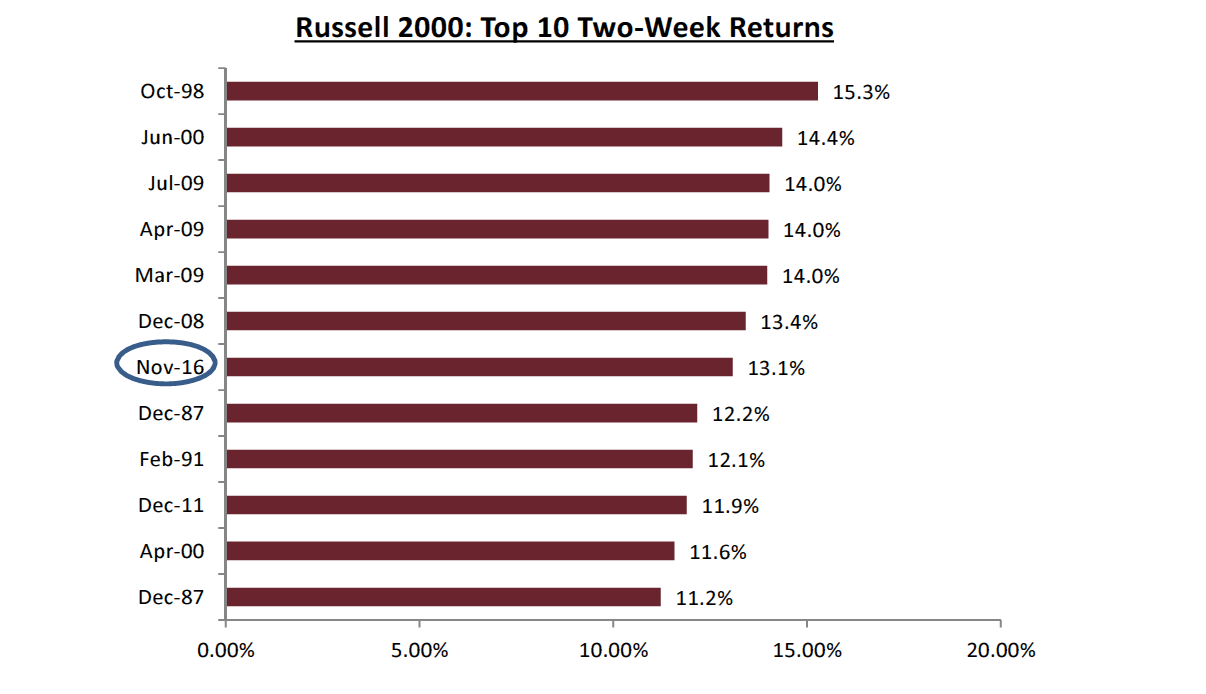

Reach out to Eric Boucher for more information on Renmac
EBoucher@renmac.com www.renmac.com
3.Ben Carlson on the Agony of Investing in Small Caps….No Pain No Gain.
The people that use all-time highs to scare you are the same people who told you that the 27% selloff in the Russell 2000 earlier this year was the canary in the coalmine. Small-cap stocks are now at all-time highs and 40% off their February lows.
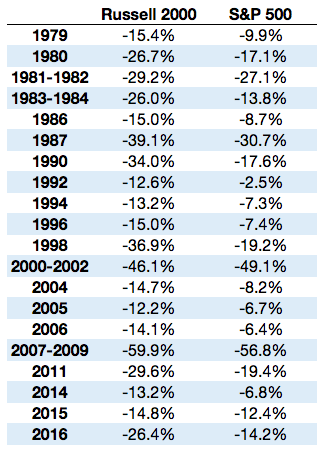
You can see that the Russell 2000 has shown a history of more frequent and deeper losses than the S&P 500. Here are the numbers behind this chart which shows the various Russell 2000 corrections and bear markets since 1979 along with the corresponding S&P 500 losses during those times:
There have been plenty of large losses in small caps that didn’t really seem to affect what was going on with large caps. Going again by the trivial definition I used from above on bear markets (20% loss or worse) the Russell 2000 has experienced ten in this time while the S&P 500 has only seen four (with two or three close calls).
Some takeaways:
Volatility in small caps is a double-edged sword. It can be painful to stick with them, but they also provide more frequent and better entry points for investing. If you’re dollar cost averaging into your retirement savings, small caps are great asset class because you have had more chances to buy in at lower prices. This is a good thing, but it requires discipline and the ability to buy when others are selling.
- Investment nerds like myself love to debate concepts such as the small cap premium, which is said to show that small cap stocks have outperformed large cap stocks historically. My stance is that it really doesn’t matter if they outperform going forward or not, as long as you have the correct portfolio perspective. These two market indexes have seen basically identical performance since 1979 (both with 11%+ annual returns). While the Russell 2000 can leave much to be desired as a small cap stock index, it’s instructive to understand that small caps can add value to a portfolio even if you don’t receive a premium over large caps in the future. This can be achieved simply through diversification benefits and rebalancing, whether small caps prove to outperform or not.
- Some investors may not be able to handle the extra volatility seen in small caps, and that’s okay too. Building a portfolio has as much to do with understanding yourself as it does with understanding your investments. But you still have to understand how your investments tend to perform over time to ensure that you don’t panic when the inevitable losses occur. For investors in small cap stocks, that means understanding that frequent, large losses are a feature, not a bug.
Read Full Story http://awealthofcommonsense.com/2016/11/the-agony-of-investing-in-small-cap-stocks/
4.Guggenheim Pure Value Fund is Up 675% Since 2009 Bottom….Amazing Considering Value has Underperformed Growth During that Time Frame.
RPV Chart -Guggenheim Pure Value ETF
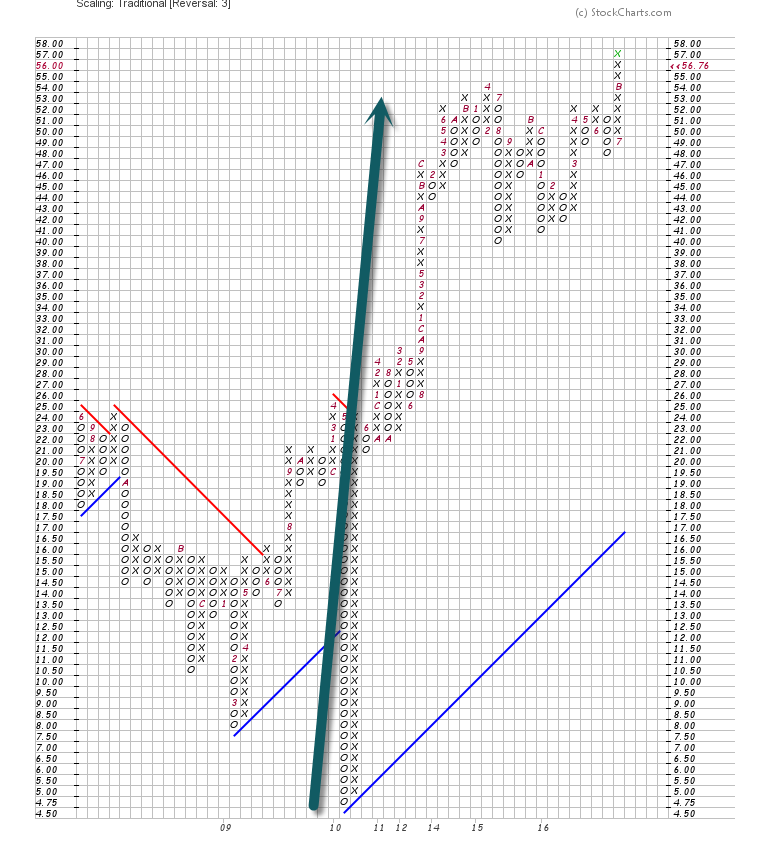 The relatively small fund—it only has $232.7 million in assets, according to FactSet, and it trades under 40,000 shares a day, on average—focuses on small and microcap stocks, while its value tilt gives it a lower price-to-book ratio than other ETFs tracking small-cap indexes. Another Guggenheim value fund, the Guggenheim S&P 500 Pure Value ETF RPV, -0.37% is the second-best performer, boasting a 634.88% since the 2009 bottom.
The gain of the S&P 500 ETF places it as the 180th best performer of the 563, putting it in the top third of funds. That a heavy majority underperformed the benchmark speaks to one of the biggest investing trends of the past seven years: the growing adoption of passive investing. Research has shown that very few active or “smart beta” funds can beat the broader market over the long term.
Don’t miss: New rule may create a $10 trillion ETF juggernaut by 2020
Among other widely-followed funds, the iShares Core U.S. Aggregate Bond ETFAGG, +0.11% is up 35.31% since the stock market bottom (454th best), the iShares iBoxx $ Investment Grade Corporate Bond ETF LQD, +0.14% has gained 74.4% (405th best), and the iShares iBoxx $ High Yield Corporate Bond ETF HYG, -0.13% is up 128.19% (334th best). The SPDR Gold Trust GLD, -0.62% is up 24.68% over the period (471st best) while the Vanguard FTSE Emerging Markets ETF VWO, +0.06% has gained 116.78% (354th best).
In a sign of how broadly the economy has recovered, 510 funds—or 90.5%—are at least somewhat positive since the market bottom, not including fees. The smallest gainer of the applicable universe, the SPDR Bloomberg Barclays Short Term International Treasury Bond ETF BWZ, +0.47% is up a mere 0.3% over the period. The narrowest loser, the SPDR Bloomberg Barclays 1-3 Month T-Bill ETF BIL, +0.00%is down 0.2%, for an annualized loss of 0.04%.
In addition to the Guggenheim funds, specific sectors also numbered among the top 10 ETFs. Two internet funds charted, underlining the explosion in technology usage and businesses over the past seven years. Since the market bottom, major companies like Facebook Inc. FB, +0.38% and Twitter Inc. TWTR, -0.60% have gone public, while names like Netflix Inc. NFLX, +0.50% have become major businesses.
Here are the 10 best-performing funds since the market bottom:
| Rank | Security | Return |
| 1. | Guggenheim S&P Smallcap 600 Pure Value ETF RPV, -0.37% | 675.97% |
| 2. | Guggenheim S&P 500 Pure Value ETF RPV, -0.37% | 634.88% |
| 3. | PowerShares Nasdaq Internet Portfolio PNQI, +0.25% | 566.7% |
| 4. | Guggenheim S&P Midcap 400 Pure Value ETF RFV, -0.86% | 560.06% |
| 5. | SPDR S&P Insurance ETF KIE, +0.07% | 536.29% |
| 6. | First Trust Dow Jones Internet Index Fund FDN, +0.01% | 535.66% |
| 7. | Guggenheim S&P 500 Equal Weight Consumer Discretionary ETFRCD, -0.22% | 532.36% |
| 8. | Guggenheim S&P 500 Equal Weight Financials ETF RYF, +0.24% | 505.45% |
| 9. | First Trust NYSE Arca Biotechnology Index Fund FBT, +0.08% | 504.56% |
| 10. | Oppenheimer Small-Cap Revenue ETF RWJ, +0.03% | 504.22%
|
Read Full Story
http://www.marketwatch.com/story/this-etf-has-jumped-sevenfold-since-the-start-of-the-bull-market-2016-11-29
5.OPEC Agrees to First Production Cut in 8 Years.
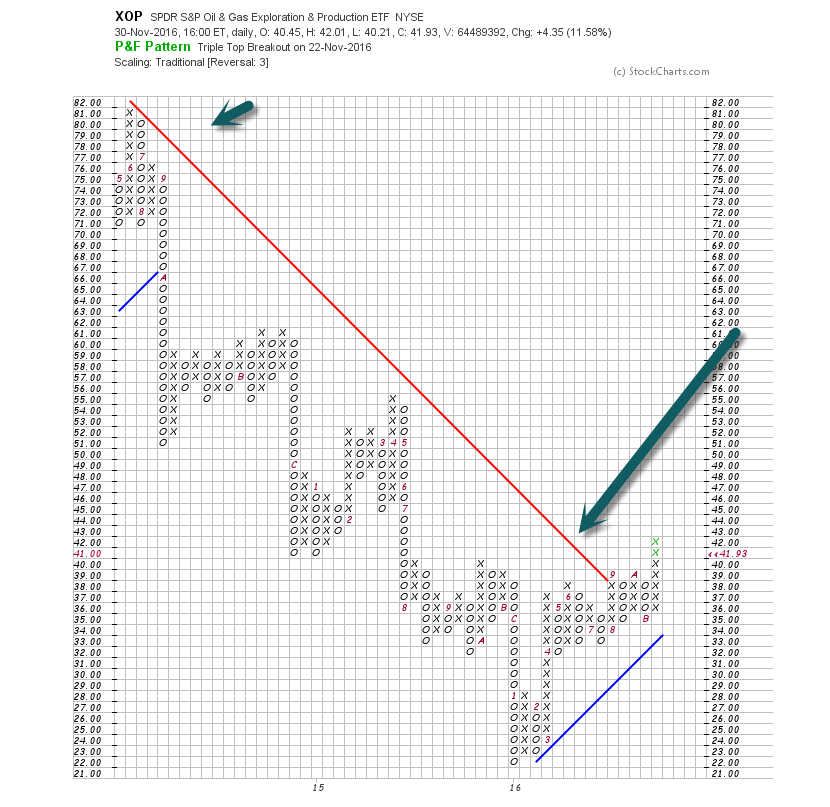
XOP-Exploration Companies…Double Off Bottom Above Red Downtrend Line Going Back 3 Years.
The oil club is dizzy with its own success after a harmonious meeting in Vienna, where it surprised the world by agreeing to its first production cut in eight years. Crude prices up 12%? Check. Saudi Arabia and Iran in agreement? Check. OPEC and Russia working together? Check. The big question now is whether all these cuts will be implemented. Meanwhile, crude is up over $50 a barrel, lifting energy shares in its slipstream.
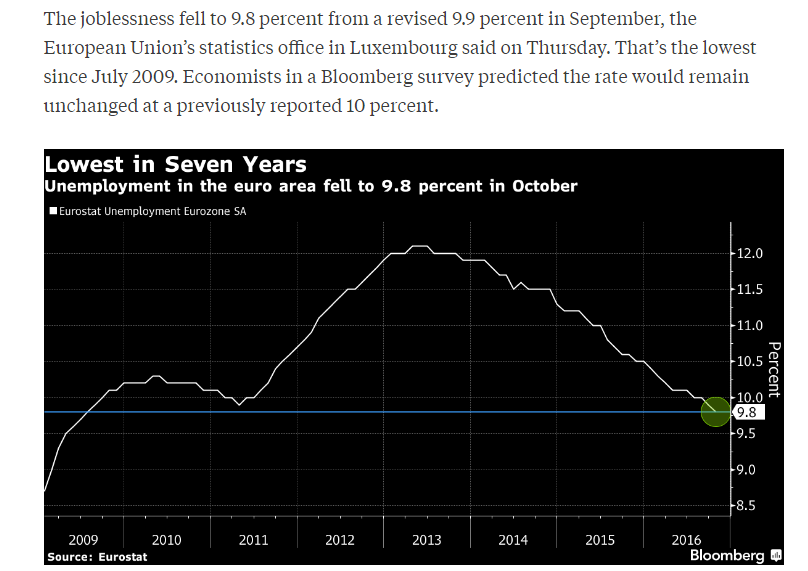
6.European Union Jobless Rate Fell to Lowest Level Since July 2009.
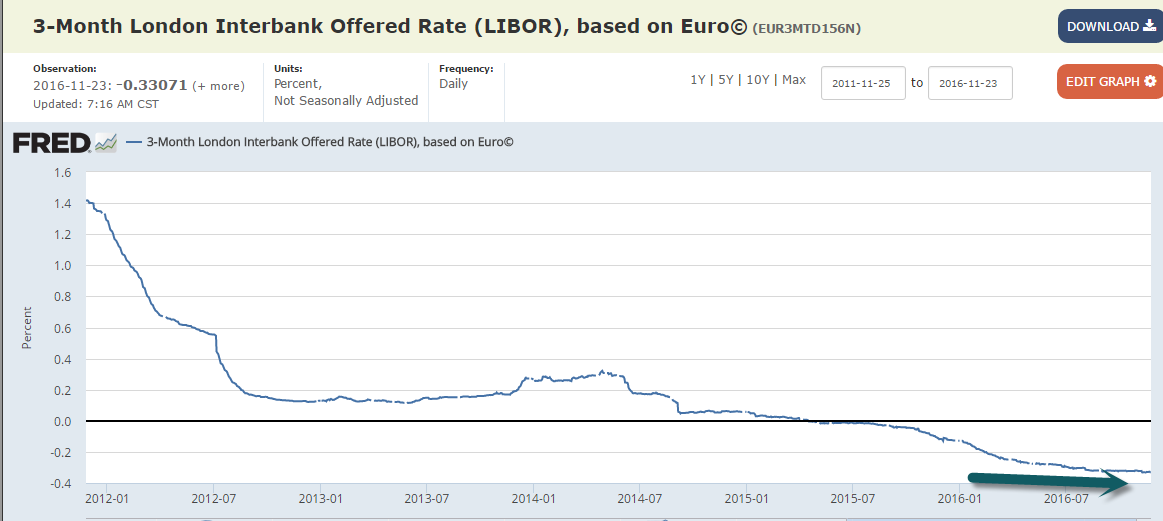
7.Long-Term Chart on Libor ….$28 Trillion Based on Libor.
LIBOR or ICE LIBOR (previously BBA LIBOR) is a benchmark rate that some of the world’s leading banks charge each other for short-term loans. It stands for IntercontinentalExchange London Interbank Offered Rate and serves as the first step to calculating interest rates on various loans throughout the world.
LIBOR Definition | Investopedia
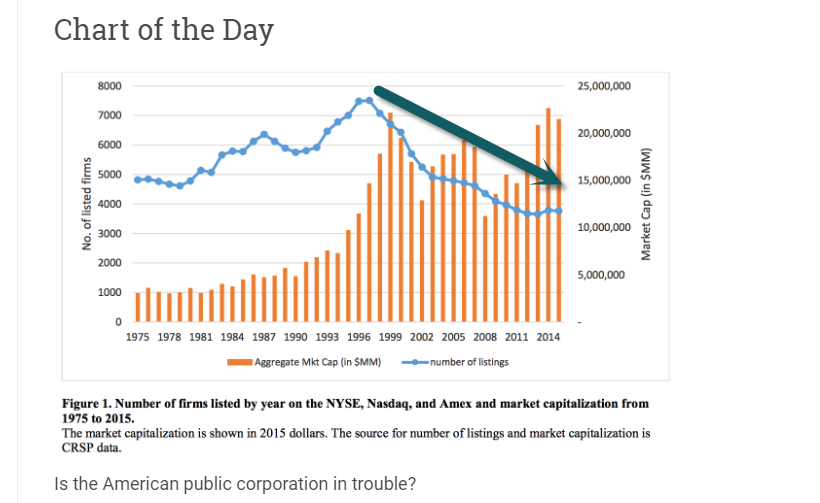
8.We have Discussed the Incredibly Shrinking Amount of Public Companies at Length ….Read Full Academic Paper Below….
Read Full Academic Paper
https://papers.ssrn.com/sol3/papers.cfm?abstract_id=2869301
From Abnormal Returns Blog
http://abnormalreturns.com/2016/11/30/wednesday-links-emotional-strengths/
9.Populism is not Going Away….It’s a Global Phenomenon.
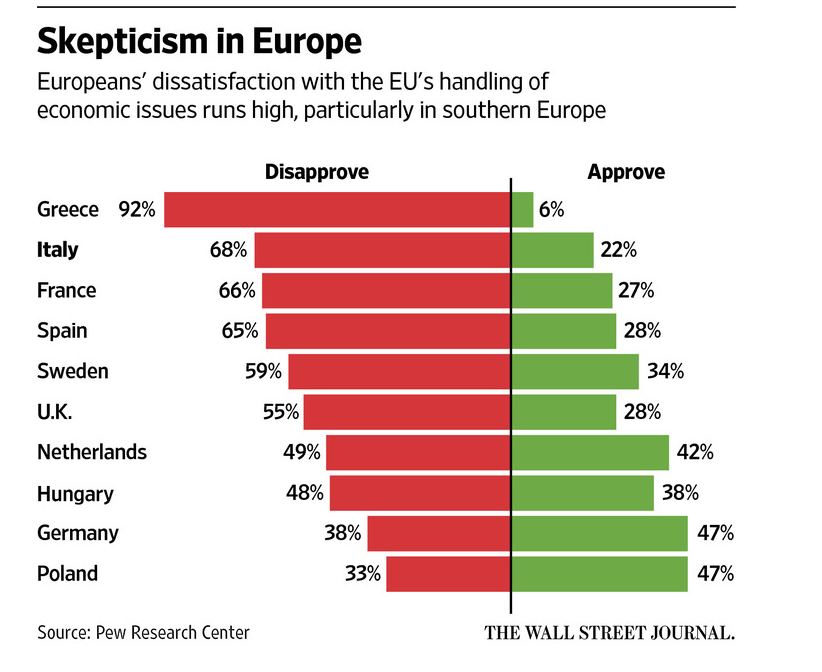
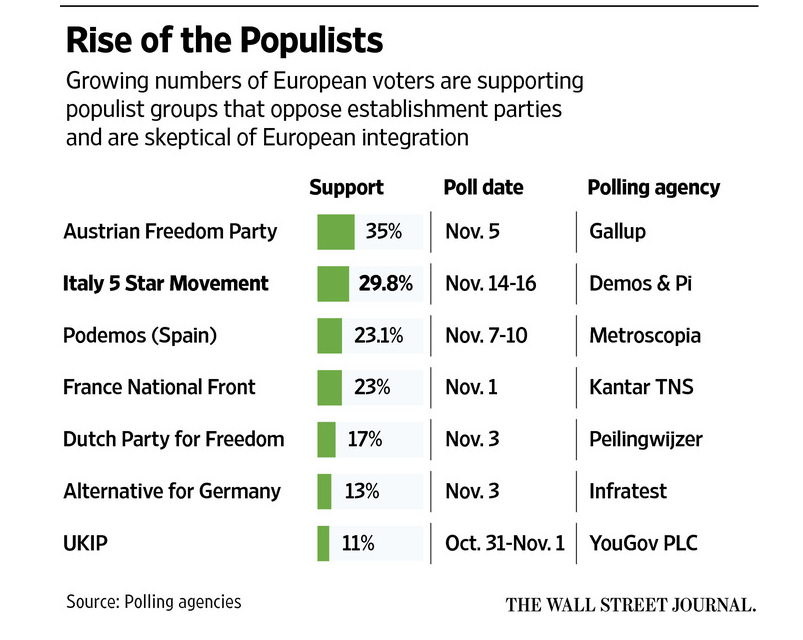
Read full story on Italians losing jobs in furniture manufacturing and car production.
http://www.wsj.com/articles/italy-the-next-stop-on-populisms-global-march-1480436049
10.Top 10 Qualities of Great Leader.
Having a great idea, and assembling a team to bring that concept to life is the first step in creating a successful business venture. While finding a new and unique idea is rare enough; the ability to successfully execute this idea is what separates the dreamers from the entrepreneurs. However you see yourself, whatever your age may be, as soon as you make that exciting first hire, you have taken the first steps in becoming a powerful leader. When money is tight and startup fundraisingis required, stress levels are high, and the visions of instant success don’t happen like you thought, it’s easy to let those emotions get to you, and thereby your team. Take a breath, calm yourself down, and remind yourself of the leader you are and would like to become. Here are some key qualities that every good leader should possess, and learn to emphasize.
Honesty
Whatever ethical plane you hold yourself to, when you are responsible for a team of people, its important to raise the bar even higher. Your business and its employees are a reflection of yourself, and if you make honest and ethical behavior a key value, your team will follow suit.
As we do at CoFoundersLab, one of the largest networks for entrepreneurs online, we try to make a list of values and core beliefs that both you and your brand represent, and post this in your office. Promote a healthy interoffice lifestyle, and encourage your team to live up to these standards. By emphasizing these standards, and displaying them yourself, you will hopefully influence the office environment into a friendly and helpful workspace.
Finessing your brand vision is essential to creating an organized and efficient business, but if you don’t learn to trust your team with that vision, you might never progress to the next stage. Its important to remember that trusting your team with your idea is a sign of strength, not weakness. Delegating tasks to the appropriate departments is one of the most important skills you can develop as your business grows. The emails and tasks will begin to pile up, and the more you stretch yourself thin, the lower the quality of your work will become, and the less you will produce.
The key to delegation is identifying the strengths of your team, and capitalizing on them. Find out what each team member enjoys doing most. Chances are if they find that task more enjoyable, they will likely put more thought and effort behind it. This will not only prove to your team that you trust and believe in them, but will also free up your time to focus on the higher level tasks, that should not be delegated. It’s a fine balance, but one that will have a huge impact on the productivity of your business.
Communication
Knowing what you want accomplished may seem clear in your head, but if you try to explain it to someone else and are met with a blank expression, you know there is a problem. If this has been your experience, then you may want to focus on honing your communication skills. Being able to clearly and succinctly describe what you want done is extremely important. If you can’t relate your vision to your team, you won’t all be working towards the same goal.
Training new members and creating a productive work environment all depend on healthy lines of communication. Whether that stems from an open door policy to your office, or making it a point to talk to your staff on a daily basis, making yourself available to discuss interoffice issues is vital. Your team will learn to trust and depend on you, and will be less hesitant to work harder.
If your website crashes, you lose that major client, or your funding dries up, guiding your team through the process without panicking is as challenging as it is important. Morale is linked to productivity, and it’s your job as the team leader to instill a positive energy. That’s where your sense of humor will finally pay off. Encourage your team to laugh at the mistakes instead of crying. If you are constantly learning to find the humor in the struggles, your work environment will become a happy and healthy space, where your employees look forward to working in, rather than dreading it. Make it a point to crack jokes with your team and encourage personal discussions of weekend plans and trips. It’s these short breaks from the task at hand that help keep productivity levels high and morale even higher.
At Onevest, we place a huge emphasis on humor and a light atmosphere. Our office is dog friendly, and we really believe it is the small, light hearted moments in the day that help keep our work creative and fresh. One tradition that we like to do and brings the team closer is we plan a fun prank on all new employees, on their first day. It breaks the ice and immediately creates that sense of familiarity.
Confidence
There may be days where the future of your brand is worrisome and things aren’t going according to plan. This is true with any business, large or small, and the most important thing is not to panic. Part of your job as a leader is to put out fires and maintain the team morale. Keep up your confidence level, and assure everyone that setbacks are natural and the important thing is to focus on the larger goal. As the leader, by staying calm and confident, you will help keep the team feeling the same. Remember, your team will take cues from you, so if you exude a level of calm damage control, your team will pick up on that feeling. The key objective is to keep everyone working and moving ahead.
Commitment
If you expect your team to work hard and produce quality content, you’re going to need to lead by example. There is no greater motivation than seeing the boss down in the trenches working alongside everyone else, showing that hard work is being done on every level. By proving your commitment to the brand and your role, you will not only earn the respect of your team, but will also instill that same hardworking energy among your staff. It’s important to show your commitment not only to the work at hand, but also to your promises. If you pledged to host a holiday party, or uphold summer Fridays, keep your word. You want to create a reputation for not just working hard, but also be known as a fair leader. Once you have gained the respect of your team, they are more likely to deliver the peak amount of quality work possible.
You want to keep your team motivated towards the continued success of the company, and keep the energy levels up. Whether that means providing snacks, coffee, relationship advice, or even just an occasional beer in the office, remember that everyone on your team is a person. Keep the office mood a fine balance between productivity and playfulness.
If your team is feeling happy and upbeat, chances are they won’t mind staying that extra hour to finish a report, or devoting their best work to the brand.
Creativity
Some decisions will not always be so clear-cut. You may be forced at times to deviate from your set course and make an on the fly decision. This is where your creativity will prove to be vital. It is during these critical situations that your team will look to you for guidance and you may be forced to make a quick decision. As a leader, its important to learn to think outside the box and to choose which of two bad choices is the best option. Don’t immediately choose the first or easiest possibility; sometimes its best to give these issues some thought, and even turn to your team for guidance. By utilizing all possible options before making a rash decision, you can typically reach the end conclusion you were aiming for.
Intuition
When leading a team through uncharted waters, there is no roadmap on what to do. Everything is uncertain, and the higher the risk, the higher the pressure. That is where your natural intuition has to kick in. Guiding your team through the process of your day-to-day tasks can be honed down to a science. But when something unexpected occurs, or you are thrown into a new scenario, your team will look to you for guidance. Drawing on past experience is a good reflex, as is reaching out to your mentors for support. Eventually though, the tough decisions will be up to you to decide and you will need to depend on your gut instinct for answers. Learning to trust yourself is as important as your team learning to trust you.
Inspire
Creating a business often involves a bit of forecasting. Especially in the beginning stages of a startup, inspiring your team to see the vision of the successes to come is vital. Make your team feel invested in the accomplishments of the company. Whether everyone owns a piece of equity, or you operate on a bonus system, generating enthusiasm for the hard work you are all putting in is so important. Being able to inspire your team is great for focusing on the future goals, but it is also important for the current issues. When you are all mired deep in work, morale is low, and energy levels are fading, recognize that everyone needs a break now and then. Acknowledge the work that everyone has dedicated and commend the team on each of their efforts. It is your job to keep spirits up, and that begins with an appreciation for the hard work.
Approach
Not all human beings are the same. A basic concept, but something that is often overlooked. You have cultural perspectives, language barriers, different educational backgrounds, personality traits and varying value systems with which individuals come pre-conditioned that greatly affects how information is processed and interpreted. Some people work well under pressure, others don’t. Some respond best to tough love, others take it personally and shut down. In order to optimize your effectiveness as a leader, you must have the ability to customize your approach on a person by person basis, based on the situation at hand. Your capacity to execute this concept will play a huge role in your ability to get the best work out of your team and other partners along he journey.
Daily Top Ten – November 29, 2016
1.Small Cap Stocks on Longest Winning Streak in 20 Years.
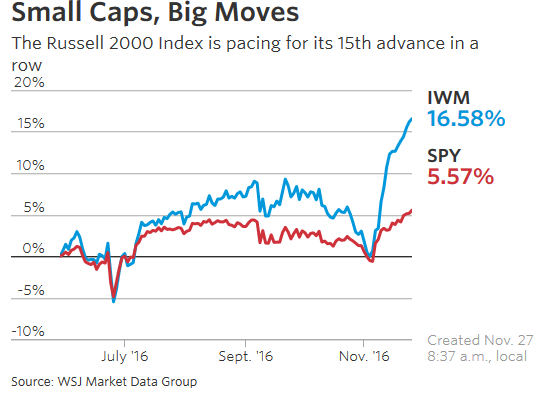
Small company shares on Friday notch their longest winning streak in 20 years on a shortened Black Friday trading session. The Russell 2000 Index rose 0.4% in in the shortened session to book its 15th advance in row. This streak ties a run last seen in February 1996. The longest ever streak, 21, was hit back in 1988. Investors are betting that President-elect Donald Trump will relax regulations, lower taxes and pump money into infrastructure projects. Such policies should benefit small caps more than there larger brethren.
So far, the Russell 2000 has climbed 12.7% since Election Day, compared with an advance of 3.5% for the S&P 500. History suggests that long streaks of gains tend to keep going. On the heels of the 1996 streak of gains, the Russell 2000 was 2.2% higher after the first month and 8.4% higher over the next three
 Thanks to Dave Lutz at Jones for Chart
Daily Top Ten – November 28, 2016
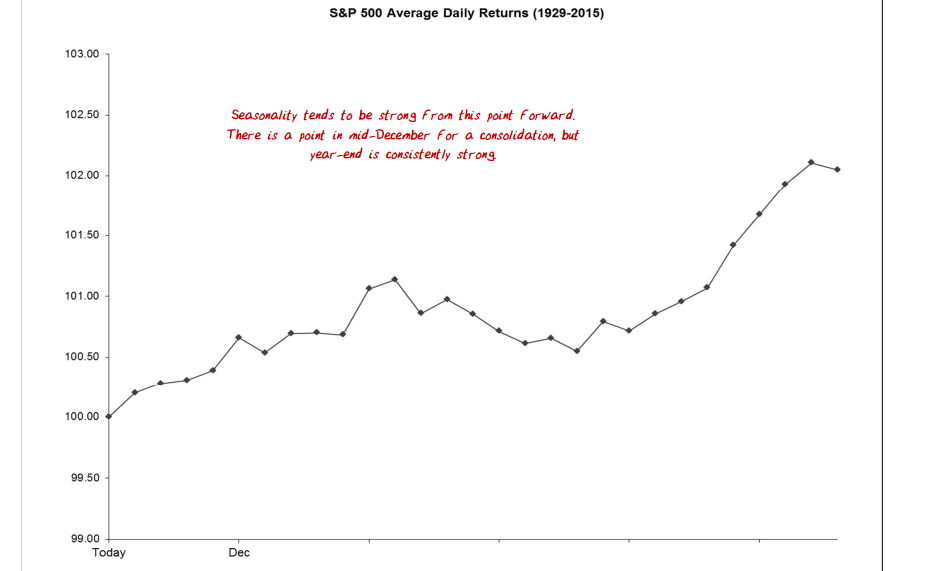
1. Entering Strong Seasonal Month with Under Allocation to Equities by Most Investors.
Daily Top Ten – November 23, 2016
Happy Thanksgiving!
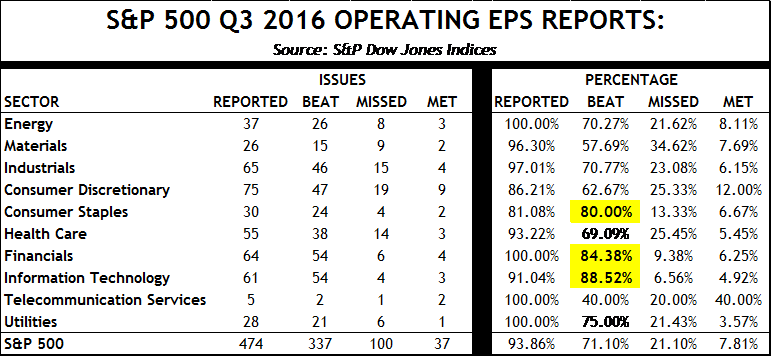
1.Earnings Wrap Up….71% of S&P Beats Earnings.
S&P EPS UP 14% Y/Y IN Q3
FINANCIALS, TECH AND STAPLES EXCEEDING STREET ESTIMATES:As of last Friday, 474 of the S&P 500 Index companies have reported Q3 earnings, of which 337 have beaten earnings (71.10%) and 100 have missed (21.10%), albeit on lowered estimates. Furthermore, 70 out of 108 companies beat on sales. Thus far, 54 out of the 64 Financials that reported earnings and 54 of the 61 Tech firms that reported earnings have beaten estimates.
Rich Farr, Chief Market Strategist Jim McGovern, Market Strategist info@bluestonecm.com
Daily Top Ten – November 22, 2016
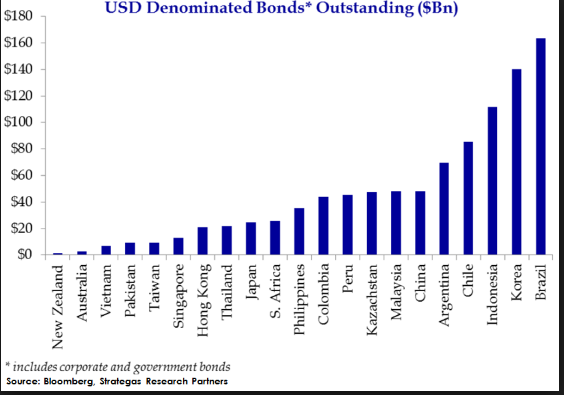
1.Risk Happens Fast with ETFs…$546 Million Pulled from EM Bonds in One Week.
Emerging Markets Biggest Outflows Since 2004

Strong dollar will make foreign debt more expensive.
Daily Top Ten – November 21, 2016
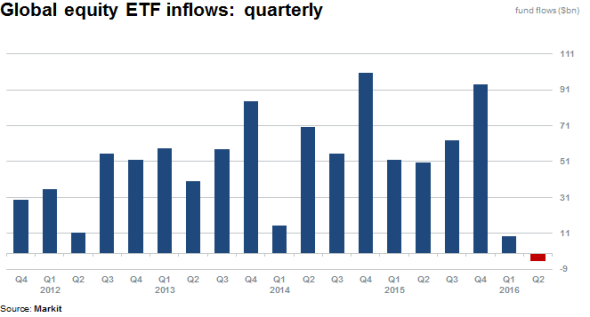
1.Seven Days Following Election $44.6 Billion Flowed into Equity ETFs…Second Biggest Surge on Record.
Investors were under allocated to equities coming into election.
Daily Top Ten – November 18, 2016
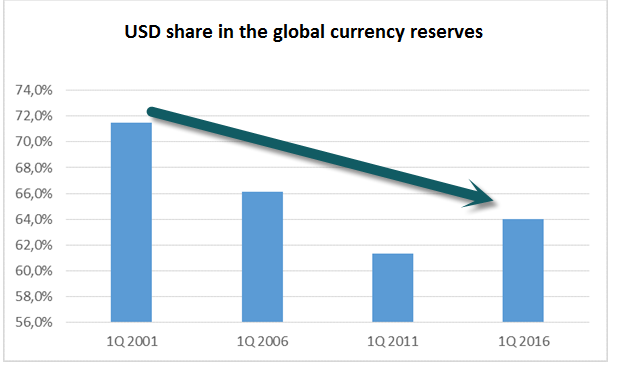
1.Rate Rise…Foreign Holdings of U.S. Treasuries Fell 0.7% in September Alone.
Foreign holdings of U.S. Treasury securities fell for a third straight month in September as China and Japan, the two biggest foreign owners of Treasury debt, both trimmed their portfolios – The Treasury Department says total foreign holdings dropped 0.7 percent to $6.15 trillion in September – China, the top foreign holder of Treasury debt, reduced its holdings 2.4 percent to $1.16 trillion in September – It marked the fourth straight month that China has cut back.
Daily Top Ten – November 17, 2016
I had the best burger ever at Nomad Bar NY last night

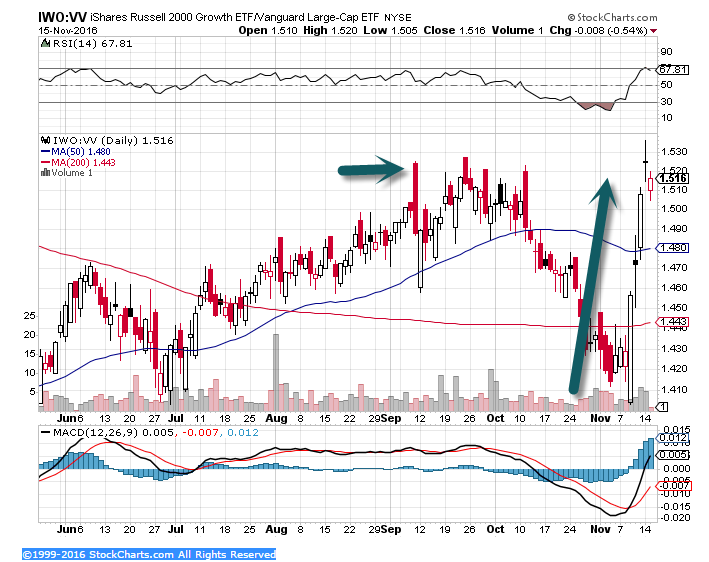
1.Trumpenomics…Small Cap vs. Large Cap Post Election.
What a chart..This is small cap (iwo) vs. large cap (vv) post election…huge spike in leadership as dividend play gets whacked.
And IWM (small cap) also keeps going, another 83 million shares traded. In the last 4 sessions this fund has traded about 350 million shares and is up 8.9% in the past 5 sessions and the fund has also hit an all-time price high. SPY is up only 1.6% over the same 5 sessions
Daily Top Ten – November 15, 2016
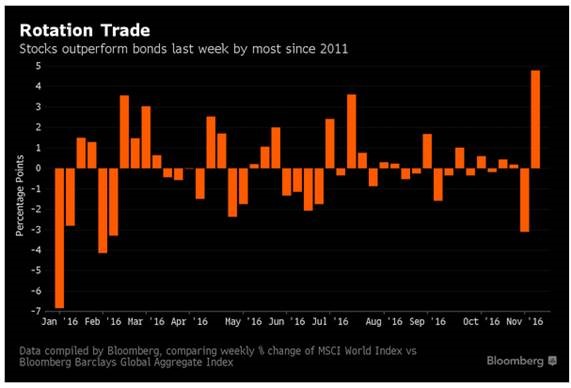
1. Stocks in the World Outperformed Bonds Last Week by the Most Since 2011, Based on the MSCI World Index of Equities in Developed Nations and the Bloomberg Barclays Global Aggregate Index, noted the Bloomies
Thanks to Dave Lutz at Jones for chart.
Daily Top Ten – November 14, 2016
Post Election….Value of Global Equities +$1.3 Trillion…Value of Global Bonds -$1 Trillion (Bloomberg).
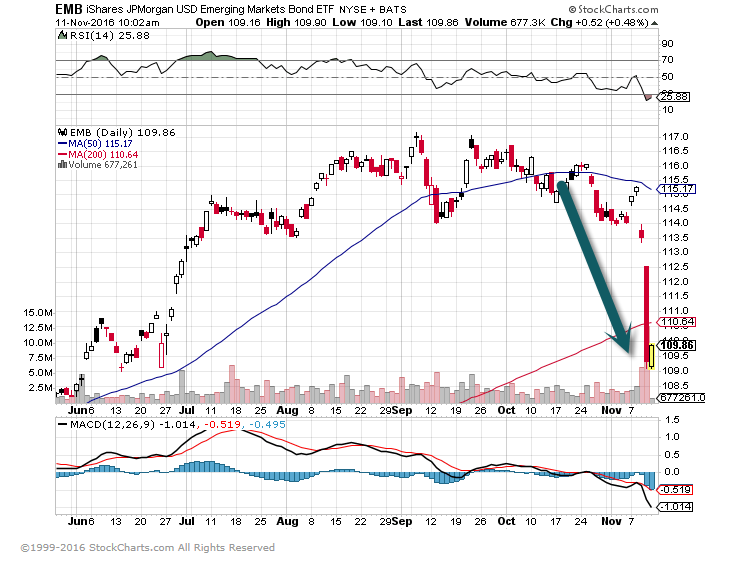
1.Trumpenomics…We Showed One Day 5% Drop in 30 Year Treasury Last Week….Emerging Markets Bond ETF 5% Drop.
Look at gap down green arrow post-election day, emerging market bonds saw massive flows this year. Who says bonds are not volatile?
Daily Top Ten – November 10, 2016
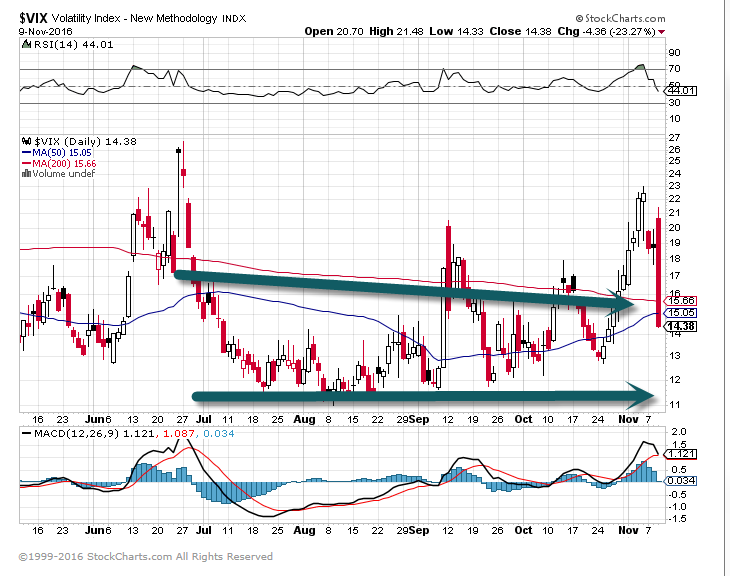
1.Who had the Trump Volatility Crash Trade On?
VIX…Collapses Back to 10-15 Low Level Channel….It’s early, but not many investors thought a Trump victory would lower volatility.
Daily Top Ten – November 9, 2016
Daily Top Ten – November 8, 2016

“Indeed it has been said that democracy is the worst form of Government except all those other forms that have been tried from time to time”
– Churchill.
VOTE
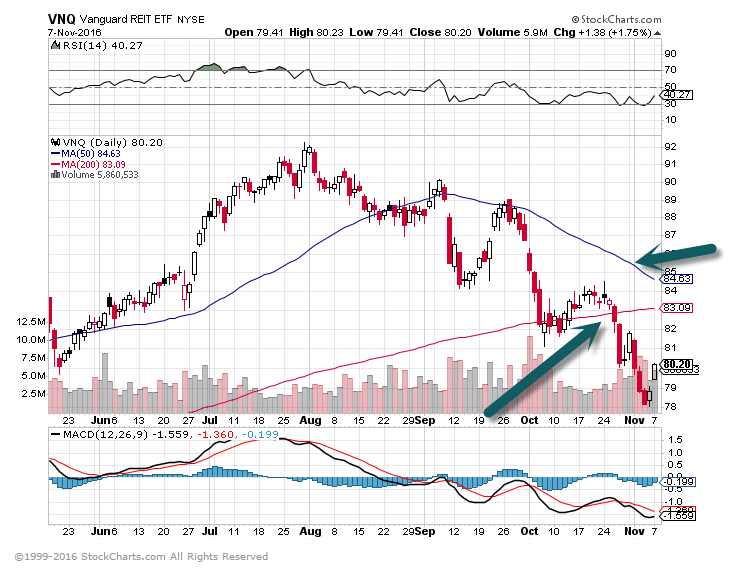
1.Real Estate Became the Official 11th GICS Sector in 2016….It is the Worst Performer so far this Year.
VNQ Vanguard REIT Index Closes Below 200day…50 day sloping downward.
Daily Top Ten – November 7, 2016
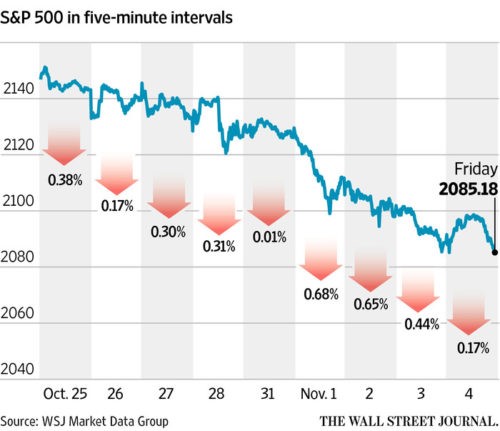
1.First 9 Day Sell Off in 36 Years…Now What?
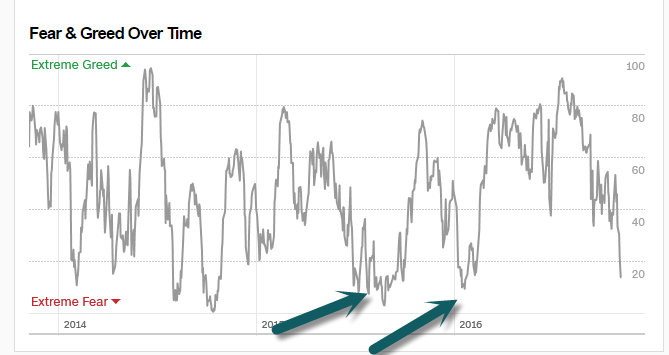
Fear and Greed Index At “Extreme Fear”..Contra Indicator?
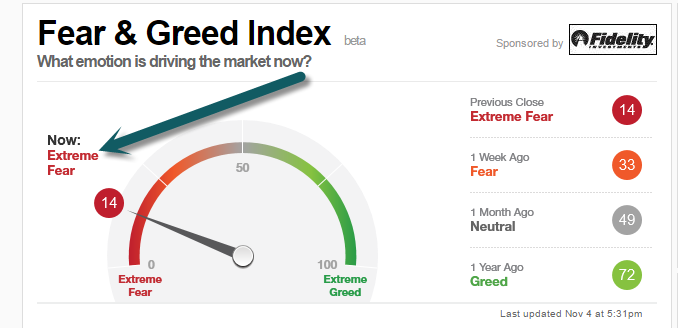 Our last Fear and Greed Lows were Market Bottoms in 2015 and 2016.
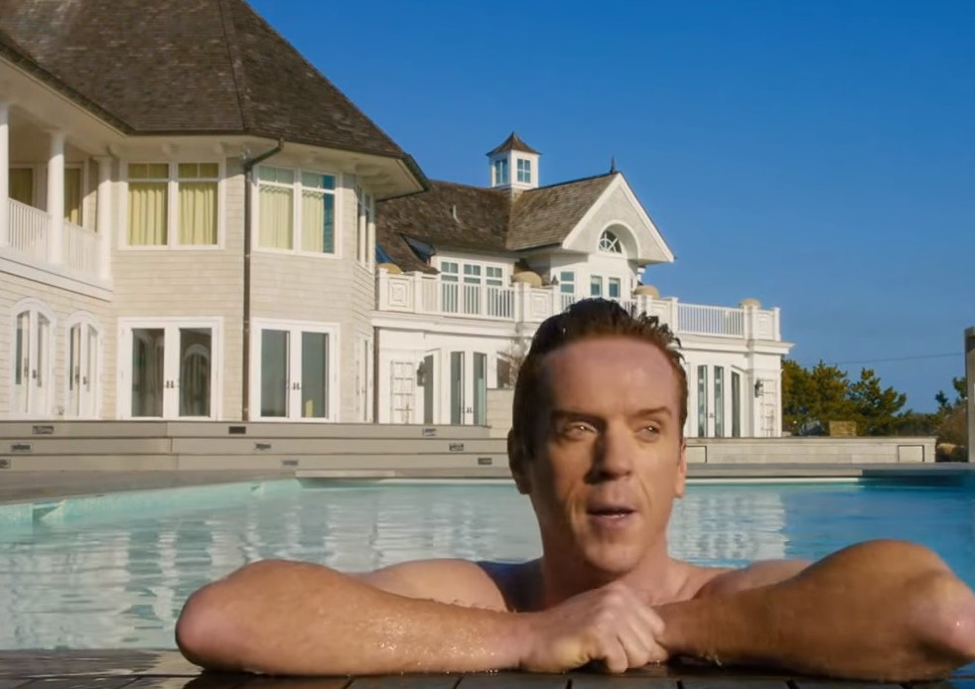
Did Homeland’s Brody Just Signal “The End” for Hedge Fund Boom?
The End
This is the end, beautiful friend
This is the end, my only friend, the end
Of our elaborate plans, the end
Of everything that stands, the end
No safety or surprise, the end
I’ll never look into your eyes, again
It Could be The End of not just Bobby Axelrod in 2017
Picture from Showtime Series “Billions” based on New York hedge fund world.
Daily Top Ten – November 1, 2016

1. Nov.1 Starts the “Good” 6 Months Based on Seasonality.
Market Seasonality Notes:
- Since October 31st, 2000, the Dow Jones Industrial Average is up over +68.19%. However, the seasonally weak periods during those years are cumulatively down -15.89%, while the seasonally strong periods have produced cumulative gains of 100.25%!
- During the May to October periods, there are 27 out of 67 years that finished down in this study, while there were only fourteen down years out of the other six months and only three in the last 30 years.
- There have been only three times when the “good six months” have lost more than -10% (1969, 1973 and 2008), but with respect to the “bad six month” time period there have been eleven losing efforts of -10%, or more.
- There have been fourteen instances since 1980 where the “good six months” have posted a double digit return while five of those returned more than 20%.
- Interestingly enough, following those times when the “bad six months” did produce double digit losses, the “good six month” period afterward lost more than 1% only once (2008) and on four occasions actually posted double-digit positive returns.
- Beginning in November 2009, the Dow began a streak of four consecutive double-digit efforts during the strong six-month periods, the second longest such streak in history.
- Again, this study is not the end-all for risk management, but it is very interesting and does expose a bias within the market that many investors are not aware of.
Daily Top Ten – October 31, 2016
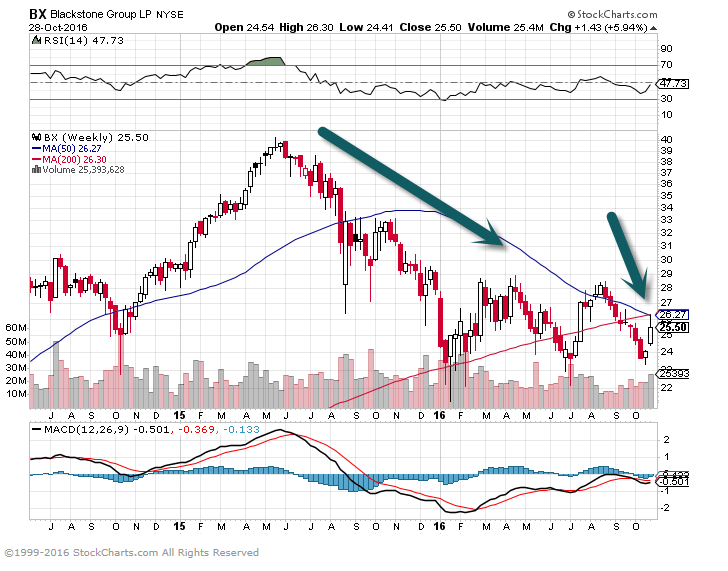
1. What is Blackstone Stock Telling Us About Private Equity Bull Market? Tell on Interest Rates? Leverage? Election?
BX-36% off highs…50day thru 200day to Downside on Weekly Chart.
Daily Top Ten – October 28, 2016
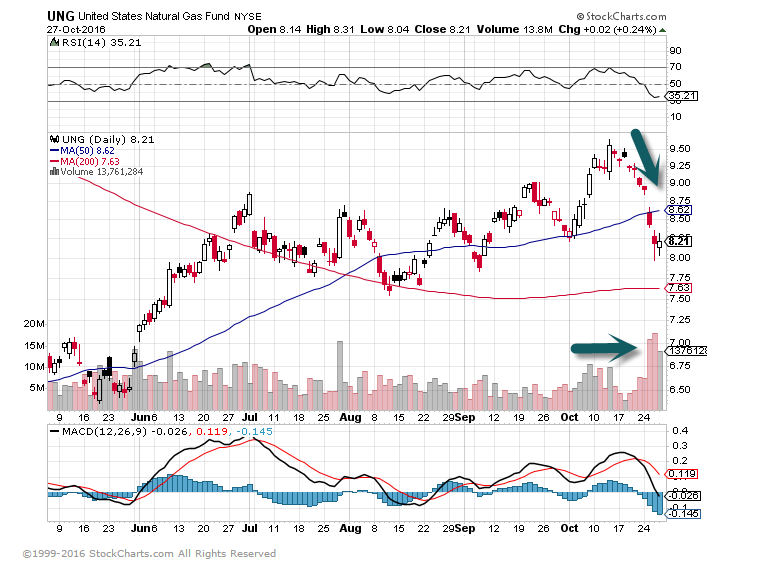
1. Warm Weather…Natural Gas 13.5% Pullback in 7 Days.
UNG Natural Gas ETF…See High Volume on Second Arrow.
Daily Top Ten – October 27, 2016
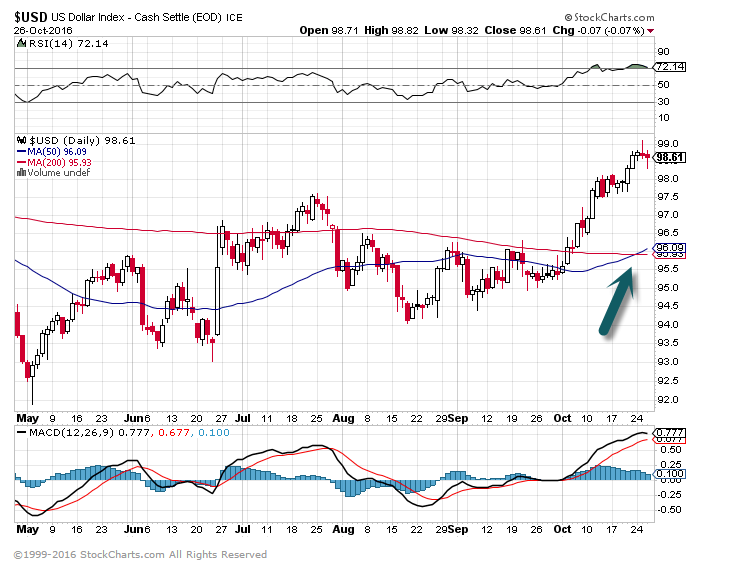
1. GoldenCross for the US Dollar after 143 days with 50day<200day. 11th longest streak ever w/out a Golden Cross – The US Dollar had a GoldenCross in July ’14 and it gained 21.6% the next 12 months for one of the best yearly gains ever. (@RyanDetrick)
U.S. Dollar Chart…See Blue 50day Crossing Thru Red 200day.
Daily Top Ten – October 26, 2016
1. Euro to U.S. Dollar Exchange Rate Rolls Over in October.
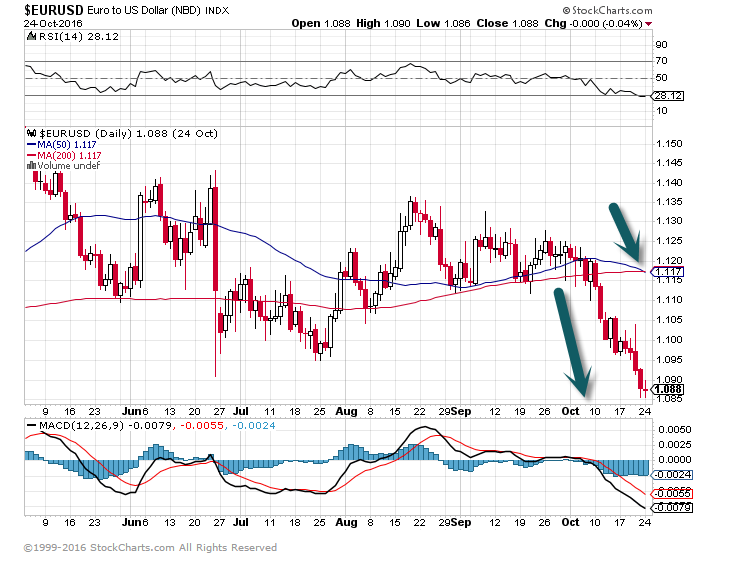
Euro to USD Chart….Breaks Summer Lows…50day thru 200day to downside.
Daily Top Ten – October 25, 2016
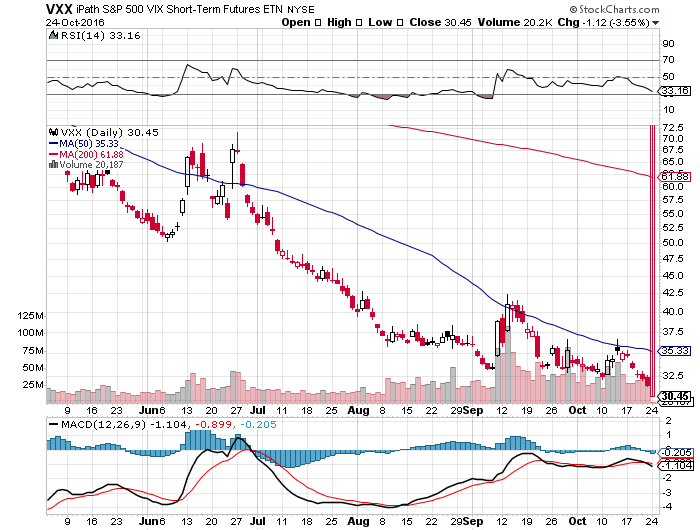
1. VXX Intermediate Term Volatility New Lows….-57% YTD
Fund Summary
The iPath® S&P 500 VIX Short-Term Futures™ ETN is designed to provide investors with exposure to the S&P 500 VIX Short-Term Futures™ Index Total Return. The S&P 500 VIX Short-Term Futures™ Index Total Return (the “Index”) is designed to provide access to equity market volatility through CBOE Volatility Index® futures. The Index offers exposure to a daily rolling long position in the first and second month VIX futures contracts and reflects the implied volatility of the S&P 500® at various points along the volatility forward curve.
Daily Top Ten – October 24, 2016
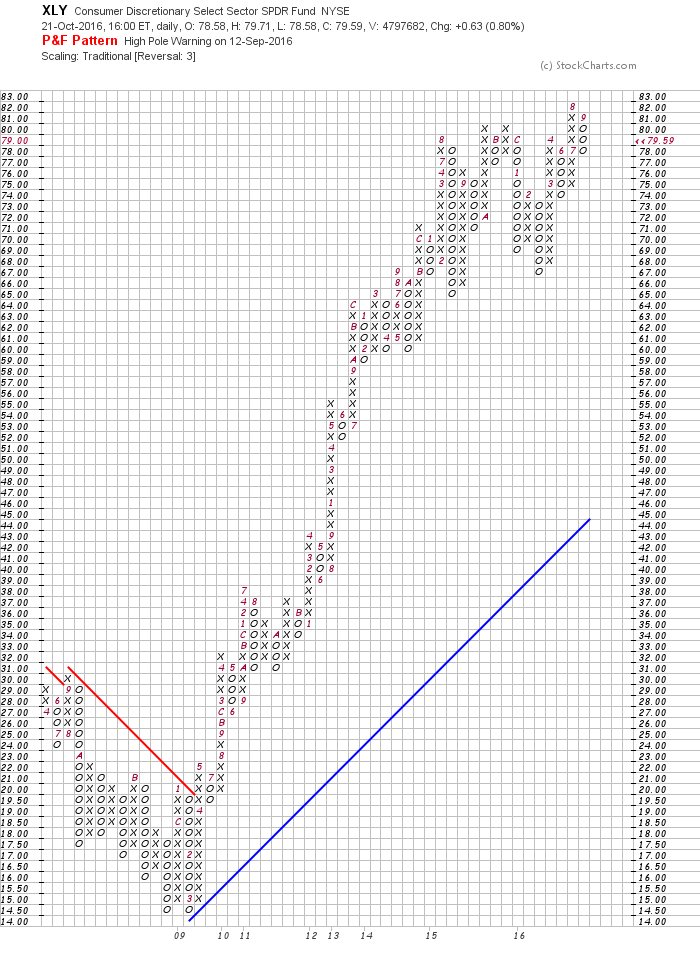
1.Consumer Discretionary Stocks have Tripled Since 2009…”Never Bet Against the American Consumer”—A Lesson I Learned on Trading Desk.
The Good News is that the Rest of the World wants to Spend Like Americans.
Yes, it’s true that if you’d bought the Consumer Discretionary Select Sector SPDRexchange-traded fund (ticker: XLY) eight years ago, you would have more than tripled your money—and earned more than twice the Standard & Poor’s 500 index’s roughly 150% gain.
XLY Consumer Discretionary ETF Rally from 2009 Vivid on Point and Figure Chart.
Daily Top Ten – October 21, 2016
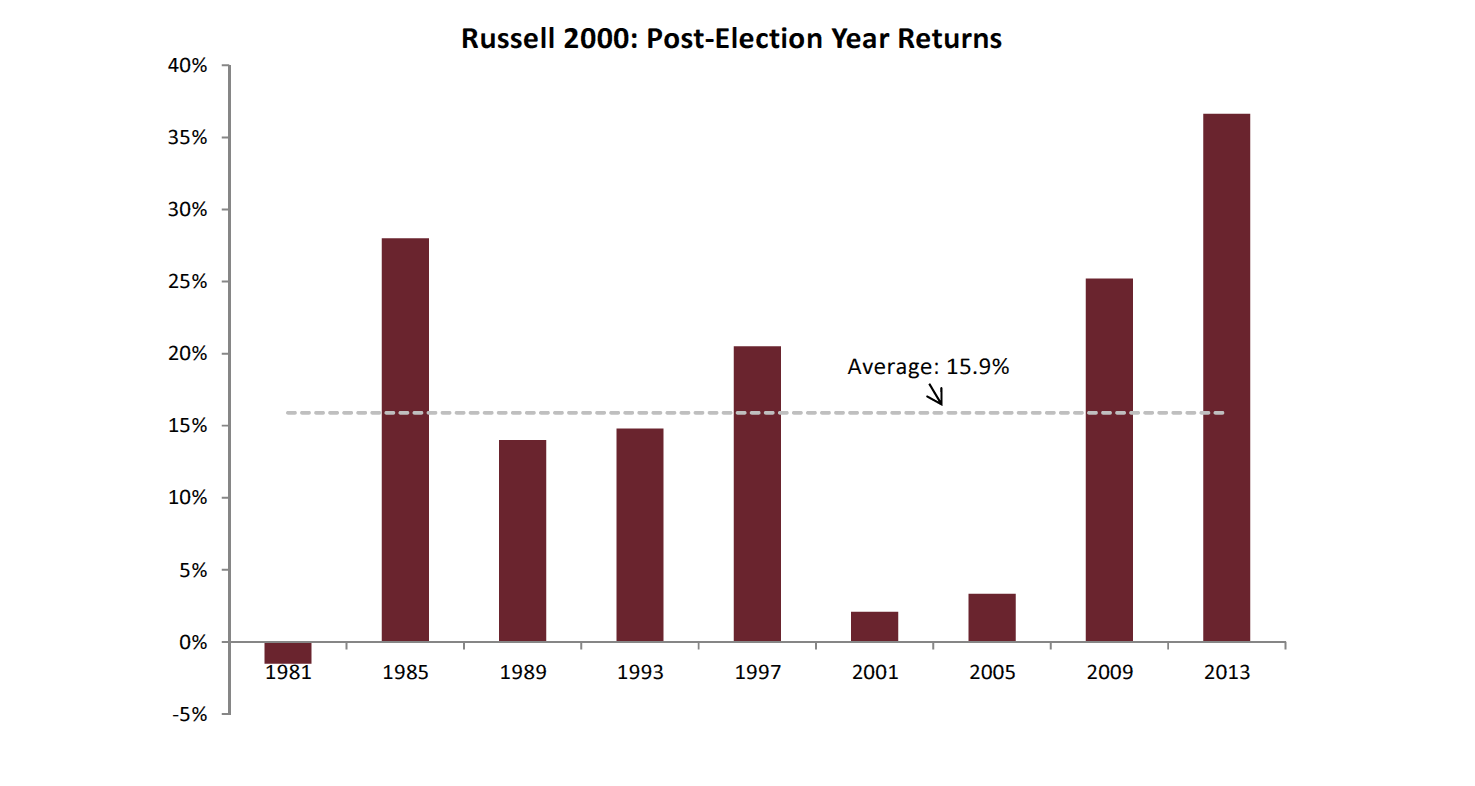
1. Russell 2000 Small Cap Post-Election.
 http://www.renmac.com/
Reach out to Eric for more information on Renmac research
EBoucher@renmac.com
Daily Top Ten – October 19, 2016
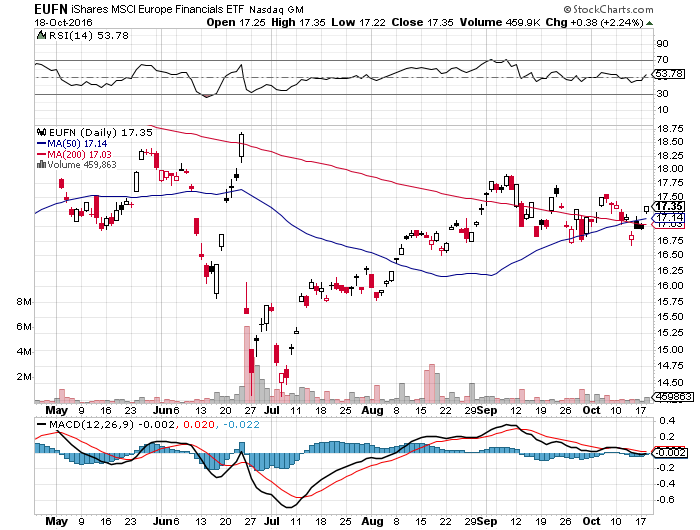
1. Euro Financials Showing Bullish Technical Action.
EUFN-Euro Financials ETF—50day thru 200day to upside.
Daily Top Ten – October 18, 2016
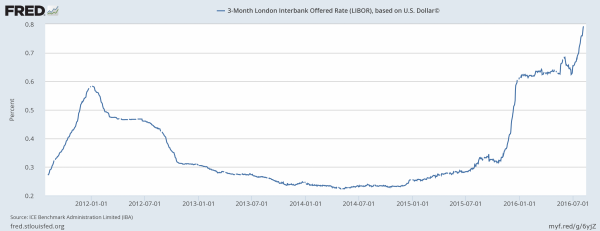
1. Three Month Libor at Highest Since 2009.
Heading Higher
While most benchmarks have remained low this year, Libor has climbed because of new money-market rules
Source: Bloomberg
Libor has risen to the highest level since 2009, even though the Fed’s benchmark has stayed constant. Given this discrepancy, it would be logical for companies to rely less on markets that are pegged to Libor and instead issue debt in fixed-rate markets that are more influenced by the fed funds rate.
THREE-MONTH LIBOR0.881%
But that’s not happening. In fact, companies have only accelerated their issuance of floating-rate debt. For example, new U.S. leveraged-loan sales have steadily ticked up in recent months.
Daily Top Ten – October 17, 2016
1. Weekend Bullets.
- *National Institute of Retirement Security-Poll of 40m working age households, some 45% of the total have accumulated exactly zero savings in retirement accounts.
- *Moody’s Investor Services-State Pension Plans short $1.25 Trillion at the end of their fiscal 2015. That’s It!
- *Strip energy out of the last 6 quarters S&P profit margins leaves them basically unchanged.
- *The Market has been positive during earnings season only 4x out of 10 when Alcoa drops 10% or more.
- *Short Interest in AMZN up 89% this year. E-commerce accounts for 8% of all retail sales in the U.S.—AMZN controls 60% of those sales.
- *Thailand had 7 prime ministers in 10 years.
- *Natural Gas Producers have fewer active drilling rigs heading into winter than in any other in the 29 year history of the Baker Hughes Rig Count.
- *More money manager mergers to come…Janus/Henderson expects to cut costs by $110m annually in first 3 years.
- *Salesforce sells for 218x pretax earnings and 7x sales.
- *Buybacks in the second quarter were down 21% from first quarter and 3% y over y
- *Volatility in August—S&P standard deviation during that month fell below 98% of all observances since 1950
Daily Top Ten – October 14, 2016
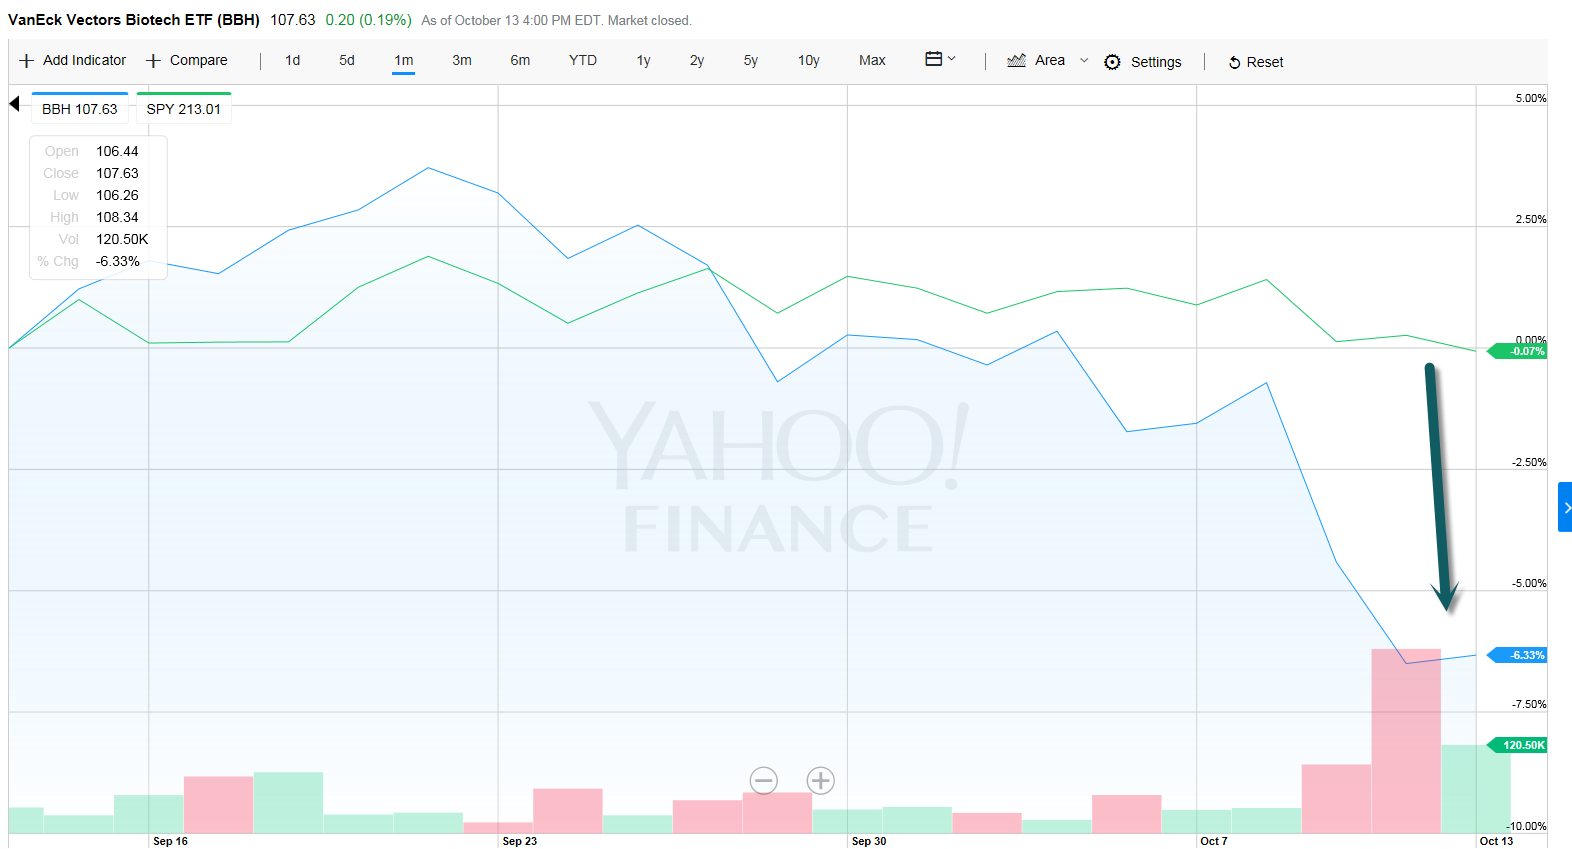
1. Biotech Takes a Beat Down.
Biotech -6% vs. S&P Flat in Last Month.
Daily Top Ten – October 13, 2016
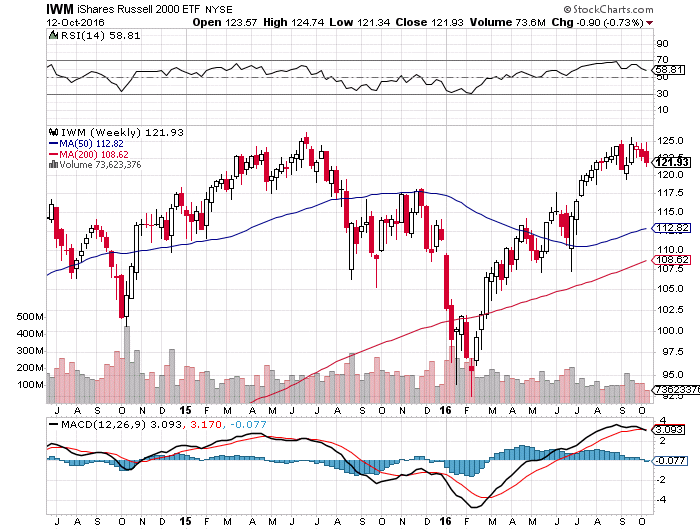
1. Small Cap did not Make it Above 2015 Highs on this Rally.
Russell 2000 index see below 2015 highs.
Daily Top Ten – October 12, 2016
1. We have discussed at length about the Dividend/Buyback Boom…Dividends plus buybacks have exceeded Barclays Research’s estimate of free cash flow by $100bn/yr.
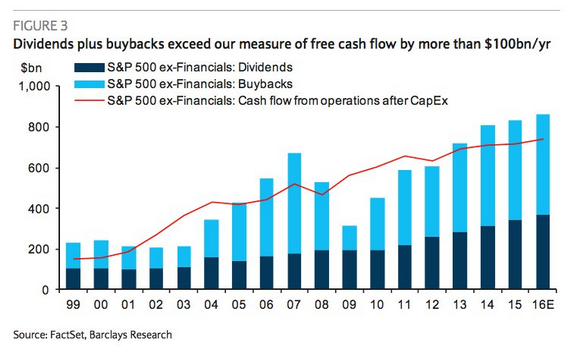
Source: Barclays, @joshdigga, @NickatFP
Daily Top Ten – October 10, 2016
1. Volatile Action in DB Last Night…Opened Down 4%…Now up over 1%.
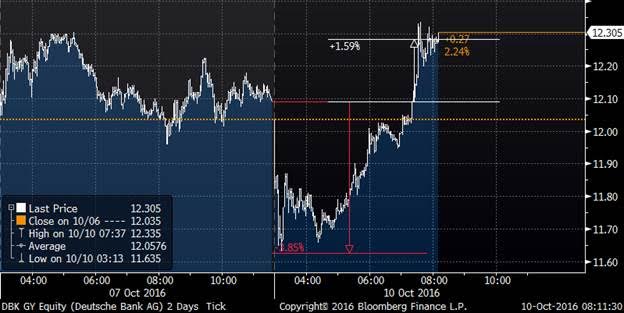
Deutsche Bank AG Chief Executive Officer John Cryan failed to reach an agreement with the U.S. Justice Department to resolve a years-long investigation into its mortgage-bond dealings during a meeting in Washington Friday, Germany’s Bild newspaper reported. “The risks in our derivatives book are massively overestimated,” DB Chief Risk Officer Stuart Lewis said. He said 46 trillion euros in derivatives exposure at Deutsche appeared large but reflected only the notional value of the contracts, while the bank’s net exposure to derivatives was far lower, at around 41 billion euros – DB opened DOWN 4% in Frankfurt, and is now UP 1.6% on the day…
Daily Top Ten – October 7, 2016
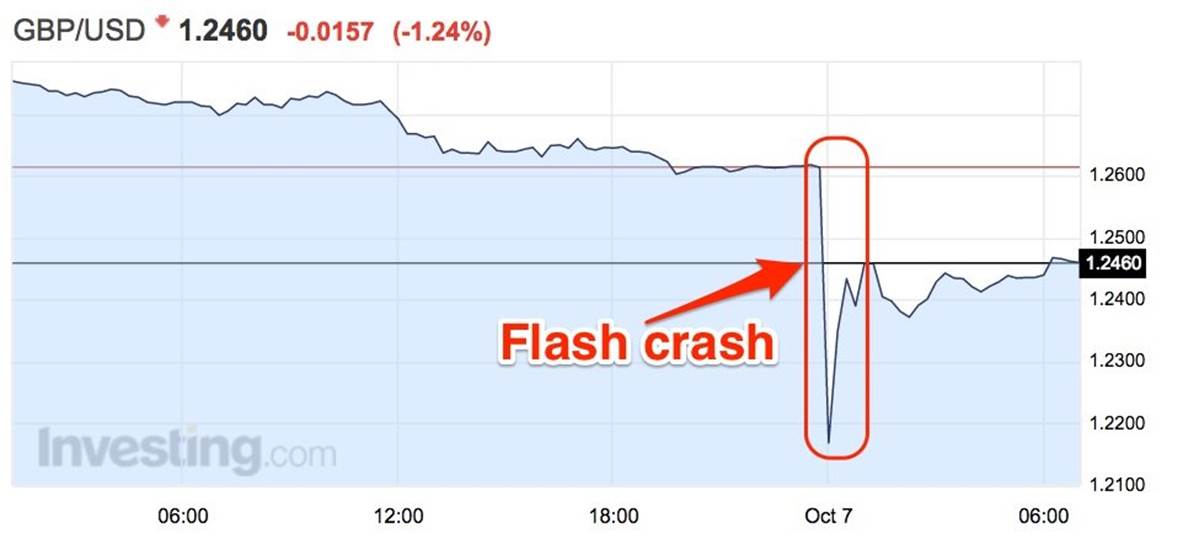
1.British Pound has a 6% Flash Crash Last Night
The crash was reportedly triggered by a Financial Times articles stating French President Francois Hollande wanted to be hard on Britain in Brexit negotiations. That pushed the pound lower, triggering some algos to automatically sell. Thin trading volumes meant the impact of this was outsized and created a downward spiral as the slump triggered more algos to sell.
Kathleen Brooks, Research Director at City Index, says in an email on Friday morning: “Apparently it was a rogue algorithm that triggered the sell off after it picked up comments made by the French President Francois Hollande, who said if Theresa May and co. want hard Brexit, they will get hard Brexit.
“These days some algos trade on the back of news sites, and even what is trending on social media sites such as Twitter, so a deluge of negative Brexit headlines could have led to an algo taking that as a major sell signal for GBP. Once the pound started moving lower then more technical algos could have followed suit, compounding the short, sharp, selling pressure.”
Daily Top Ten – October 6, 2016
“Dream On” Presidential Election and Rate Hike Cycle Threaten the Markets
“I know nobody knows
Where it comes and where it goesI know it’s everybody sin
You got to lose to know how to win”— Aerosmith
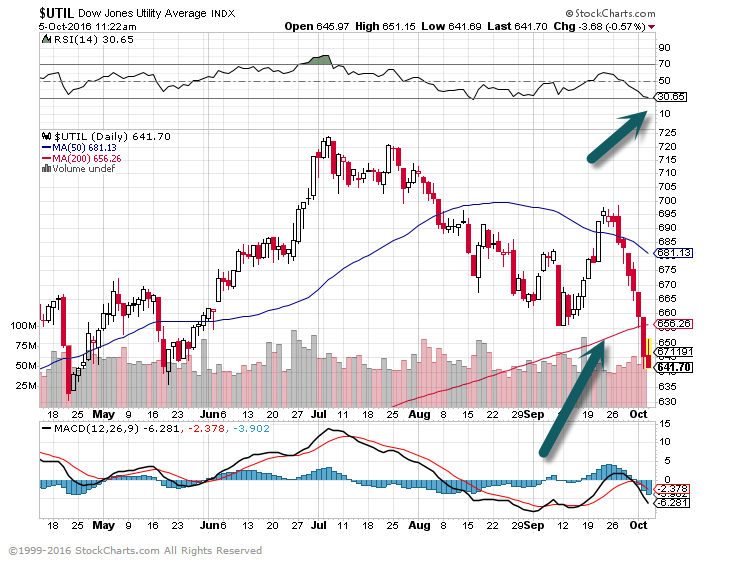
The next big worries putting pressure on the markets are the presidential election and the inevitable rise in interest rates. Some would argue that these headwinds are ultimately linked by politics. Although Republican nominee Trump may be the most unpredictable wildcard of all-time, we know from past letters pertaining to short-term volatility that “You got to lose to know how to win…” as legendary Aerosmith lead singer, Steven Tyler, would wail.
Daily Top Ten – October 4, 2016
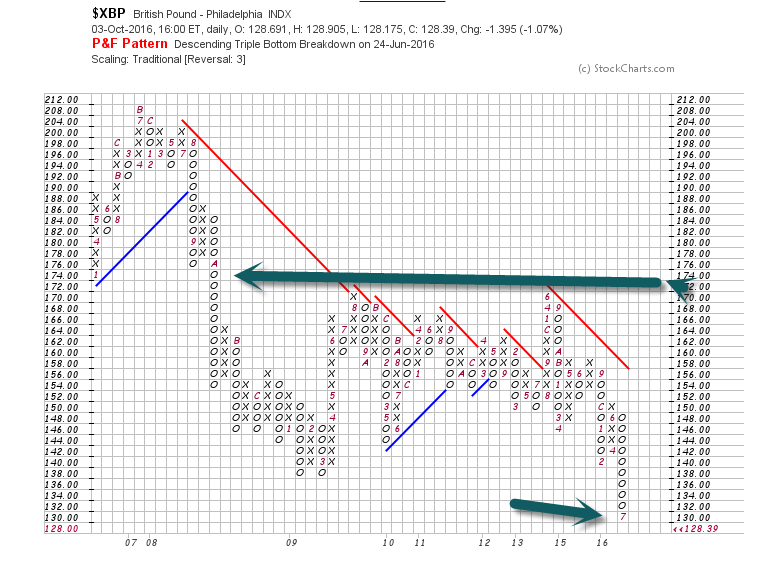
1. British Pound Falls to 31 Year Low Versus U.S. Dollar.
Pound Falls Below Crisis Low, breaks below 7 Year Range.
Daily Top Ten – October 3, 2016
Daily Top Ten – September 30, 2016
1.Deutsche Bank Broke the Jeff Gundlach $10 Danger Zone Last Night.
Deutsche shares sold off sharply in US trading.
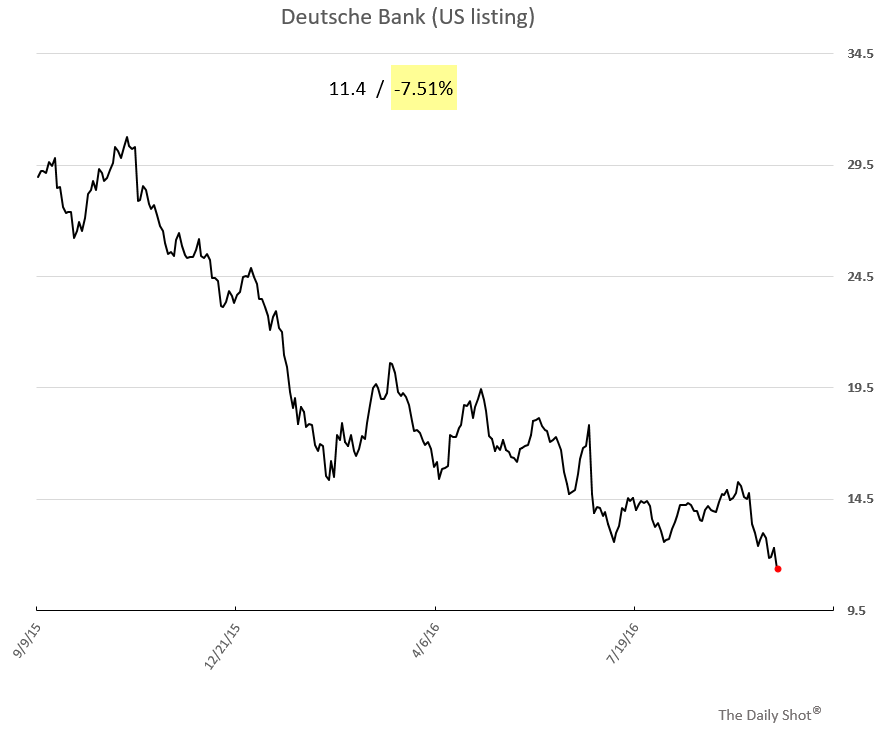
Moreover, the implied volatility on US-listed DB shares spiked to multi-year highs.
Daily Top Ten – September 28, 2016
1. World’s Biggest IPO Opens at Low End of Range with Book of “Cornerstone Investors.”
It may have been the world’s largest IPO in two years, but shares of Postal Savings Bank of China hit the Hong Kong market like a wet firecracker after the lender raised $7.4B, but priced the deal near the bottom of its marketing range. The lukewarm start comes as investors remain cautious on the outlook for the Chinese banking industry, battling with mounting bad debts amid a slowing economy.
Daily Top Ten – September 27, 2016
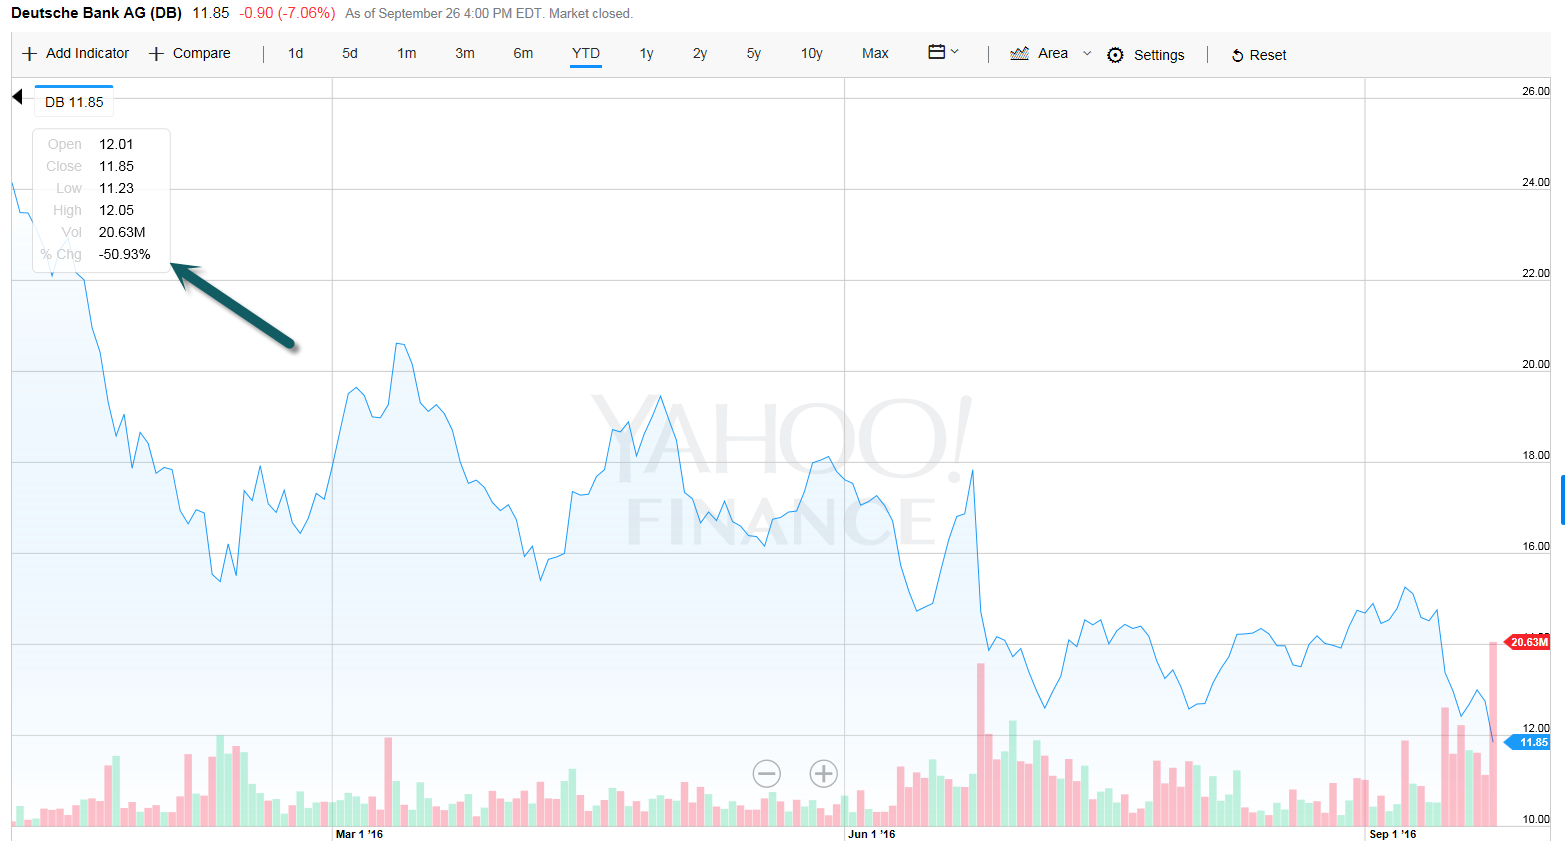
1. More Important than the Debate…DB Watch…-7% Yesterday…-50% YTD.
U.S. Fines were Bigger than DB Market Cap.
Daily Top Ten – September 26, 2016
1. ETFs to Watch Post Debate…Here are the Top ETFs to Track after Tonight’s 100m Viewer Debate
Infrastructure ETF — Close to New All-Time Highs. Both Candidates Advertising Big Infrasturcture Spending.

Daily Top Ten – September 23, 2016
Daily Top Ten – September 22, 2016
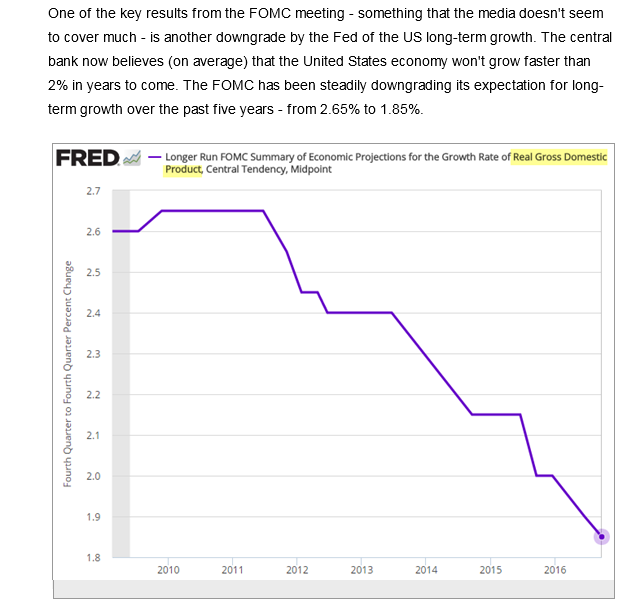
1. Possibly the Biggest Data Point from FED Meeting….Projecting U.S. Growth to Stay Around 2%.
Daily Top Ten – September 21, 2016
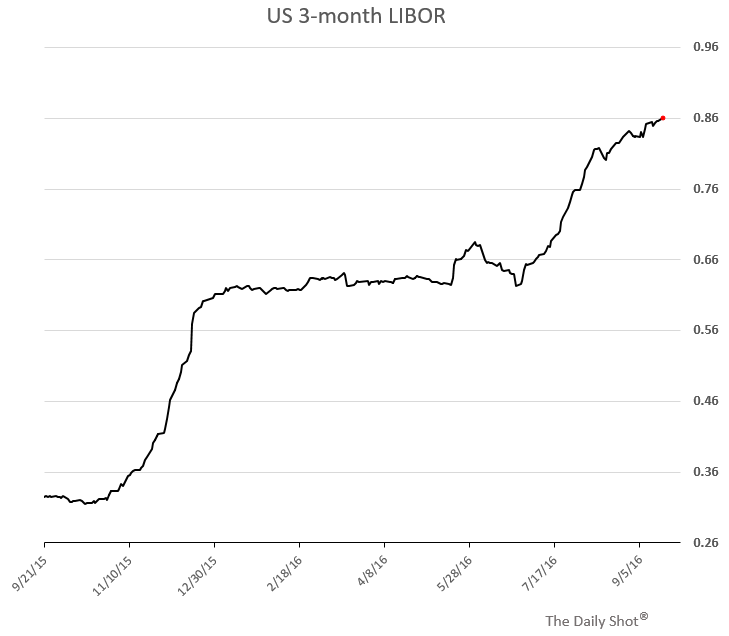
1. Does the Fed Need to Raise Rates?
Rates already rising, even though U.S. economic data is tepid.
Indeed, LIBOR rates continue grinding higher and the TED Spread has widened sharply…3 month Libor up 145% off low base.
Daily Top Ten – September 20, 2016
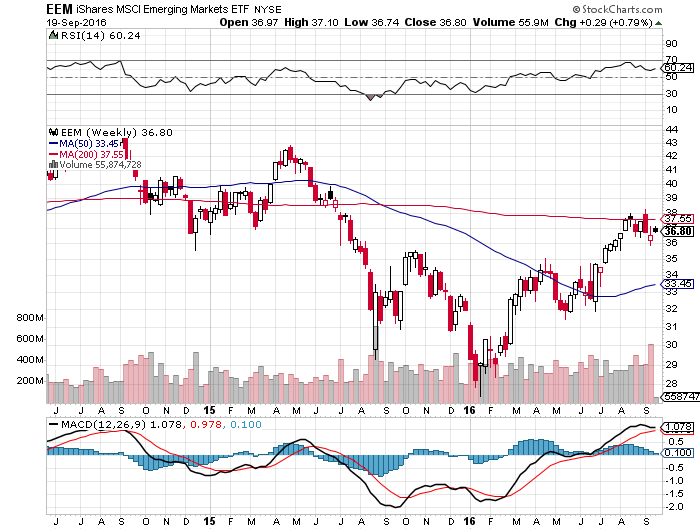
1.Emerging Markets ETF Rallies Right to 200day.
EEM Stopped at 200day …Red Line on Weekly Chart.
Daily Top Ten – September 16, 2016
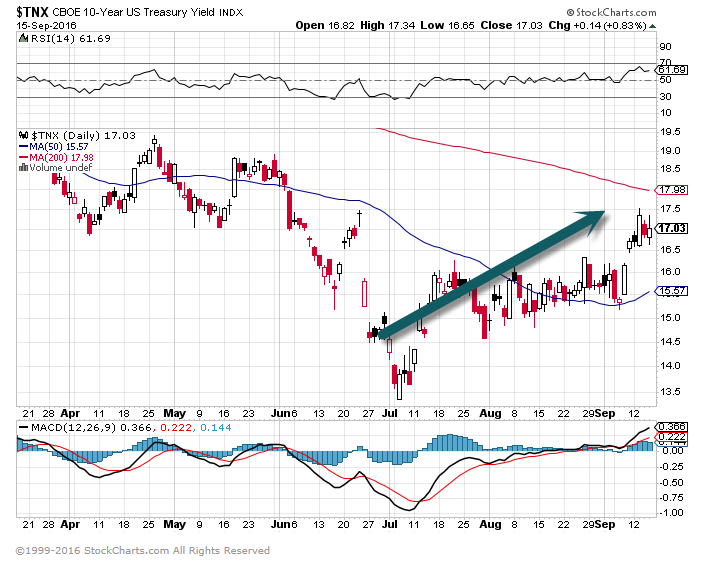
1. 26% Move Up in 10yr. Treasury Yield….33bps. Move is Less Than One-Quarter of the 138bps. Move During Taper Tantrum (May 2013).
TNX-10yr. Yield Chart.
Daily Top Ten – September 15, 2016
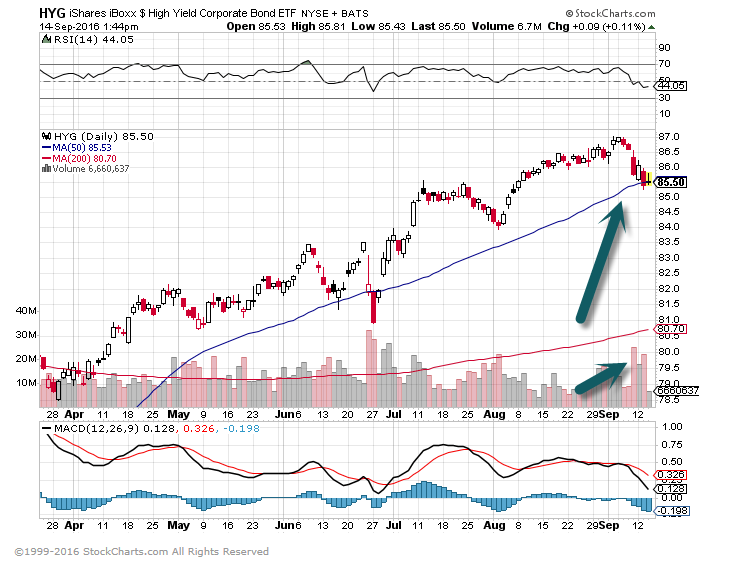
1.High Yield Bonds–HYG has seen $1B in Outflows in the last week (Bloomberg), and has closed under the 50dma.
Daily Top Ten – September 14, 2016
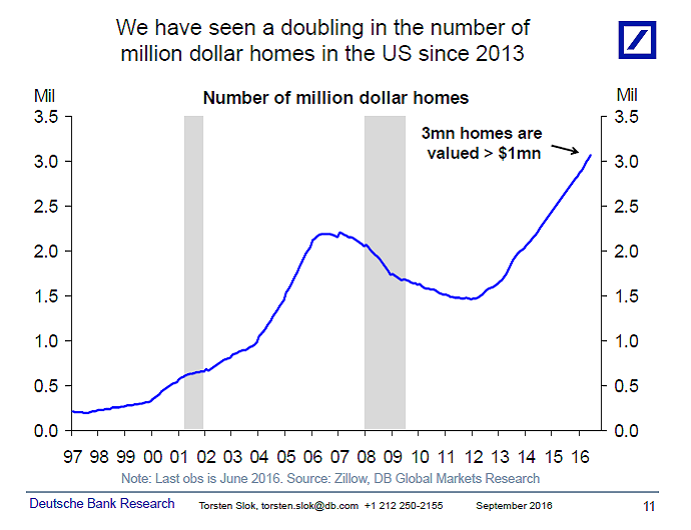
The outlook for consumer spending is significantly supported by the increase in home prices seen over the past three years, see chart below.
Daily Top Ten – September 9, 2016
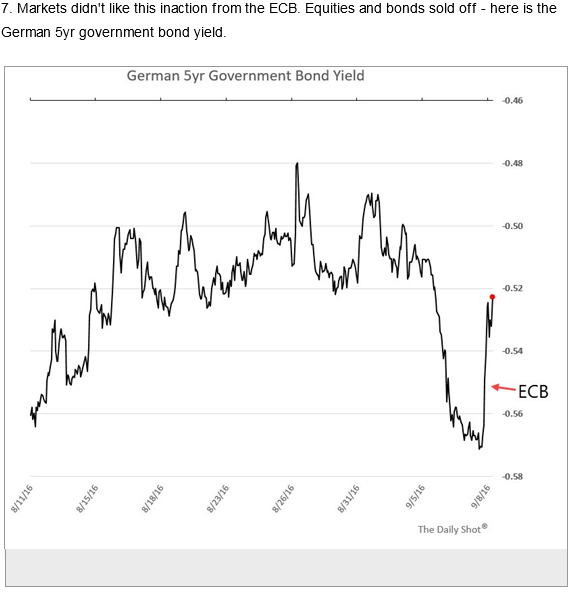
1.ECB Does Nothing Causing Some Overnight Bond Volatility.
Global equities are also lower after the European Central Bank held interest rates at record lows and refrained from adding new stimulus. While President Mario Draghi said the ECB was looking at options to continue its money-printing program, investors were looking for more immediate action, including an extension or expansion of the current plan, or at least clearer hints of future actions.