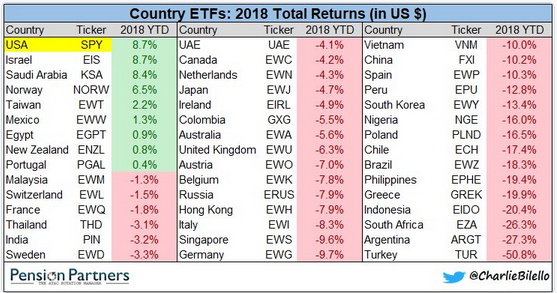
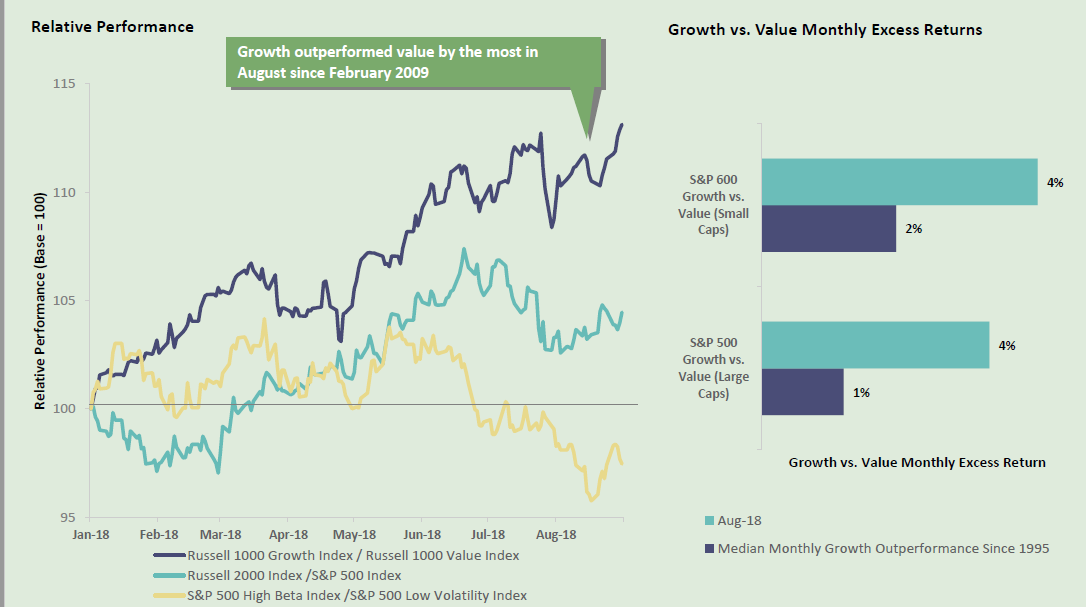
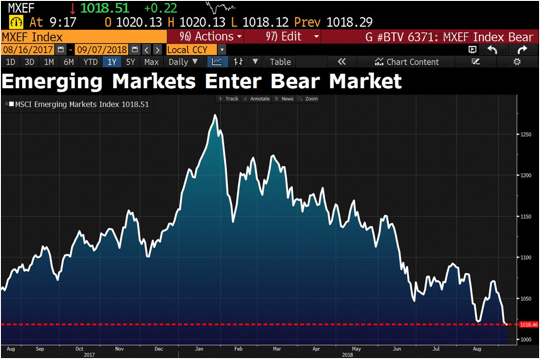
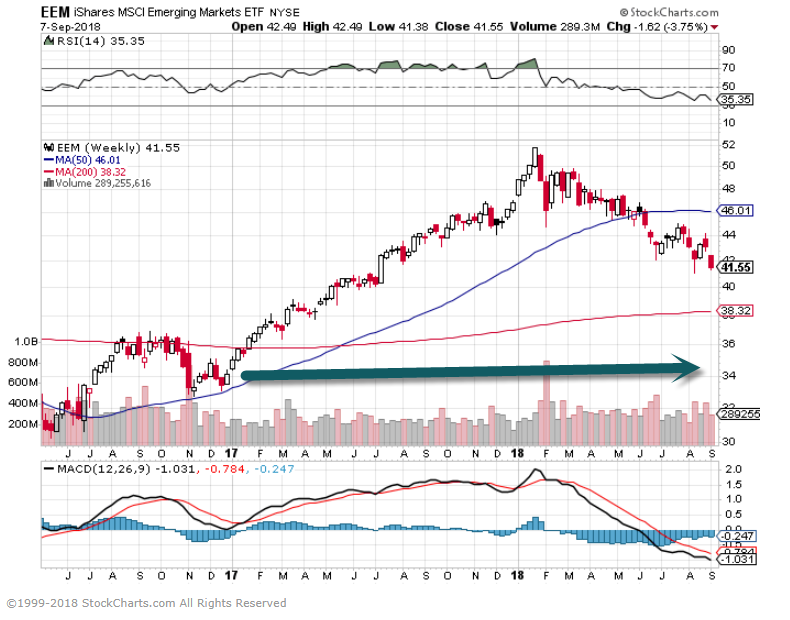
Topley’s Top Ten – January 18, 2019

1.Performance Based on Valuations Since Dec. 24th Lows.

Bespoke

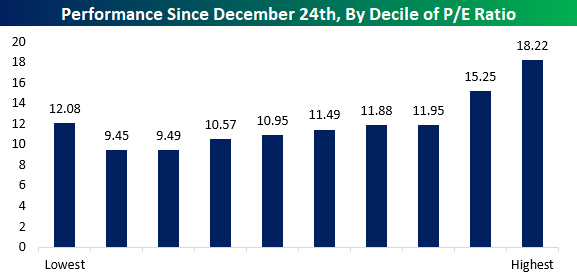
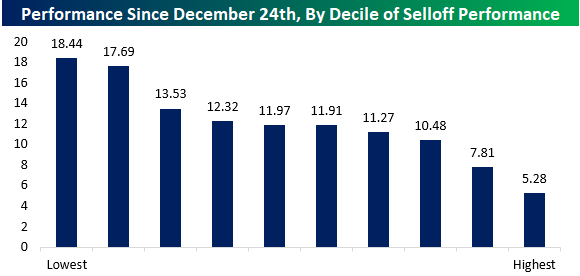
The first chart below shows the performance of S&P 500 stocks based on their valuations as of 12/24 with the most attractively valued (lowest P/E ratios) stocks to the left and the most expensive (highest P/E ratios) on the right.  The best performing decile by far was the one containing the stocks with the highest P/E ratios, and for the most part, performance steadily declined as you moved left towards the more attractively valued stocks.  The second chart shows performance since the lows based on stocks grouped according to how they performed during the market decline.  Here, the best-performing stocks were the ones that were originally down the most, while the worst performing stocks were the ones that held up the best during the decline.

In both cases, these performance results make perfect sense.  During market sell-offs, as investors become more risk averse it is typical to see stocks with the most aggressive valuations sell-off the hardest while more reasonably priced stocks hold up better.  However, when the market turns around and investors become less risk-averse, they flock to the more aggressive high growth/high valuation stocks.  Likewise, when the market shifts its tone from a defensive posture (during a sell-off) to a more offensive tone (rally) it is only natural that the stocks that held up the best during the defensive phase (like Utilities) underperform during the next more aggressive phase.  Anything else would be contrary to the norm.

Start a two-week free trial to Bespoke Premium to see today’s full Morning Lineup report. You’ll receive it in your inbox each morning an hour before the open to get your trading day started.

https://www.bespokepremium.com/think-big-blog/

Continue reading →

Topley’s Top Ten (Short Version) – January 15, 2019

Click Here for Quarterly letter

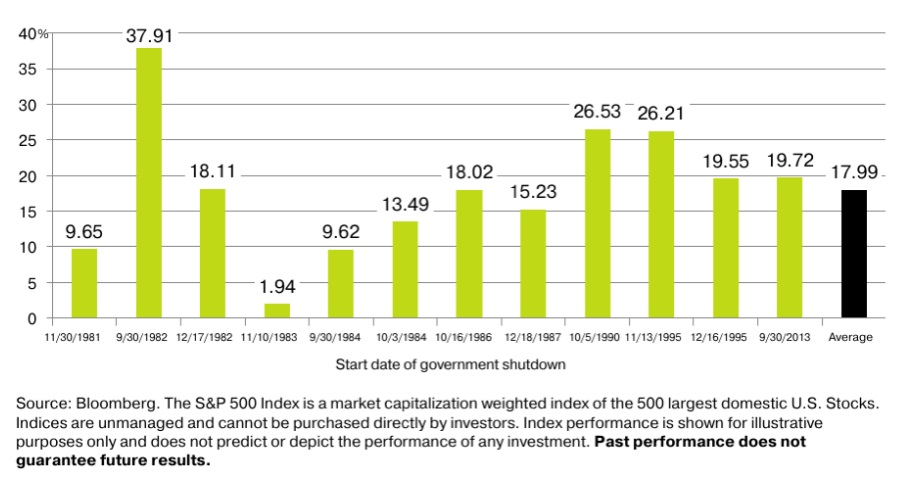
1.Aggregate S&P Total Return 12 Months Post-Shutdown.

Renmac Research

Without much certainty of a potential end to the political gridlock, we look to factors such as the aggregate S&P 500 index total return 12 months post-shutdown. To receive updates from our Washington Policy Analyst Steve Pavlick & the full team, connect here: http://qoo.ly/uj4xx

https://www.linkedin.com/company/renaissance-macro-research/

Continue reading →

Topley’s Top Ten – January 14, 2019

1.Quarterly Letter.

As Springsteen Takes Off on Broadway, Investors Got Blinded By the Light

January 9, 2019

Matt Topley
4th Quarter, 2018

 “She Got Down But She Never Got Tight She’s Gonna Make It Through the Night”

Blinded by the Light

Blinded by the light
Revved up like a deuce
Another runner in the night

She got down but she never got tight
She’s gonna make it through the night

Songwriters: Bruce Springsteen
Blinded by the Light lyrics © Downtown Music Publishing

Springsteen’s off-Broadway

I recently watched Springsteen’s fabulous Broadway performance on Netflix, having seen The Boss over 20 times myself, it still was unreal to hear him tell personal stories around growing up and his career.  As I watched one of the most volatile stock market year ends in history, I couldn’t help but apply investors psyche to a Springsteen song.  Most investors got Blinded by the Light, it was just too easy, buy FANG stocks, buy S&P index, buy anything.  After 2017 being one of the least volatile years in market history including no drawdown of S&P over 3% versus historical annual average drawdown of 14%, the market sent a giant wake-up call that investing is always emotional including an all-time record almost 3% Christmas Eve smack down.  Here’s the good news, it seems she (market) is going to make it through the night as she always does, it’s not 2008 or anything close, we have some wood to chop in the short-term but valuations are reverting to mean.

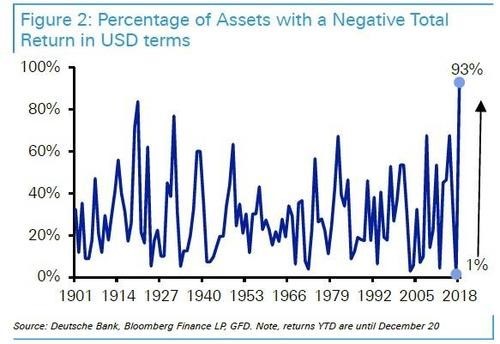
2018 was a historic year for financial markets in more ways than one-first time in 27 years that stocks and bonds were both negative in the same year, worse stock market December since 1931, over 90% of investable assets were negative in 2018, and no asset class returned over 5% for the first time since 1974.

A Record Share of Asset Classes Posted a Negative Return in 2018

Investors felt pain this year across the board as diversified portfolios were nowhere to hide, in fact some well diversified holdings returned less than the S&P due to exposure to bonds, commodities, international stocks and U.S. small cap stocks.  Three of these groups were down more than the S&P and most bonds were flat to negative.  The tradtional 60/40 model was negative for the year with returns coming in 13% below historic median, if you’re 60/40 was global returns were even lower.  Target Date funds are popular and growing especially in 401k plans, see below as they are posting first negative returns in 10 years.

Read Full Letter
Continue reading →

Topley’s Top Ten (short version) – January 11, 2019

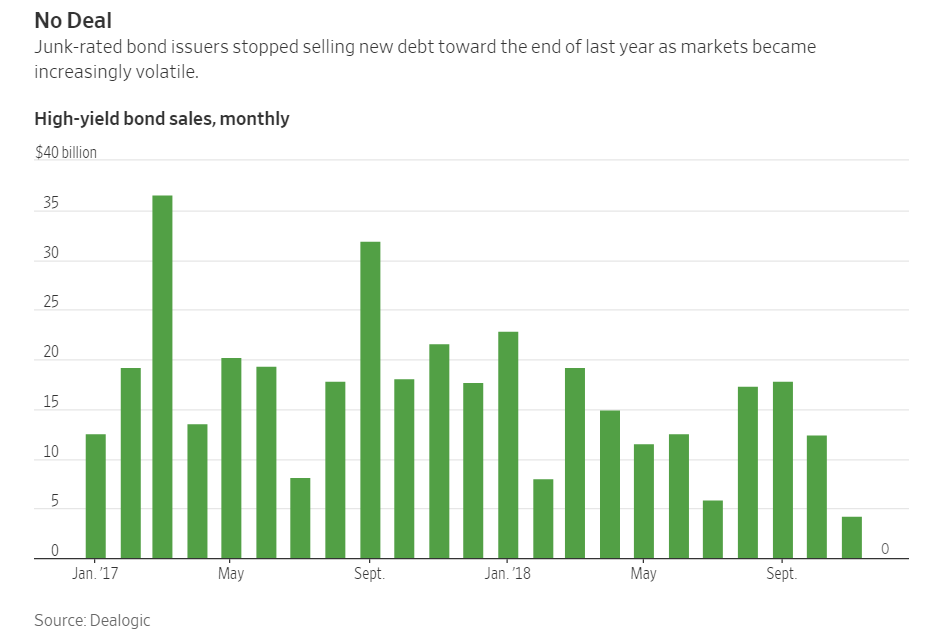
1.Junk Bond Sales Dried Up at End of 2018.

Slack investor demand recently lifted to the highest level in more than two years the premium, or spread, that companies with junk credit ratings must pay over risk-free government debt. The corresponding fall in high-yield bond prices last quarter erased investors’ gains in what had been one of the few bright spots in the bond market in the first nine months of 2018.

Junk-rated companies haven’t been completely absent from the debt markets. Issuance of so-called leveraged loans totaled $25 billion in November and December, according to LCD, a unit of S&P Global Market Intelligence. But that was still a significant slowdown from prior months.

Junk-Bond Sale Ends 40-Day Market Drought

Deal follows record dry spell that began in November, suggesting an improving corporate-debt market

By
Daniel Kruger and Sam Goldfarb

https://www.wsj.com/articles/a-junk-bond-drought-is-making-investors-nervous-11547116200 Continue reading →

Topley’s Top Ten – December 10, 2018

1.$Trillion Dollars in Stock Buybacks…Record.

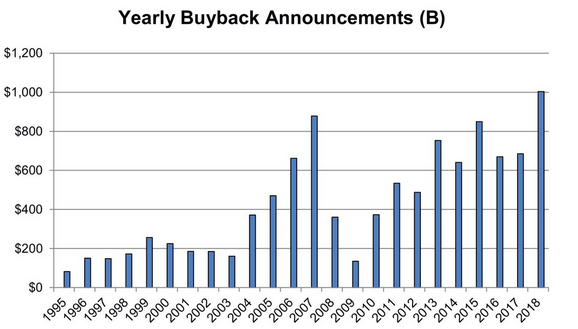
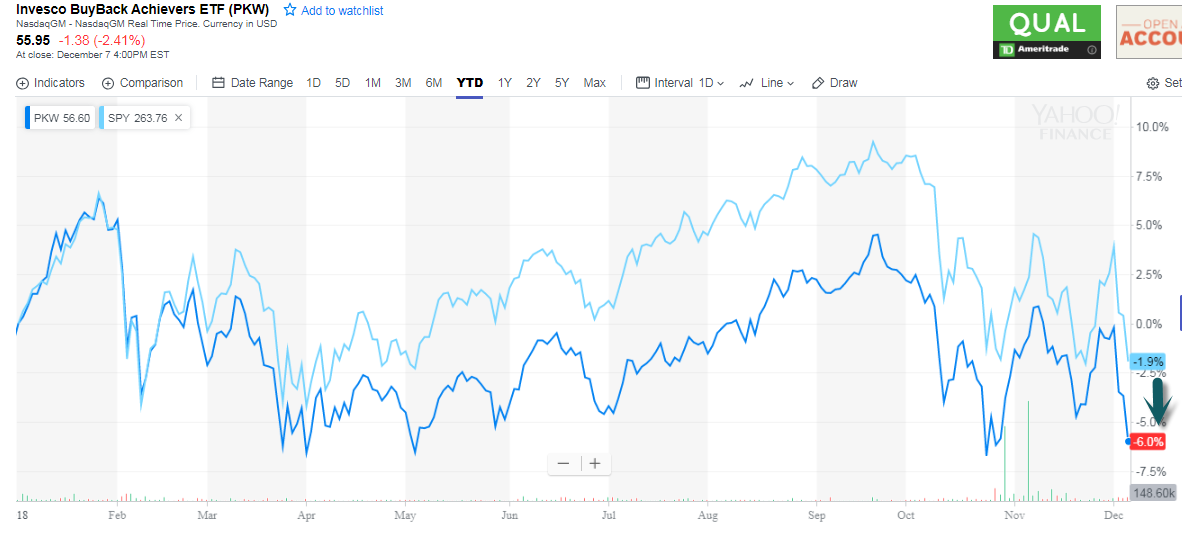
Buybacks certainly helped in the afternoon – With today’s buyback announcements, value announced so far this year now above $1 trillion, highest yearly figure ever … even backing out Apple’s $100 billion announcement this year, 2018 is still the highest on record

From Dave Lutz at Jones Trading.

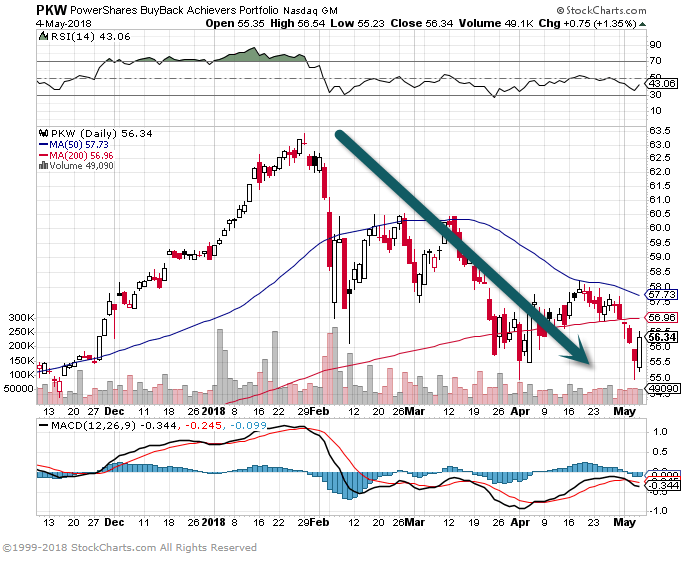
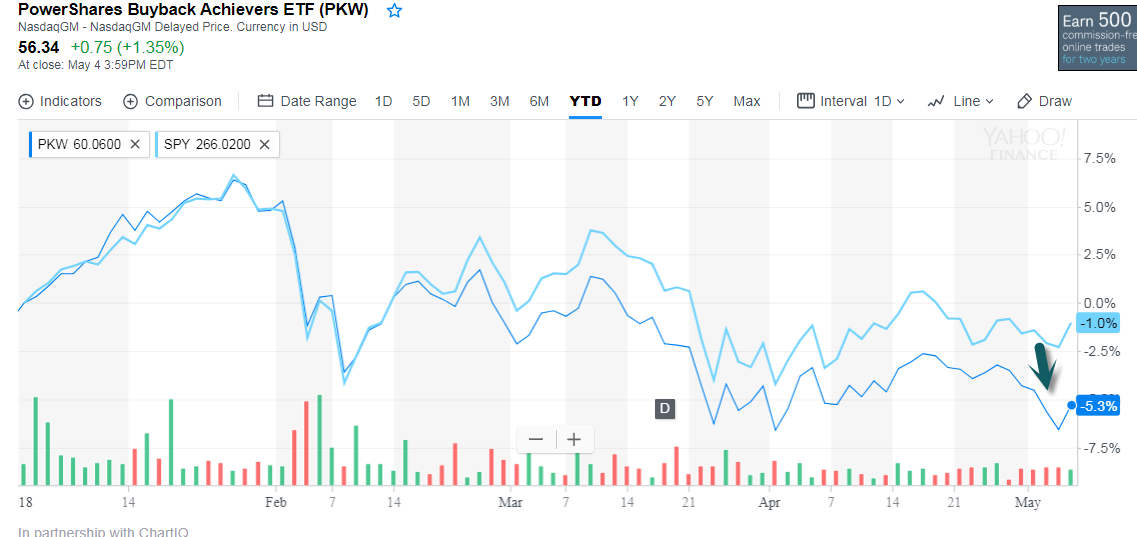
BUYBACK ETF PKW Trailed S&P All Year.

www.yahoofinance.com

Continue reading →

Topley’s Top Ten – November 19, 20185

1.Thanksgiving Market Returns

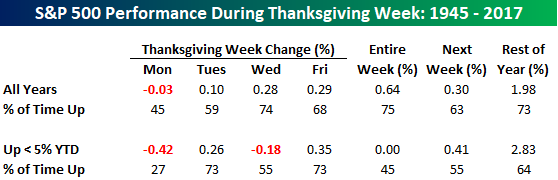
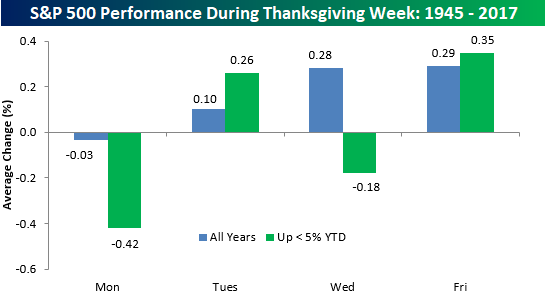
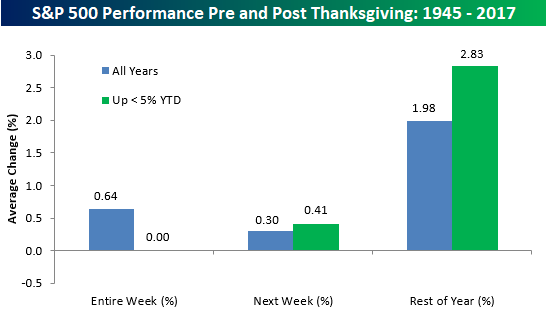
Thanksgiving week has historically been a positive time for the equity market.  Since WWII, the S&P 500 has averaged a gain of 0.64% during Thanksgiving week with gains three-quarters of the time.  Market trends heading into this Thanksgiving aren’t as positive for the bulls, though.  As shown in the table below, during years where the S&P 500 was positive but up less than 5% YTD heading into Thanksgiving week, the index’s average change during the week has been 0.00% with gains less than half of the time.

On a day to day basis, for both all years since WWII and in years where the S&P 500 was up less than 5% heading into Thanksgiving week, Monday has been the worst trading day as it is the only day of the week with negative average returns and positive returns less than half of the time.  Tuesdays and Friday, however, have been positive days, though, with average gains of 0.10% and 0.29%, respectively.  Additionally, for those years where the S&P 500 was up YTD but up less than 5%, Tuesdays and Fridays have been even stronger with average gains of 0.26% and 0.35%, respectively.

As we move past Thanksgiving, though, seasonal trends for the market based on this year’s performance so far improve.  In those years where the S&P 500 was up less than 5% YTD heading into Thanksgiving week, the average gains the week after Thanksgiving was 0.41% with positive returns 55% of the time.  For the remainder of the year, average returns were even stronger at +2.83%.  Not bad for a period of just over five weeks!

https://www.bespokepremium.com/think-big-blog/

Continue reading →

Topley’s Top Ten – November 15, 2018

1.Earnings…Positive Sales Surprise Slow Down.

Jefferies

3Q earnings did not materialize as the positive catalyst investors were hoping for following Powell PBS, Pence China speech & US-China sentiment deterioration, PPG pre-announcement, IMF global growth downgrade, etc – all in early October.

The qualitative commentary from Q3 included slowing demand in China/EM/Europe (particularly auto), margin pressure, and trade war impact.

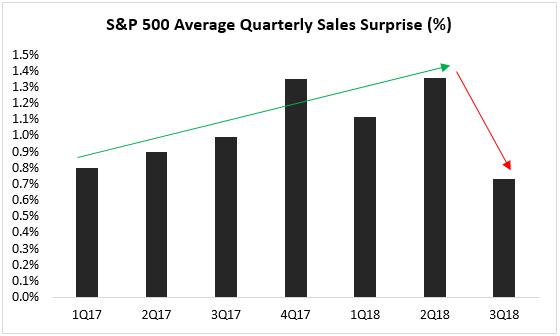
The average sales surprise was the lowest going back to 1Q17 – breaking a largely positive surprise trend over the prior 6 quarters.

Source: Jefferies Trading Desk

Through and following Q3 earnings, 2019 consensus EPS has been revised lower.

Again, the trend is more worrisome than the dollar amount – thus far – reduced.

Source: Jefferies Trading Desk
Percy Allison vix
Equity Trading, Desk Strategist
Jefferies LLC

Continue reading →

Topley’s Top Ten – November 13, 2018

1.Who Is Going to Buy $1.3 Trillion in New U.S. Government Debt?

Asian investors are proving less and less eager to buy U.S. government bonds, even as the Treasury Department prepares to sell $1.3 trillion of new debt in the new fiscal year.

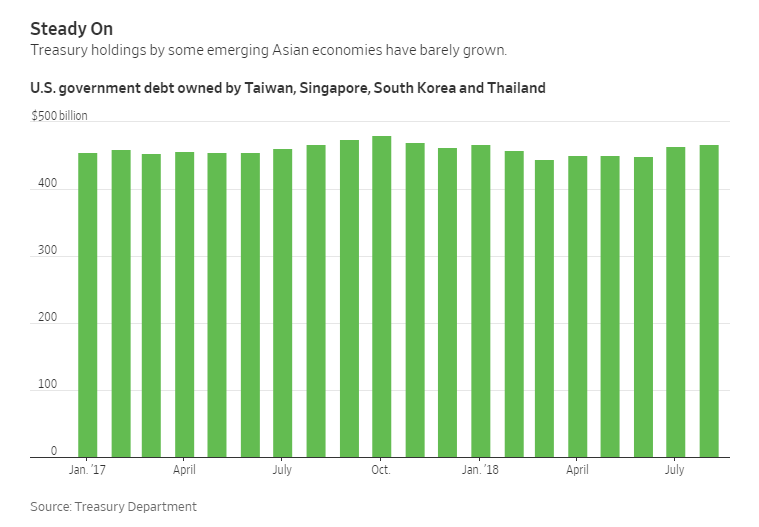
Foreigners increased their holdings of Treasurys by $78 billion in the first eight months of this calendar year, according to the Treasury. That is just over half of what they bought in the same period last year.

Holdings have particularly stagnated in a number of emerging Asian economies—including South Korea, Singapore, Thailand and Taiwan—which have prized U.S. government debt as a capital bulwark since the 1997 Asian currency crisis.

Many observers assume the U.S. has no trouble finding demand for its debt in the vast pool of world-wide governments, financial institutions, mutual funds and individual investors who want to own the world’s major risk-free asset. Yet the Treasury is finding fewer buyers in some parts of the world, leaving domestic investors such as mutual funds to pick up the slack.

Where to Find Treasury Buyers? Not Asia

The erosion of demand in emerging Asian markets reflects their maturation into more stable economies

https://www.wsj.com/articles/where-to-find-treasury-buyers-not-asia-1541422801?reflink=e2twmkts.\

Continue reading →

Topley’s Top Ten – November 12, 2018

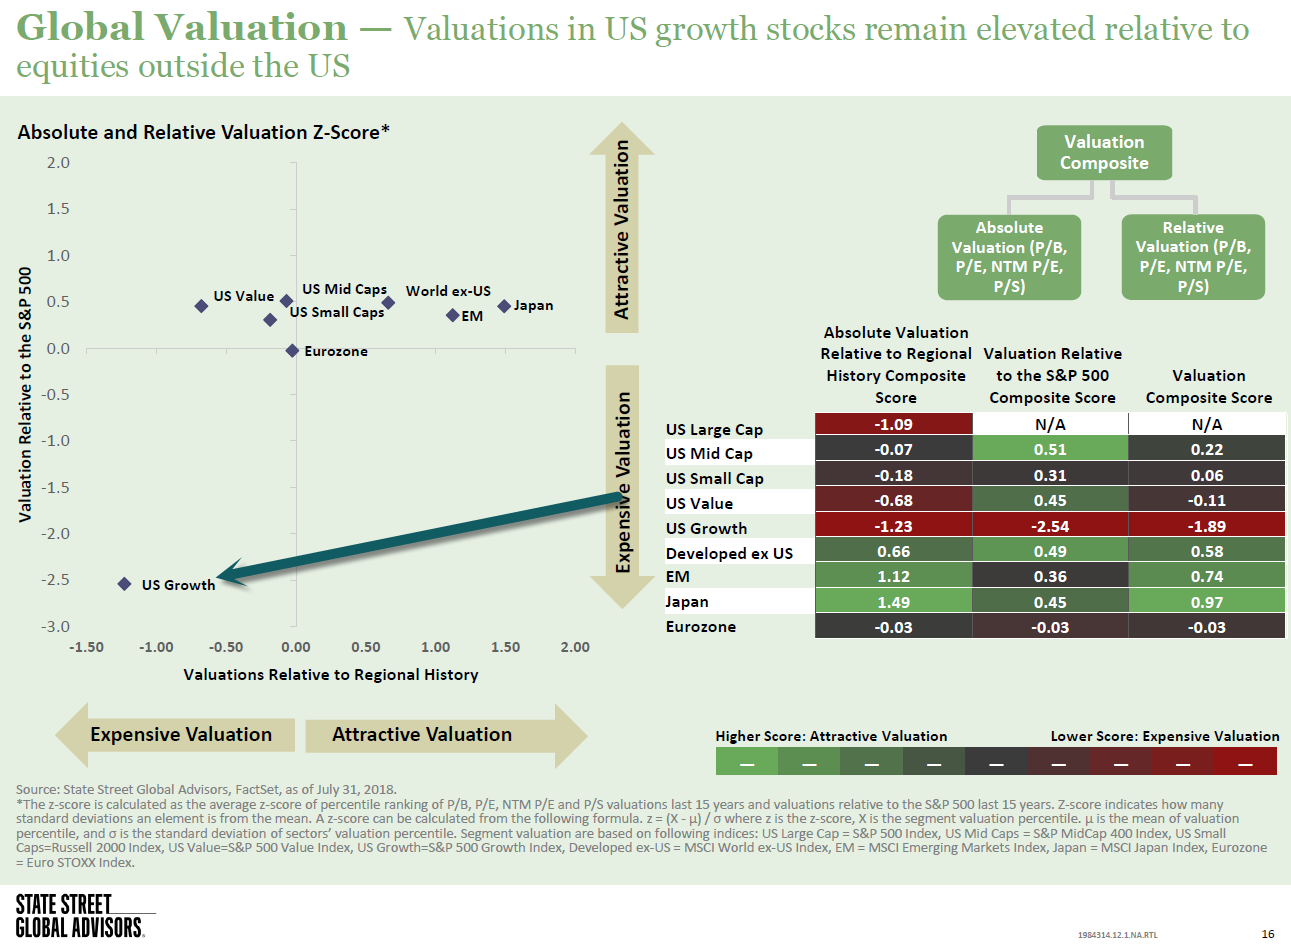
1.Growth Continues To Crush Value This Year For US Equity Factors

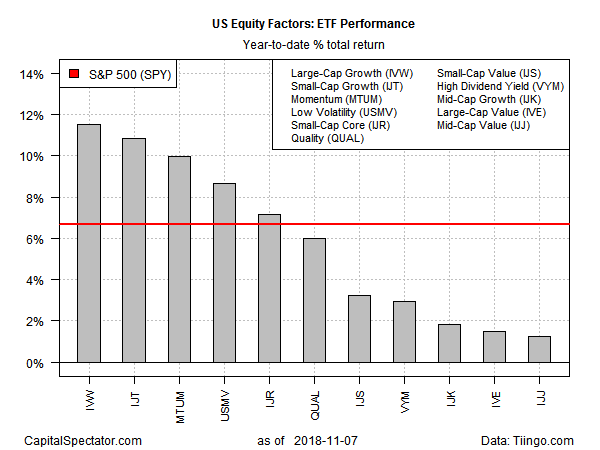
The sharp swings in the stock market in recent weeks haven’t dented the year-to-date performance edge that’s prevailed for large- and small-cap growth stocks in the US over their value counterparts, based on a set of exchange-traded funds through yesterday’s close (Nov. 7).

Large-cap growth still holds the lead for The Capital Spectator’s set of US equity factor ETFs so far in 2018. The iShares S&P 500 Growth (IVW) is up a strong 11.5% year to date. Running slightly behind in second place is iShares S&P Small-Cap 600 Growth (IJT), which is ahead by 10.9% so far in 2018.

Value, by comparison, is far behind in this year’s equity factor horse race. Dead last for year-to-date results at the moment: iShares S&P Mid-Cap 400 Value (IJJ), currently posting a slight 1.3 gain. The second-weakest performance this year: iShares S&P 500 Value (IVE), which is ahead by 1.5%.

Meanwhile, the broad market this year is up 6.7%, based on the SPDR S&P 500 (SPY).

The Capital Spectator
https://www.capitalspectator.com/growth-continues-to-crush-value-this-year-for-us-equity-factors/

Continue reading →

Be Sure to Vote Today, Just Not With Your Portfolio

I took my 18 year old daughter to vote for the first time today in the greatest country in the world.

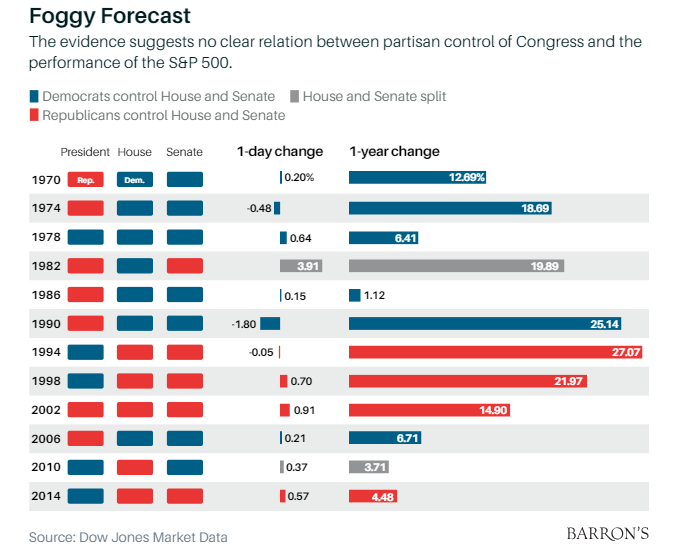
Markets don’t create losses, people do through emotional decisions at precisely the wrong times. There is nothing that generates more emotion than politics especially in 2018 with the events of the past month. Unfortunately, I have bad news for heavily partisan readers, the economic cycle is much bigger than either political party so predicting market returns based on election results will have a negative effect on your long-term returns.

There is only one thing that mid-term elections guarantee, short-term volatility that should be totally ignored by long-term investors. If you are a wild partisan person who is sitting on the edge of your chair at midnight waiting for results, that’s OK just get mentally prepared to avoid watching your portfolio at all costs.

Zero Evidence Between Partisan Control of Congress and Performance in S&P

Source

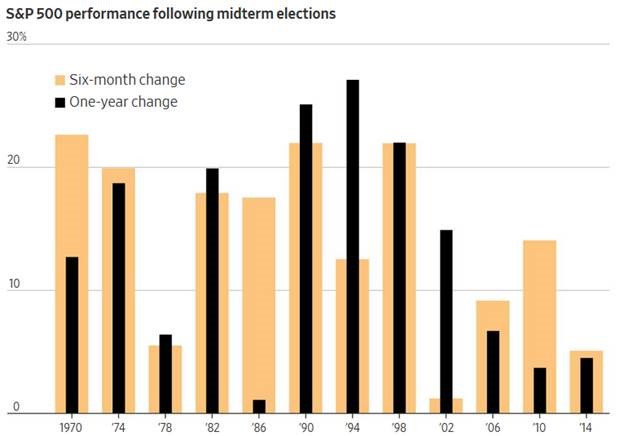
History suggests the stock market will fare well no matter who wins on Nov. 6.

The S&P 500 has risen in the year after every midterm election since 1946 – Buy, sell or hold: Ten ways to trade the U.S. election (Reuters) From Dave Lutz at Jones Trading.

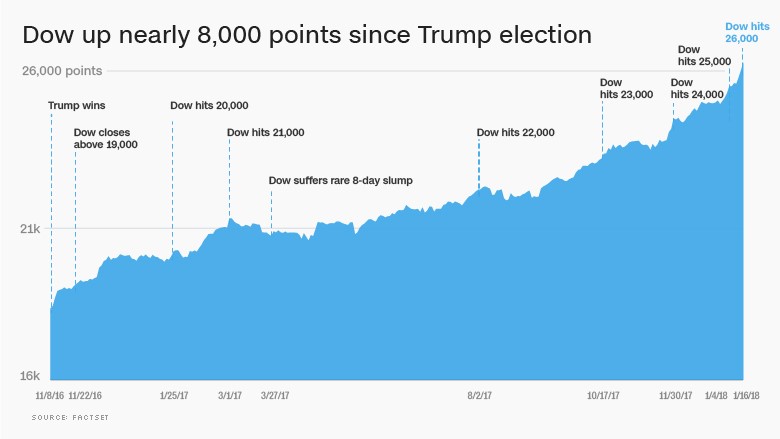
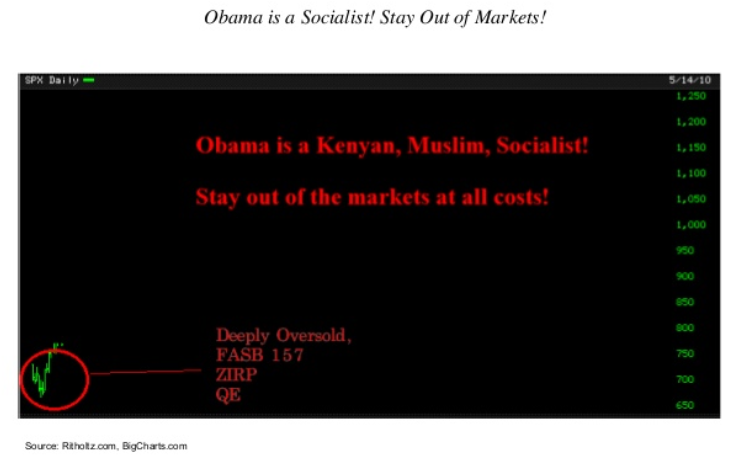
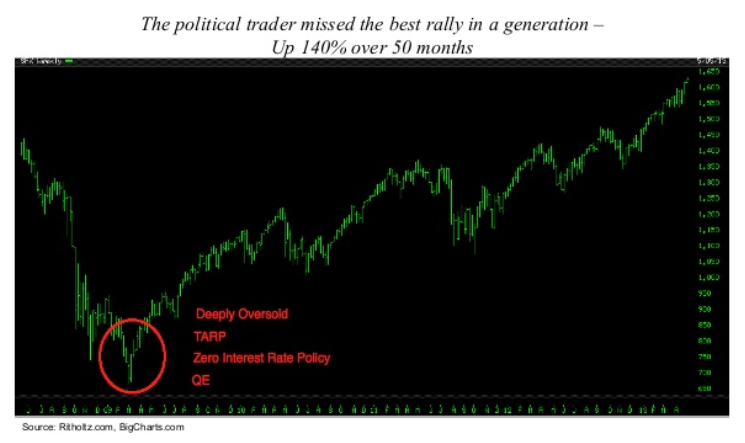
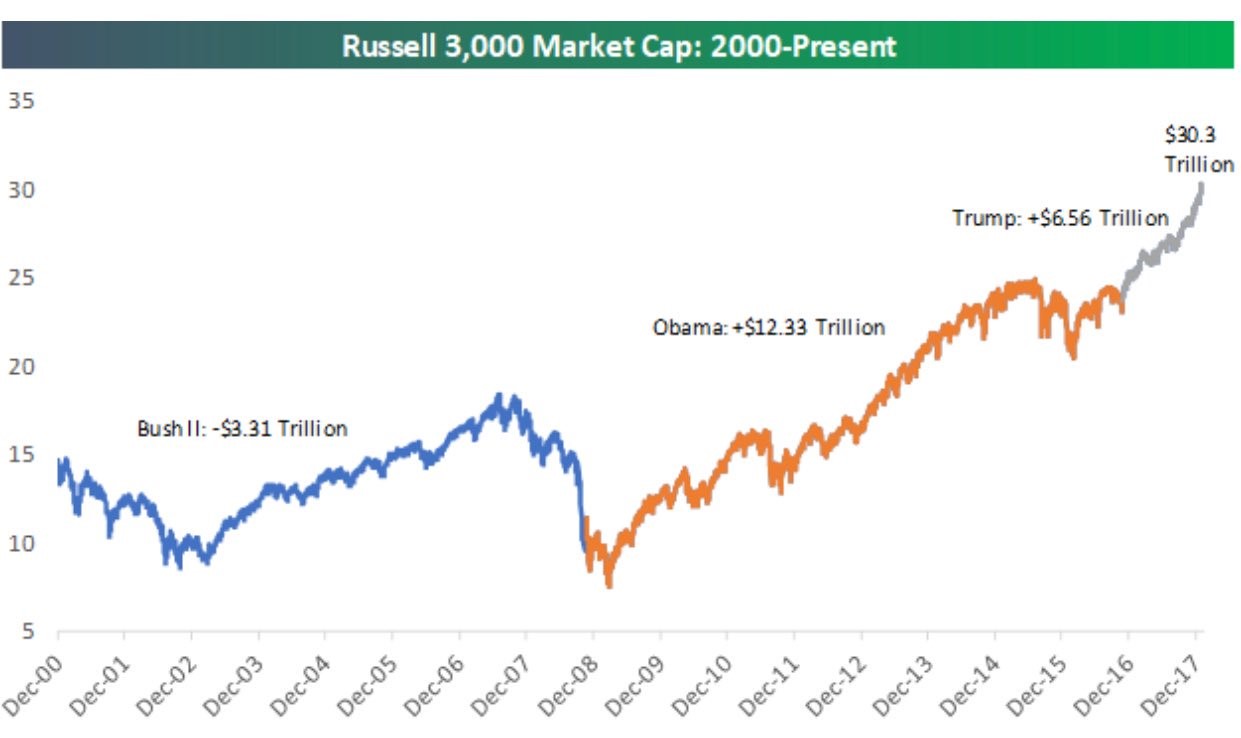
Predictions Around Recent Presidential Elections …Uhhh ! Not So Good.

If Trump is Elected The Market Will Crash

Source

If Obama is Elected The Market Will Crash

Source

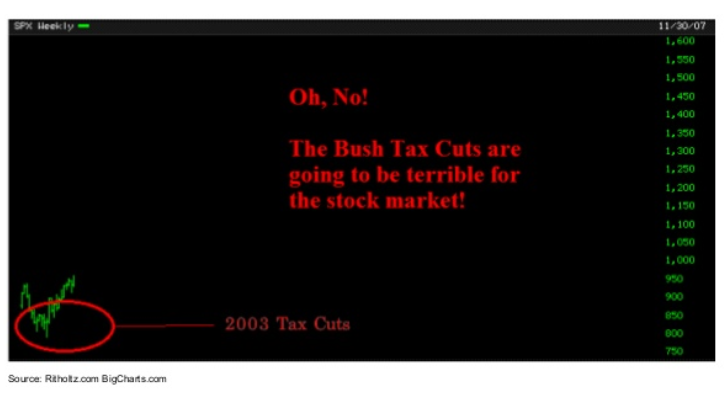
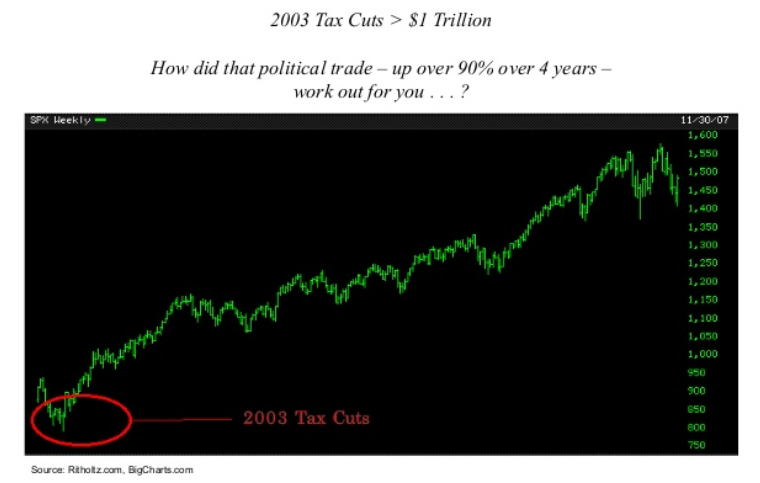
If Bush II Tax Cuts Pass The Market Will Crash

Source

The economic cycle is bigger than any President.

Source

Topley’s Top Ten – November 5, 2018

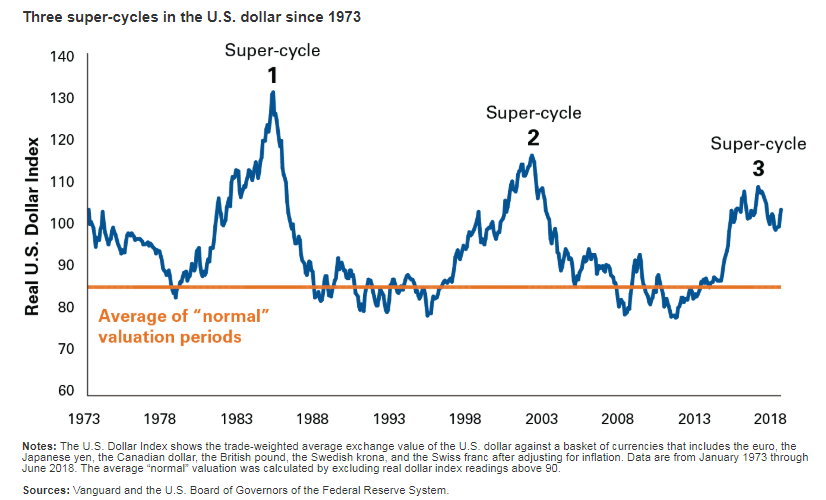
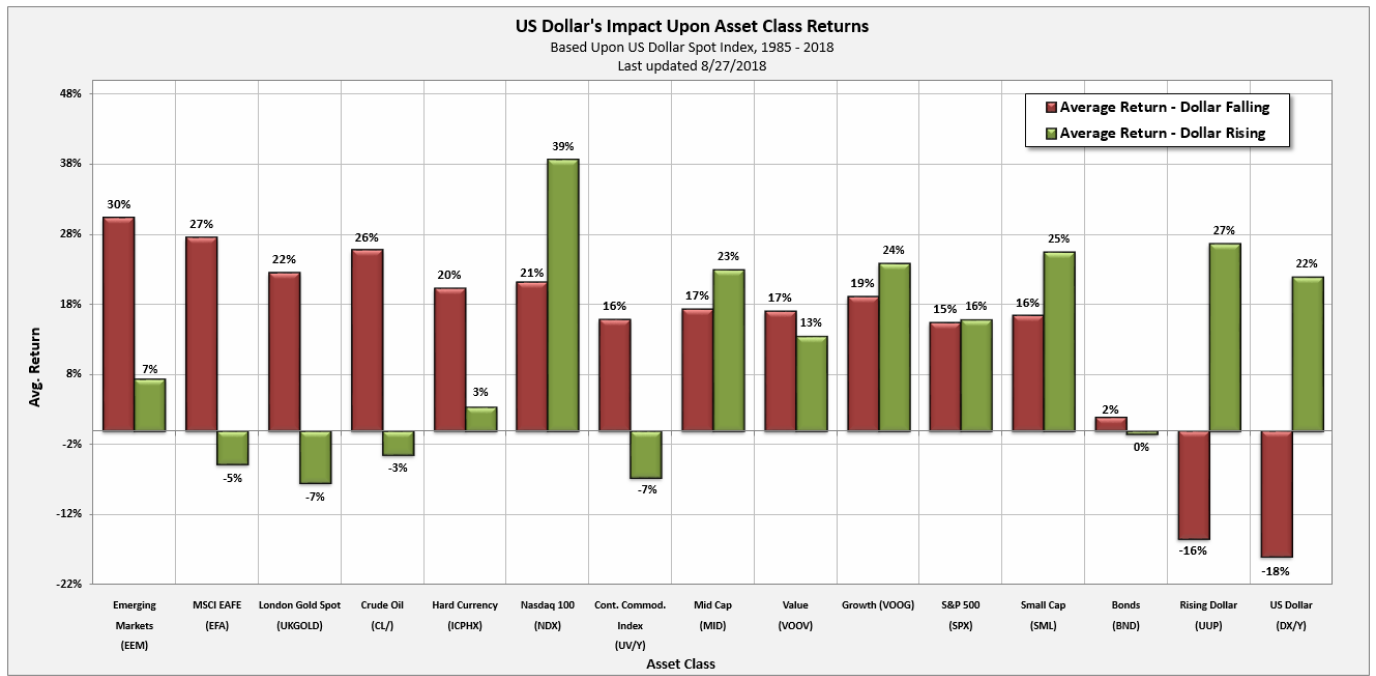
1.We are in Third Dollar Super Cycle Since 1973

Vanguard.

If past is prologue, the dollar will weaken

We can therefore expect the dollar super-cycle to come to a close over the next few years. Here are 4 fundamental factors, not mutually exclusive, that I’ll be watching for:

  1. Narrower growth differentials between the U.S. and other countries.The U.S. economy is much further along in the business cycle than other developed markets are, its labor market is much tighter, and inflation is much closer to the central bank’s target, which in the U.S. is 2%. Since economic growth normally slows late in the cycle, current growth differentials between the U.S. and other economies are expected to shrink. The next slowdown in the U.S. may be exacerbated when the recent fiscal stimulus wears off. We estimate that the stimulus, injected through the tax cuts and spending bill enacted at the beginning of the year, will deliver an extra push to U.S. economic growth of about 40 basis points this year and next.
  2. Higher U.S. bond yields, but narrowing interest rate differentials. Higher bond yields in the U.S. today imply depreciation in the U.S. dollar relative to other major currencies in the future. This market expectation may come to pass in the current global monetary cycle as the gap in rates between the U.S. and other major markets narrows. The Fed may stop raising rates as soon as 2019 while other central banks (notably the European Central Bank and the Bank of England) continue to play catch-up.
  3. Higher inflation in the U.S.Higher inflation in the U.S. relative to other developed markets could put downward pressure on the nominal U.S. dollar exchange rate.
  4. A larger U.S. trade deficit.For all the noise about tariffs and trade deficits, the natural way for trade imbalances to correct over time is through market-driven currency adjustments. Widening U.S. trade deficits translate into higher demand for foreign currency (to pay for the additional imports), which exerts downward pressure on the dollar. The trade deficits themselves are caused in part by rising government budget  shortfalls, which spill over to more foreign purchases of U.S. debt, and in part by strong U.S. consumer spending, which, bolstered by tax cuts, results in more purchases of imported goods, given that they constitute about 18% of the typical consumer basket.

What’s behind the latest surge in the dollar?Roger Aliaga-Diaz

https://vanguardblog.com/2018/09/04/whats-behind-the-latest-surge-in-the-dollar/

Continue reading →

Topley’s Top Ten – October 29, 2018

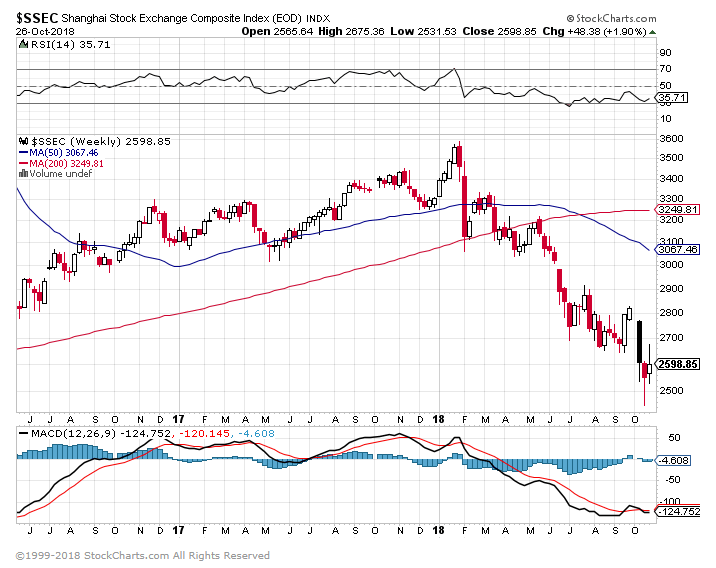
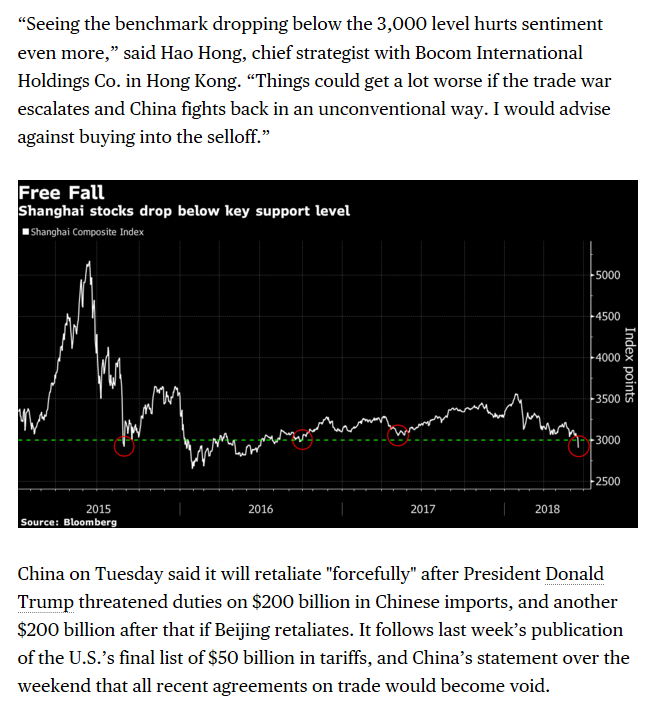
1.Shanghai Composite Down $3 Trillion in Market Cap…Back to 2008 Levels.

China’s economy has grown in size 34.5 times, or an average of 9.5% a year, in the 40 years since the nation started producing modern economic statistics. It has never experienced a year of economic decline.
https://www.barrons.com/articles/the-tariff-battle-wont-dent-chinas-economy-or-americas-1540588257

Shanghai Stock Exchange Composite Back to 2008 Levels.

www.stockcharts.com

Continue reading →

Topley’s Top Ten – October 19, 2018

1.Great Read on Bond Bear Markets.

The Worst Kind of Bear Market

Posted October 16, 2018 by Ben Carlson

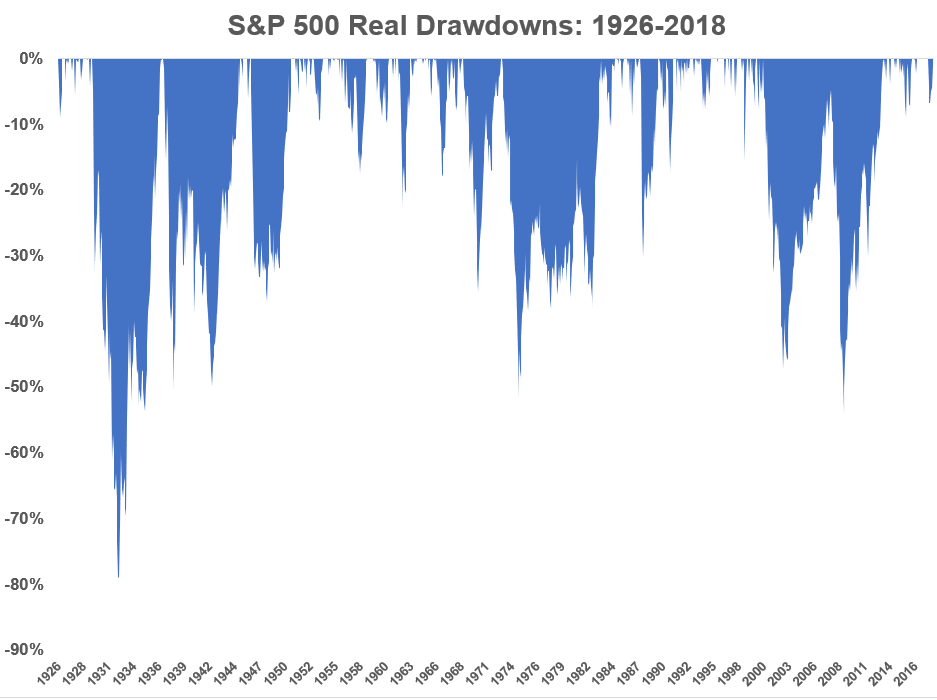
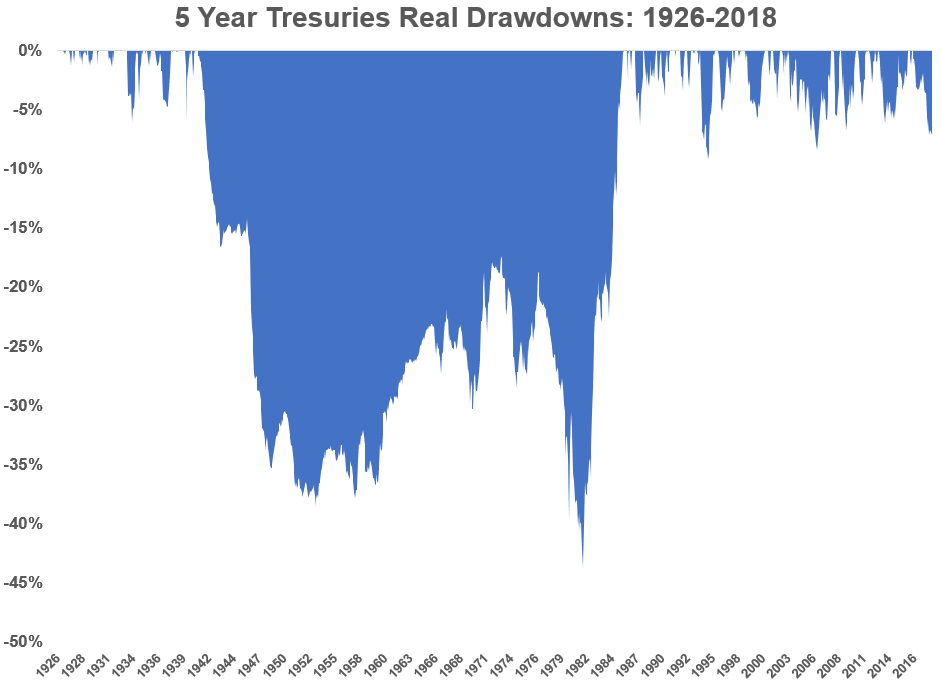
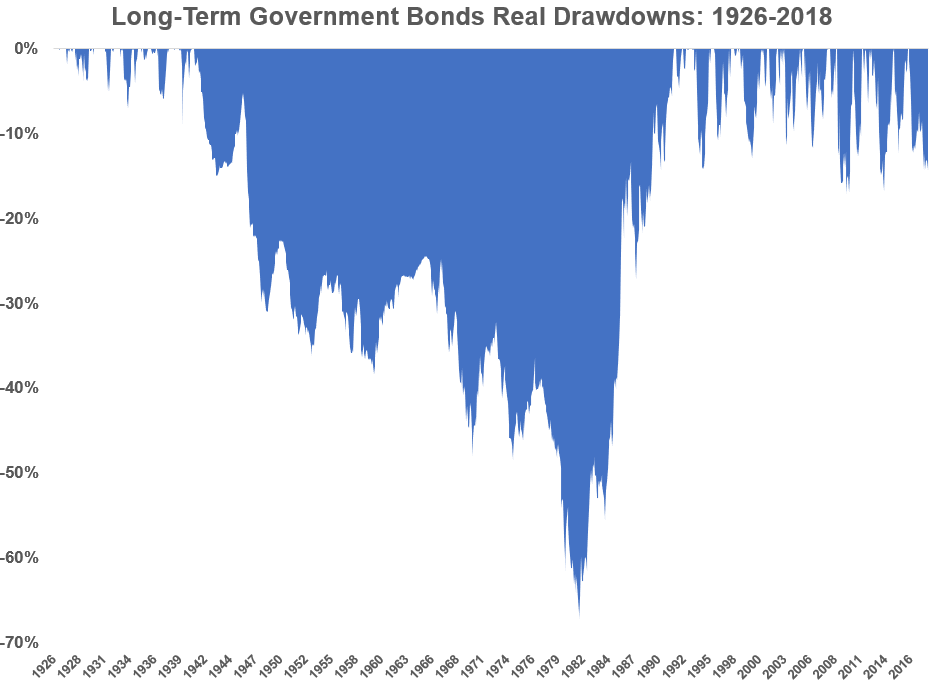
On a recent episode of his show, Behind the Markets, WisdomTree’s Jeremy Schwartz made a comment about a stat from one of Jeremy Seigel’s books. He discussed how in real terms, bonds in the U.S. have actually experienced a much longer bear market than anything witnessed in the stock market.

This makes sense when you realize the biggest risk for stock market investors is generally a crash while the biggest risk for bond market investors is sky-high inflation.

I decided to run the numbers to put some more meat on the bones of this one to gauge the length of bear markets in both stocks and bonds on an after-inflation basis.

This is the historical real drawdown chart for the S&P 500:

I didn’t know which route to choose for a bond proxy so I decided to look at both 5-year treasuries and long-term treasuries. Here’s the chart for the 5-year bond:

And these were the drawdowns for long-term bonds:

Here’s what the stats look like for the longest bear markets for each since 1926:1

https://awealthofcommonsense.com/2018/10/the-worst-kind-of-bear-market/ Continue reading →

Topley’s Top Ten – October 17, 2018

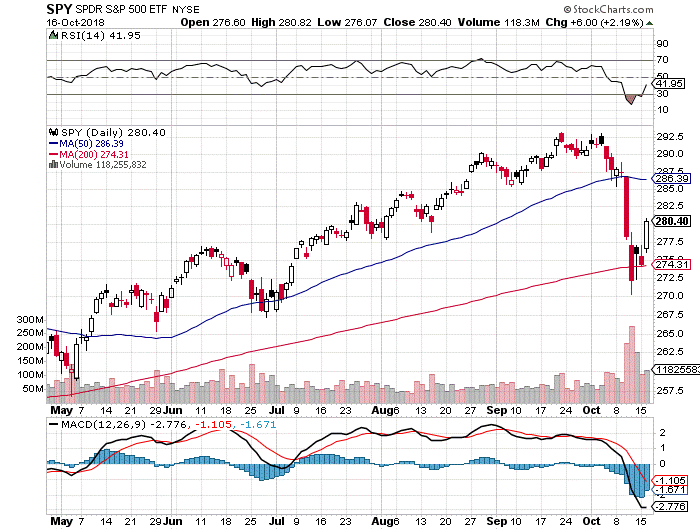
1.S&P Bounces at 200 Day….250 Names Were Down 20% or More in this Correction.

Here are some interesting numbers about the S&P 500, according to data provided by FactSet.

  • Among the S&P 500, 250 stocks were down 20% or more from their all-time closing highs (adjusted for splits and spin-offs) as of the close on Oct. 15.
  • 162 were down at least 30% from their all-time highs.
  • 113 were down at least 40% from their all-time highs.
  • 69 were down at least 50% from their all-time highs.

You may be surprised at how many S&P 500 stocks have fallen at least 50% from record highs

Philip van Doorn

https://www.marketwatch.com/topics/journalists/philip-van-doorn

SPY bounce at 200 day

www.stockcharts.com

  Continue reading →

Topley’s Top Ten – October 15, 2018

1.Volatility Very Normal in October.

Thoughts on the Market Sell-Off

Posted by lplresearch

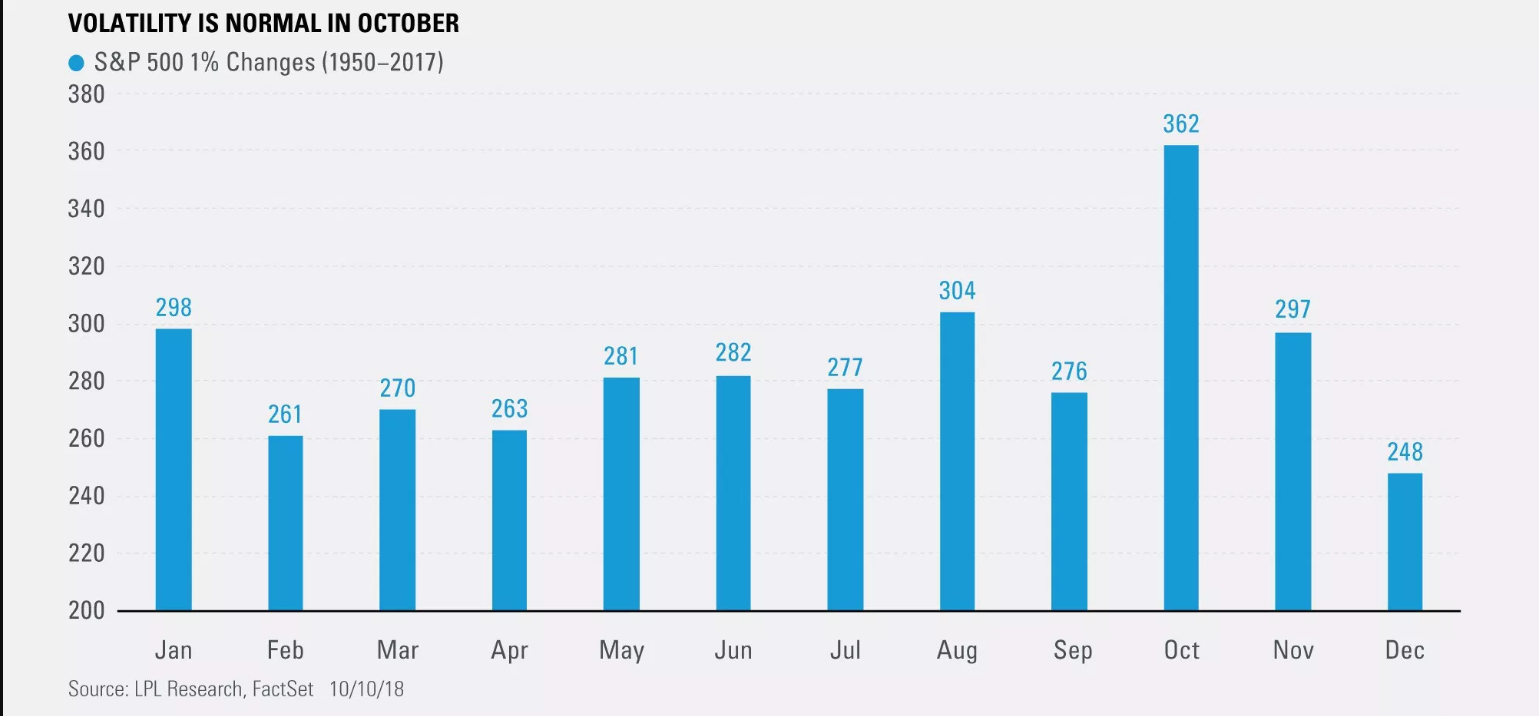
  • The S&P 500 Index had one of its least volatile third quarters in history.In fact, it was the first year since 1963 that the index’s usually volatile third quarter didn’t have a single 1% change (up or down). The S&P 500 had gone 74 consecutive days without a 1% move—the 10th longest streak in history. The bottom line is: Equity markets were wound tight and some type of volatility was likely.
  • October has historically had above-average volatility and average returns.October is known for spectacular crashes (1929, 1987, and 2008), but in reality it’s about average in terms of returns. What it really should be known for is volatility. Incredibly, no month has seen more 1% changes (up or down) than the month of October for the S&P 500 going back to 1950.

https://lplresearch.com/2018/10/11/thoughts-on-the-market-sell-off/

Continue reading →

Topley’s Top Ten – October 10, 2018

1.Interesting Comments on Market Breath….Narrow Leadership.

Average Small Cap Stock in “Bear Market” Territory

Oct 9, 2018

Most people watching have noticed that the recent weakness in equities has been especially tough on the small-cap space, and another illustration of that trend is to look at the distance that stocks are currently trading from their 52-week highs.  Within the large-cap S&P 500, the average stock is currently 13.2% below its 52-week high.  Moving down the market cap spectrum, though, the numbers get progressively worse.  In the S&P 400 mid-cap space, the average spread is 16.9%, while members of the S&P 600 Small Cap index are down an average of 20.7%.  Using the standard bear market definition of a 20% decline from a high, the average small-cap stock is in a bear market!

Looking at the spreads between current prices and 52-week highs, stocks in the Consumer Discretionary sector are further from their highs than any other sector (-22.9%), but Technology isn’t far behind at 21.4%.  For two sectors that were market leaders, Tech and Discretionary have certainly seen a good deal of profit-taking lately.  Outside of these two, other sectors where the ‘average’ stock has seen a pretty sizable pullback from its 52-week high include Materials (-19.8%), Health Care (-17.9%), and Consumer Staples (-16.6%).  On the other end of the spectrum, Utilities (-6.1%) is the only sector where stocks are currently down by an average of less than 10% from their 52-week highs.

https://www.bespokepremium.com/think-big-blog/

Continue reading →

Topley’s Top Ten – October 3, 2018

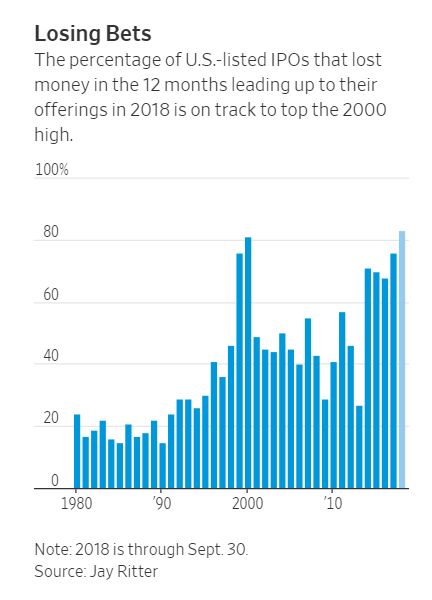
1.More Money Losing IPOs than 2000. 

Stock investors are welcoming money-losing companies into the public markets this year with open arms.

About 83% of U.S.-listed initial public offerings in 2018’s first three quarters involve companies that lost money in the 12 months leading up to their debut, according to data compiled by University of Florida finance professor Jay Ritter. That is the highest proportion on record, according to Mr. Ritter, an IPO expert whose data goes back to 1980.

IPO Market Has Never Been This Forgiving to Money-Losing Firms

Money-losing companies are going public at a record rate as investors hunger for new issues

https://www.wsj.com/articles/red-ink-floods-ipo-market-1538388000?tesla=y

Continue reading →

Topley’s Top Ten – September 27, 2018

1.Nasdaq Up 9 Quarters in a Row…Again

Sep 26, 2018

The Nasdaq Composite is set to finish higher for the 9th consecutive quarter when exchanges close this Friday, September 28th.  (With a QTD gain of more than 6%, it would take a dramatic plunge over the next two trading days for the quarter to end in the red.)

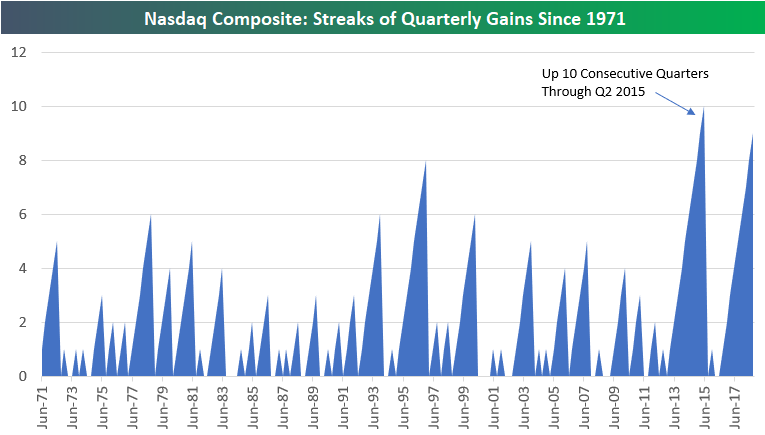
Below is a chart showing streaks of quarterly gains for the Nasdaq Composite since its inception in 1971.

Nine quarters of gains is not quite the longest streak on record, and it’s not even the longest streak of the last six years!  The longest stretch of quarterly gains made it to ten from Q1 2013 through Q2 2015.  Prior to that, the record was 8 quarters back in the mid-1990s (Q1 1995 through Q4 1996).  Not even during the Dot Com boom of the late 1990s did we see such consistency of gains for the Nasdaq.

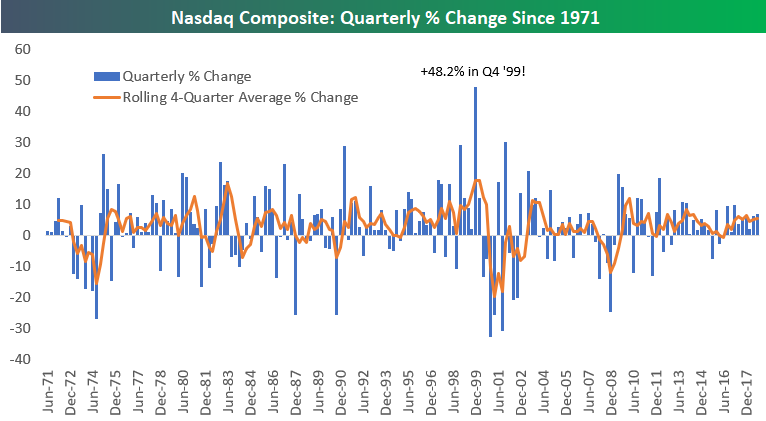
While the Nasdaq has been more consistent to the upside during this bull market than it was during its epic late-1990s rally, the size of the quarterly gains seen this time around don’t come close to matching the rallies seen back then.  In the chart below, we show the quarterly price change for the Nasdaq going back to 1971.  Yes, we’ve seen very nice quarterly gains of 5-10% many times during the current bull, but from 1997 through Q1 2000, the Nasdaq posted seven double-digit quarterly percentage gains, including a gain of 29.5% in Q4 1998 and a ridiculous 48.2% gain in Q4 1999.  This period is nothing like the 1990s.


https://www.bespokepremium.com/think-big-blog/nasdaq-up-9-quarters-in-a-row-again/?utm_source=sumome&utm_medium=linkedin&utm_campaign=sumome_share

Continue reading →

Topley’s Top Ten – September 24, 2018

1.Presidential Cycle Seasonality

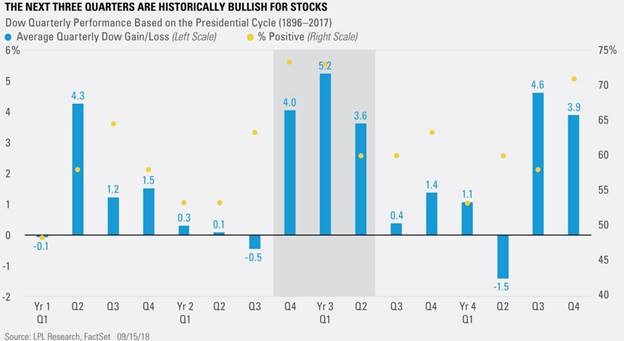
LPL notes the next three quarters are historically some of the strongest out of the entire four-year presidential cycle – “going all the way back to when the Dow started trading in 1896, each of the next two quarters have closed higher 73.3% of the time—no other quarter is up more often. In addition, the average returns over the next three quarters have been 4.0%, 5.2%, and 3.6%—again some of the strongest in the four-year cycle”

From Dave Lutz at Jones.

Continue reading →

12 Questions That Will Change Your Financial Life

How well do you really know yourself and your relationship with money?

by Matt Topley

Key Takeaways

  • When it comes to your money outlook, you tend to be influenced by the five people you spend the most time with.
  • Commit to being a lifelong learner about personal finance and personal fulfillment. There’s a strong correlation between the two.
  • Don’t let your emotions get in the way of a sound financial plan—or life plan.
  • Be brutally honest with yourself about what’s most important in life. Eliminate distractions that prevent you from putting your energies where they truly belong.

Going through my summer reading pile the other day, I came across a great article by Ryan Holiday, called “12 Questions That Will Change Your Life.” Holiday, author of the best-selling book Ego is the Enemy, wrote 12 Questions for a general audience, but I’ve found they can be applied to investing, wealth accumulation and wealth preservation, too. You don’t have to read these provocative questions in order, but do yourself a favor and give each one some thought:

Q1. Who do you spend your time with? According to motivational speaker and business guru, Jim Rohn, we are the average of the five people we spend the most time with.

It’s been proven time and time again that people are the product of their environment. If you spend your time around people who constantly complain about money, who degrade rich people, who see money as the root of all evil or who will do anything to avoid a conversation about finances, then you’ll have a lower probability of growing your wealth than if you spend your time surrounded by people who have a healthy relationship with money.

That doesn’t mean you have to champion the “Greed is Good” philosophy made famous by Michael Douglas in the 1987 classic “Wall Street.” But, think about your closest friends and colleagues. Do they seem to have a positive relationship with money?  Do they inspire you to grow your net worth and pursue financial freedom by way of example? On the other hand, if your closest friends and colleagues are willing to accept an unhappy financial lifestyle, they will most likely endure an unfulfilling family and work life.

Q2. What does your ideal day look like?  One of the biggest benefits of financial freedom is that you can live your life on your terms—not on someone else’s terms. But if you don’t know what your ideal day looks like (both a workday and a weekend day), then how do you expect to experience it on a regular basis?  It’s important to take inventory of your financial life.  One of the best ways to do that is to spend a few hours a week increasing your financial literacy. It’s not about learning how to be a better stock picker. It’s about learning how to boost your career skills or starting a side business that can substantially boost your income.

Before diving in, it’s important to know how you learn best. Do you learn best by reading, by listening or by watching?  Whichever channels works best for you, spend an hour a day on it building your career skills and financial literacy.  Surely it’s worth devoting 60 minutes a day to something that will lower your stress and increase your pursuit of self-actualization.

READ: Barron’s, Wall Street Journal and Topley’s Top 10 blog.
LISTEN TO: Behind the Markets (Wharton Business Radio) and Barry Ritholtz’s Masters in Business podcast (Bloomberg)

Q3. To Be Or To Do?  Legendary Air Force colonel, John Boyd, used to ask trainees: “To be or to do? Which way will you go?”  Boyd wanted to know if the new recruits would be focused on the pursuit of success or choose to focus on a higher purpose?

The goal of financial freedom is not to acquire big houses, fast cars or expensive bling. It’s about acquiring the freedom of time so you can enjoy life and pursue a higher purpose. Finding a higher purpose takes time and contemplation. If you are just scrambling to pay bills all the time, you are not in a position to be thinking about your higher purpose in life. The stress hormone cortisol is public health enemy No. 1 and research shows that a sizeable percentage of Americans suffer from financial anxiety (see Question 12). Real tangible accomplishments happen only when your thinking is sharp and free of stress and distractions.

Q4. If I Am Not For Me, Who Is?  If I Am Only For Me, Who Am I? The alternative translation of that last part is “If I am only for me, what am I?”  The answer is “the worst.”  It doesn’t make you a bad person to want to be remembered, or climb to the top of your profession, or focus intensely on providing well for yourself and your family.  But, if this is ALL you want from life, then that’s a problem. Many successful people have strong gos and are driven by self-interest, pride, dignity and ambition–but they temper those traits with a sense of humility and selflessness.

Warren Buffett, no stranger to success, said that “Investing is not a game where the guy with the 160 IQ beats the guy with the 130 IQ. Once you have ordinary intelligence, what you need is the temperament to control the urges that get other people into trouble in investing.”

I love Buffet’s quote and recently wrote a paper based on it (Investing Is a Psychology Game, Not an IQ Game). If you’re not careful, ego can be your greatest enemy in both investing and in life. Temper your investing life with a sense of humility and simplicity. This will give you the time and money for selflessness. Improving your personal financial life give you the time and money to change the world in a way that is most meaningful to you.

Q5. What Am I Missing By Choosing To Worry or Be Afraid? In his book, The Gift of Fear, Gavin de Becker suggests that when you worry, you should ask yourself: “What am I choosing NOT to see right now?”  What important things am I missing because I choose worry over introspection, alertness or wisdom?”

Obstacles in our financial lives make us emotional. The inability to keep our emotions in check is what often destroys net worth and can lead to fractured personal relationships and stunted careers.

Don’t let the stock market’s fickle gyrations fool you into making bad decisions. Don’t let Wall Street pundits and the financial media scare you with attention grabbing headlines.

When it comes to investing, things are never calm for long. Over the past 70 years, the S&P 500 Index has experienced twelve separate corrections of at least 20 percent. That’s an enormous amount of wealth wiped out in a relatively short time. But despite those frightening reversals, the index has gained a stunning 15,000 percent over that seven-decade time frame. Those who stayed invested and who didn’t try to get in and out of the markets have been handsomely rewarded for their discipline.

Meanwhile the average U.S. investor is barely keeping up with inflation (Sources: Richard Bernstein Advisors LLC, Bloomberg, MSCI, etc.). Why is it so hard for individual investors to keep up with inflation, let alone the unmanaged market index? Because many make emotional decisions at the wrong time—again and again!

The Greek word “apatheia” refers to the equanimity one gains when you are free of irrational fear and extreme emotion. Apatheia is one of the keys to successful investing and paves the way to a state of flow in your personal financial life. A fulfilling life revolves around doing meaningful work and having meaningful relationships. A stressful personal financial situation can destroy your ability to enjoy your work and relationships.

Q6. Am I Doing My Job?  The last thing that legendary college basketball coach, John Wooden, said to his players in the locker room before every game was: “Men, I’ve done my job; the rest is up to you.”

You may not be part of an elite basketball program or Fortune 100 company, but ask yourself if you are really doing your job each and every day? Remember, you can be extremely busy—working to the point of exhaustion–and still not be doing your job. You cannot be the best at your job when you are scrambling to pay the bills, fighting with your spouse over money matters, or envying a co-worker you think is more financially successful than you are. To operate at your highest level for career advancement, you must be in a state of mental flow. This flow state can only be reached when distractions are kept at a minimum. A healthy financial plan will limit distractions from many areas of your life—not just the money ones.

Q7. What Is the Most Important Thing? If you don’t know what the most important thing in life to you is, then how do you know if you’re putting it first? If you have personal financial stress, you will never have time or mental energy to focus on what’s most important to you because you will be constantly distracted by the negative weight of your money burdens. However, once you put your financial house in order, you will develop the quiet confidence to succeed in all aspect of your life. Seneca, the ancient Roman philosopher called that quiet confidence “euthymia”– the belief that you’re on the right path and that you won’t be led astray by people who are hopelessly lost.

Q8. Who Is this for? It doesn’t matter if you’re making something, selling something or trying to reach people, you have to know who your audience is. Great speakers, great politicians and highly creative people tend to have a good sense of who their target audience is. So can you.

Creativity is the key to self-improvement and career growth. In order to be creative you need to generate a LOT of ideas. They won’t all be winners, but you need a clear mind and long periods of uninterrupted thinking time to come up with a diversified portfolio of potential ideas so you can consistently develop good ones. Clearing your mind of financial worries and other distractions is the key to getting into your flow state—a mindset in which you do your best thinking and achieve real breakthroughs.

Q9. Does this Actually Matter? Given the shortness of life, does this thing I’m thinking about, worrying about, fighting about, throwing myself into even matter?  Sadly the answer is usually no.

As Coach Wooden always told his players: “Learn as if you were to live forever; live as if you were to die tomorrow.”

If nothing else, don’t get stressed about short-term market volatility and the media hysteria around it. All that matters is your long term financial plan and preserving wealth for yourself, your family, your heirs and the causes you support. As get older, I realize more and more that money is simply a tool for making the most of our brief time on earth. Making money for the sake of making money’s will just keep you on the hamster wheel forever.

“You could leave life right now,” the second century Roman emperor, Marcus Aurelius reminded himself, “Let that determine what you do and say and think.”

Q10. Will This Be “Alive Time” or “Dead Time?” At the end of the day there are only two types of time: Dead Time and Alive Time. Dead Time is when we are just waiting and Alive Time is when we are learning and active.

Resist the temptation to get distracted by Wall Street pundits. Don’t let them sway you into chasing the next hot stock or sector. Don’t let them talk you into getting in (or out of) the markets at EXACTLY the wrong time (see danger of market timing in Question 5).

Case in point
: During a recent eight-day span, research found that the big three cable news networks had over 600 stock market pundits on the air—that’s about 75 different “talking heads” tugging at your ego and emotions every day. Behavioral finance research proves how hard it is to predict markets accurately, but still we are exposed to thousands of gurus a month through conventional and social media. Use your Alive Time to become a smarter investor, to get better at your profession, to become a better parent, to read and to exercise regularly. Don’t allow your Alive Time to become Dead Time by trying to predict the unpredictable (think weather, stock market, natural disasters or traffic accidents, etc.).

Q11. Is this Who I Want To Be? Our minds have a unique ability to make the distinction between what we do and who we are. The problem is you can’t be a good person if your actions are consistently bad. People make bad decisions when they’re under fiscal duress, often falling into what we call “the triangle of corruption:
Need + Justification + Opportunity.

Unfortunately, sociopaths aside, the triangle is where people get themselves into trouble. By keeping your financial house in order, you can prevent the triangle from swallowing you up. You are what you do. Regardless of what you happen to be doing, always ask yourself, “Is this reflective of the person I want to be?”

Q12. Man’s Search for Meaning. Viktor Frankl, a renowned Austrian neurologist and Holocaust survivor, said life demands that we always answer the question, “What Is the Meaning of Life?” He said we answer that existential question with our actions and decisions.

After examining 65 studies on debt and mental health, researchers from the University of South Hampton concluded that people in debt are three times as likely as those who are debt-free to have a mental health problems. Those problems can range from drug and alcohol dependence, to depression, anxiety disorders and psychotic disorders. That’s a scary statistic considering that more than one-third of Americans have delinquent debt according to the Urban Institute.

Conclusion

Surround yourself with people who have a positive outlook on life and a healthy relationship with money. Control what you can control and let everything else go. Finally, if you are to find the meaning of life in your actions and decisions, then debt and financial worries are clearly things to avoid at all costs.

Topley’s Top Ten – September 20, 2018

1.Bitcoin Speculators Switch to Weed.

https://www.marketwatch.com/

I Started My Trading Career in 1997 So Witnessed the Internet Bubble First Hand….This is Textbook 1999 CEO Interview on Jim Cramer…Stock Spikes 90% and Gets Held 5 x in One Day….Bigger Market Cap than General Mills

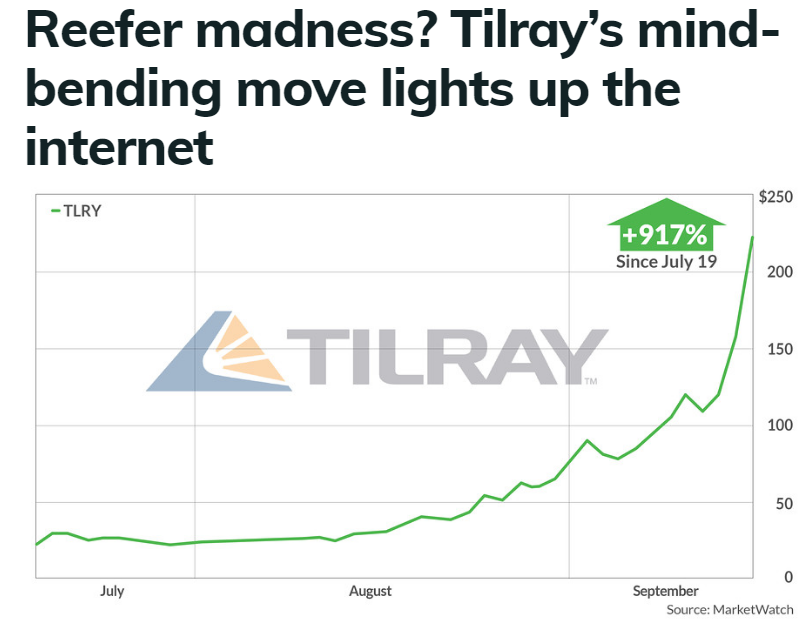
Tilray’s Wild, Wild Day

If you didn’t know about Tilray before, you definitely do now.

Earlier this week, the Canadian marijuana producer earned approval from the U.S. government to import medicinal cannabis into the U.S. for clinical trials. On Tuesday night, Tilray CEO Brendan Kennedy gave a chest-thumping interview to Jim Cramer.

Then, all hell broke loose.

Yesterday, shares skyrocketed ~90% before erasing most of those gains and briefly dipping into the red. Couple notes:

  • The stock was halted from trading five times by Nasdaq due to volatility.
  • It ended up 38% for its best day yet as a public company.

Clearly, Tilray has the munchies

During its mega-surge, Tilray at one point yesterday had gobbled up the market cap of food conglomerate General Mills.

Bottom line: Tilray finished the trading day bigger than American Airlines and Clorox, with a market cap close to $20 billion. Look out, Apple. Someone’s coming for that $1 trillion crown.

https://www.morningbrew.com/

Continue reading →

Topley’s Top Ten – September 18, 2018 (Short Version)

1.Zero Volatility in Market.

S&P 500 Average Daily Change Down to +/-0.40%

Sep 17, 2018

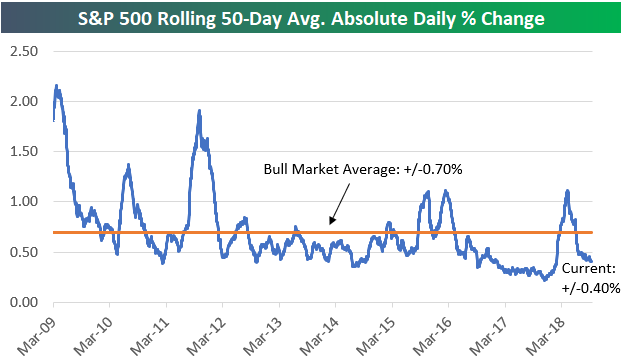
2017 was one of the least volatile years ever for the US equity market.  The S&P 500 averaged an absolute daily change of just 0.30% last year.

Due to a pick-up in volatility during the S&P’s correction in the first quarter, the average absolute daily change for the index is more elevated this year at +/-0.64%, but more recently we’ve seen a pretty big drop in the action.  As shown in the chart below, the S&P has averaged an absolute change of just +/-0.40% over the last 50 trading days, which is well below the average of 0.70% seen throughout the current bull market.

From a seasonal perspective, September and October have historically been the most volatile months of the trading year, but so far this September, the S&P has averaged a daily move of less than 0.24%.  It’s starting to feel like 2017 all over again!

https://www.bespokepremium.com/think-big-blog/

Continue reading →

Topley’s Top Ten – September 7, 2018

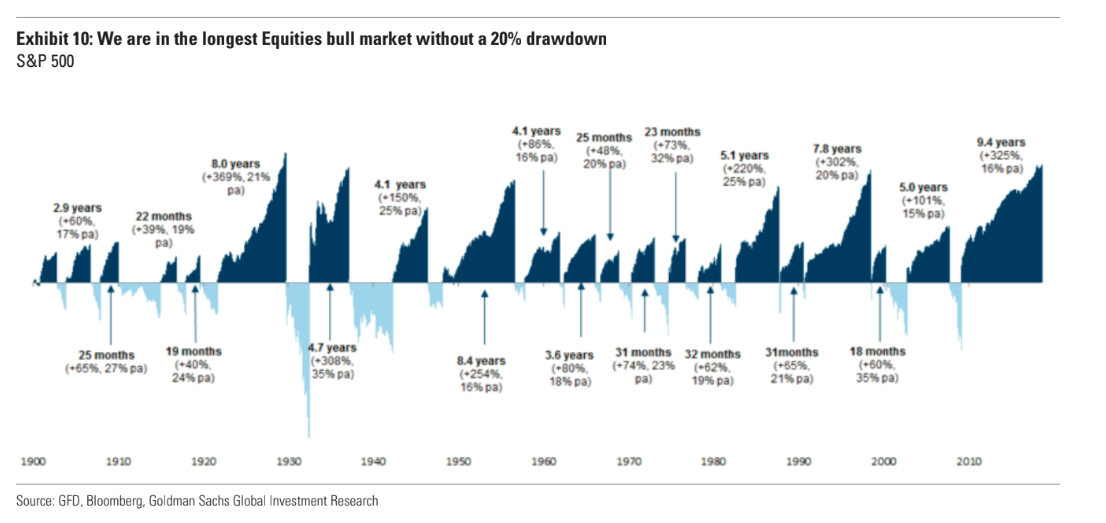
1.Longest Equity Bull Ever Without 20% Correction.

A 20% decline for the market, representing the typical definition of a bear market for an asset, hasn’t occurred in years (see chart below), according to Goldman, and may be halting for investors that have grown accustomed to this current phase of mostly levitating markets.

A stock-market bear signal is at a more-than-4-decade high, says Goldman
Mark DeCambre
https://www.marketwatch.com/story/a-stock-market-bear-signal-is-at-a-more-than-4-decade-high-says-goldman-2018-09-06

Continue reading →

Topley’s Top Ten – September 4, 2018

1.Momentum Continues to Lead…Winners Keep Winning.

August a Continuation of Trend

Aug 31, 2018

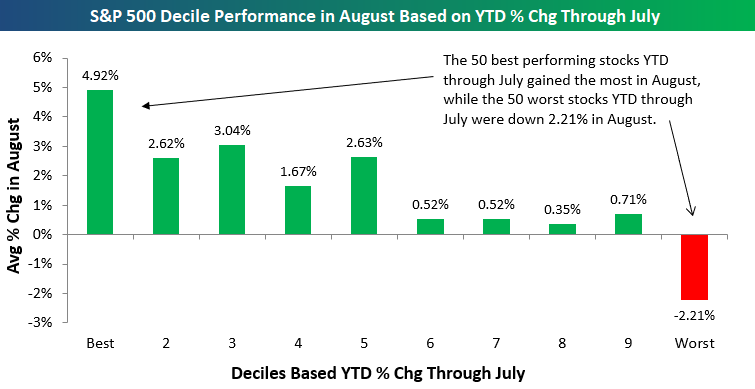
Below we show our decile analysis of S&P 500 gains in August. To construct these analyses, we show how each 10% bucket of stocks in the S&P 500 (50 per bucket) by a given metric performs. In this example, we’ve broken the S&P 500 into deciles based on their percentage change in the first 7 months of the year through July. Over the course of August, performance in the other 7 months was highly correlated to performance this month. As shown in the chart below, the 50 best performing stocks YTD through July were up almost 5% in August, with the 2nd through 5th deciles also performing quite well. The bottom half of the market in terms of YTD performance through July generally didn’t do as well in August. That was most true for the 50 stocks that performed the worst through July, which dropped on average 2.2% in the month of August. Owning winners is often derided by contrarians as a way to underperform, but the decile analysis below is one example of momentum begetting more momentum in financial markets.

https://www.bespokepremium.com/think-big-blog/

Continue reading →

Topley’s Top Ten – August 28, 2018

1.New Highs are Bullish and Long Waits Between New Highs More Bullish.

Finally

Posted by lplresearch

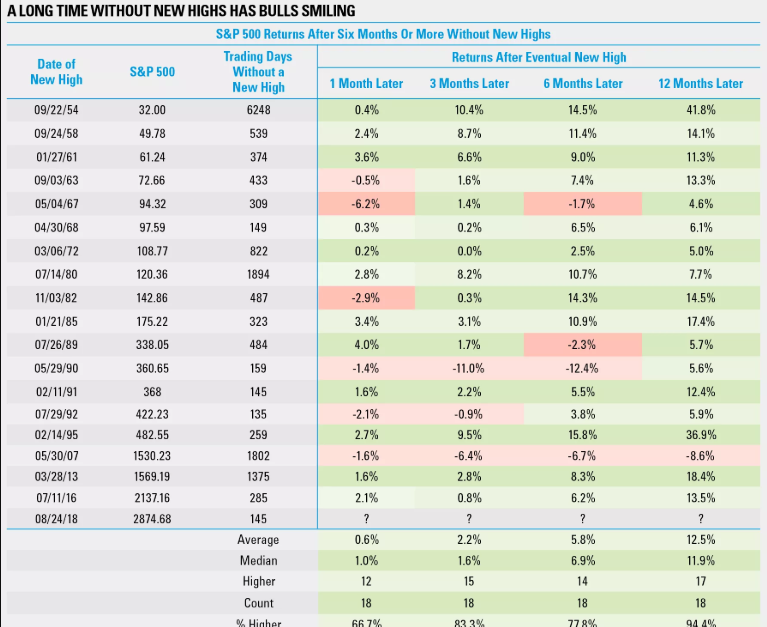
It took nearly seven months, but the S&P 500 Index finally closed at a new all-time high on Friday. Many clues along the way suggested new highs could eventually come, like strong overall market breadth and excellent earnings growth. Still, the big question now is, what happens next?

“Investors have been patiently waiting for new highs in the S&P 500, even while small caps and technology have been making new highs for months now. Here’s the good news: When the S&P 500 has gone at least six months without a new high, the index has been higher a year after the next new high in 17 out of the past 18 instances, going back to 1950,” explained Senior Market Strategist Ryan Detrick.

As our LPL Chart of the Day shows, long waits between new highs tend to foreshadow strong outperformance in the subsequent year.

https://lplresearch.com/2018/08/27/finally/#more-10551

Continue reading →

Topley’s Top Ten – August 27, 2018

1.Small Mid and Large Hit New Highs..

The Interminable Bull

U.S. Investment Policy Committee Notes
by CFRA

Aug. 22: In a classic example of ignoring the headlines and focusing on the bottom line, investors brushed aside seemingly damaging political outcomes and pushed the S&P 500 not only to a record duration, but also a new intraday, all-time high. The question du jour is now, “How long?”

We think bull markets don’t die of old age, they die of fright and are most afraid of recession. However, we don’t see a recession on the horizon, since the global economy is expected to maintain its upward growth trajectory, interest rates and inflation are projected to stay low, and S&P 500 profits are seen adding 10% in 2019 to the near-23% 2018 growth forecast.

Besides, history shows that after a trifecta of all-time highs for the S&P 500, MidCap 400, and SmallCap 600, the 500 was higher in price by an average of 4.8% six months later and up 77% of the time versus the average gain of 4.5%. During all rolling six-month periods, it was up 73% of the time.

–Sam Stovall

www.stockcharts.com

Continue reading →

Topley’s Top Ten – August 22, 2018

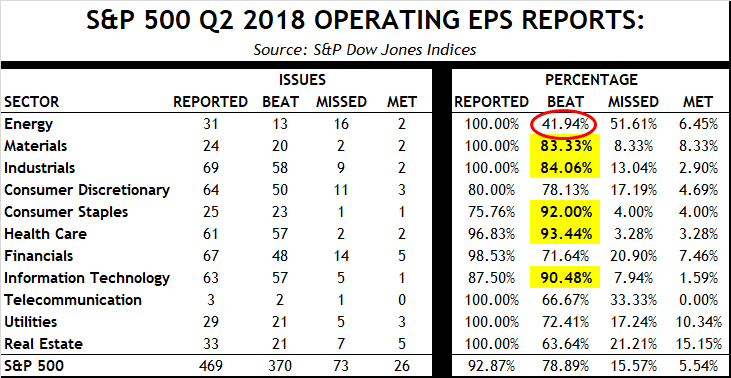
1.Earnings..Highest Beat Rate and Lowest Miss Rate in 5 Years.

Meanwhile, U.S. based investors continue to benefit from rising corporate earnings.  As of August 16th, 469 of the S&P 500 Index companies have reported Q2 earnings, of which 370 have beaten earnings (78.89%) and only 73 have missed (15.57%) earnings estimates.  In fact, this would be the highest beat rate and lowest miss rate in the past 5 years and well above the averages over the past five years (69.25% Beat rate and 21.51% Miss Rate).  Also, there are five sectors in which at least 80% of companies has beaten EPS estimates thus far.


Bluestone
Rich Farr, Chief Market Strategist
http://www.bluestonecm.com/

Continue reading →

Topley’s Top Ten – August 20, 2018

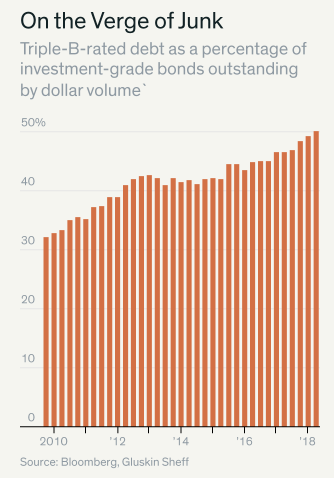
1.Read of the Weekend…$700B BBB Bonds in 2008…$3Trillion 2018

Barrons

Ray Kennedy, a high-yield portfolio manager at Hotchkis & Wiley, notes that when BBB debt—more than twice the size of the $1.2 trillion in junk debt—falls, the high-yield market expands. Some investors, such as certain insurance companies, aren’t allowed to hold junk and will become “forced sellers,” he says, intensifying the downdraft. Only 10% of the junk market is composed of bonds that originally were investment-grade but later were downgraded to junk. That’s far below the median of 15.5% and the historical peak of 32% in 2002-03. So, a large influx of fallen angels would be far from unprecedented.

In a crunch, investors trying to go up the ratings scale would “have a limited pool of choices,” warns Joseph Kalish, chief global macro strategist at Ned Davis Research Group. Higher-quality credits, such as AA or AAA-rated bonds are now just some 10% of the investment-grade universe, versus 20% to 25% in 1999-2000, he says. Investors could turn to U.S. Treasuries but would have to give up over one percentage point of yield. That’s significant in the fixed-income world.

Where the Bond Market’s Next Big Problem Could Start

By
Vito J. Racanelli
https://www.barrons.com/articles/where-the-bond-markets-next-big-problem-could-start-1534536183

Continue reading →

Topley’s Top Ten – August 13, 2018

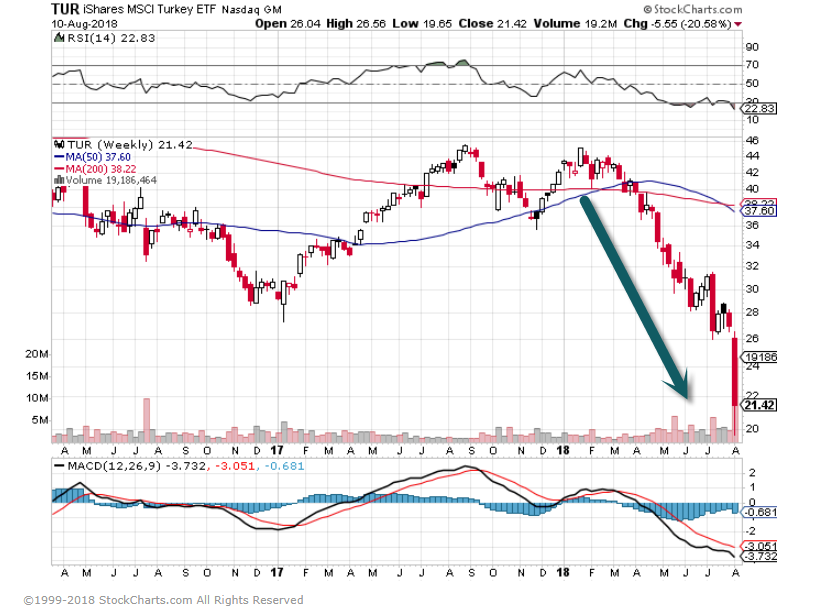
1.Turkey ETF -40% YTD

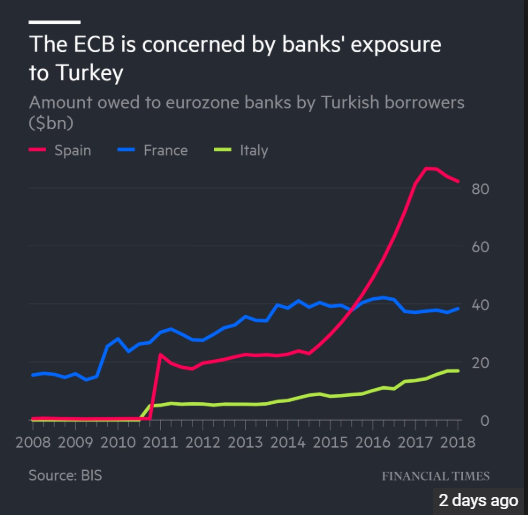
The roots of Turkey’s travails are no mystery. Erdogan pumped a congenitally volatile economy full of steroids in the election run-up, restraining interest rates and pushing a large guaranteed loan program through the banks. That jolted gross domestic product growth north of 7%, but fueled a vertiginous current-account deficit at 6% of GDP. Stress is focused on the banking system, whose clients owe $180 billion in short-term foreign-currency debt, figures Timothy Ash, senior emerging markets sovereign strategist at BlueBay Asset Management. That gets more expensive in lira by the day. “Turkey’s Achilles’ heel is that its banking system is used to intermediate large-scale foreign-currency borrowing,” says Robin Brooks, chief economist at the Institute for International Finance in Washington.

Erdogan compounded his problems by stumbling into conflict with President Donald Trump’s administration over Andrew Brunson, a U.S.-born, Turkey-based Protestant pastor arrested two years ago on charges of colluding with Kurdish terrorists.

Turkey Pays a Financial Price for Its Politics

By
Craig Mellow
https://www.barrons.com/articles/turkey-pays-a-financial-price-for-its-politics-1533916009


Continue reading →

Topley’s Top Ten – August 9, 2018

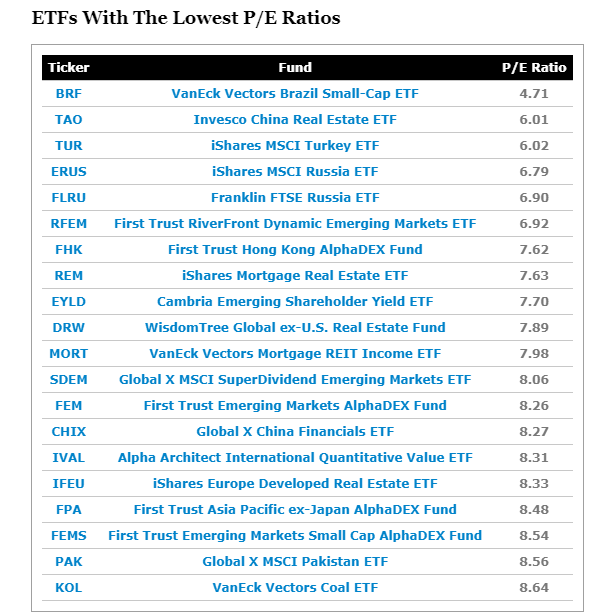
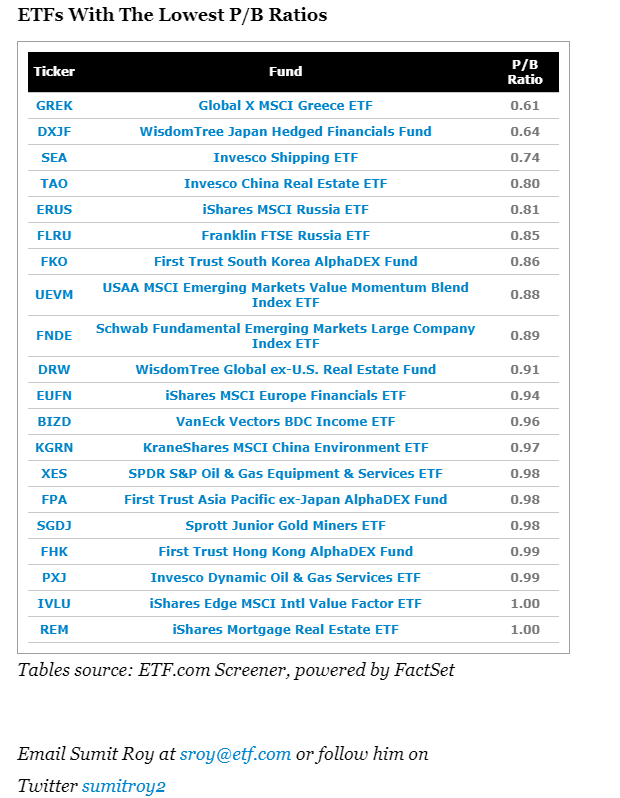
1. ETFs With The Lowest Valuations

Bargains Abroad

Instead, most of the bargains are found in ETFs that focus on equities outside the U.S. Of the 20 cheapest funds by valuation, the vast majority target international equities, and emerging market stocks in particular.

Of course, an ETF with a low P/E ratio doesn’t necessarily mean it’s a great investment. It simply means most of the stocks in the fund are trading at low prices compared to their recent earnings.

It’s a good starting point for value investors, but it’s just the first step in a more comprehensive due diligence process.

https://www.etf.com/sections/features-and-news/etfs-lowest-valuations?nopaging=1

Continue reading →

Topley’s Top Ten, Short Version – August 8, 2018

Sorry to all Subscribers – we experienced some technical difficulties during the past week.  All notifications and posts will now resume as normal.


Thank you!
View From the Top Team


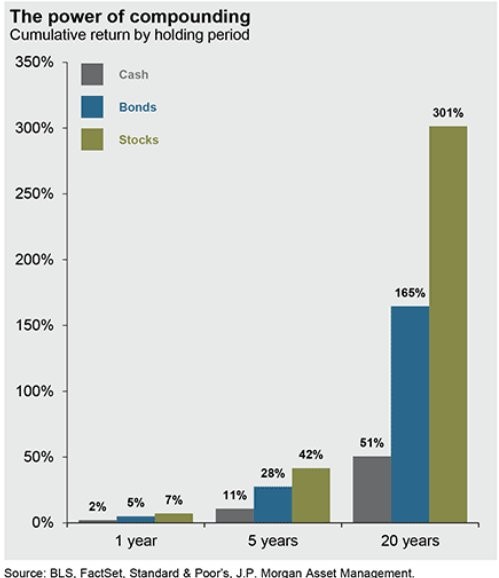
1.The Power of Compounding….Holding through 2 Massive Bear Markets.

In the past 20 years, equity investors have suffered through the two largest bear markets since the 1930’s yet ended up 300% ahead

https://twitter.com/ukarlewitz

Continue reading →

Topley’s Top Ten – August 3, 2018

1.Current Weight of Top 5 Stocks in S&P Actually Lower Than Long-Term Average.

Counter Argument to 5 Stocks Providing Most of the Performance

Are Only a Few Stocks Really Leading Us Higher?

Posted by lplresearch

One of the more popular narratives we’ve heard this year is that only a few large stocks are pulling the overall market higher. We don’t agree with this assessment, and have cited several metrics over the last few months that showed market participation has been broad and eventual new highs in the S&P 500 Index were likely. Remember, when more stocks are moving higher, the bull market’s momentum increases.

Below are a few reasons why we still see broad participation and a continuation of the bull market:

  • The Advance/Decline (A/D) lines for the NYSE and S&P 500 both closed at all-time highs last week.
  • The Dow A/D line made new highs earlier this week.
  • The Value Line Geometric Index is less than 2% from its all-time high. This index equally weights all stocks and is a good gauge for how the median stock is performing.
  • The Technology Equal Weight Index made a new high last week.
  • The Nasdaq 100 Equal Weight Index made a new all-time high last week.

“The one constant that has suggested higher equity prices this year has been market breadth. Tariffs, tweets, and rate worries might be in the headlines, but we’ve been comforted by the fact that many market measures of breadth have suggested eventual new highs and we are happy to report this is still the case today,” explained LPL Research Senior Market Strategist Ryan Detrick.

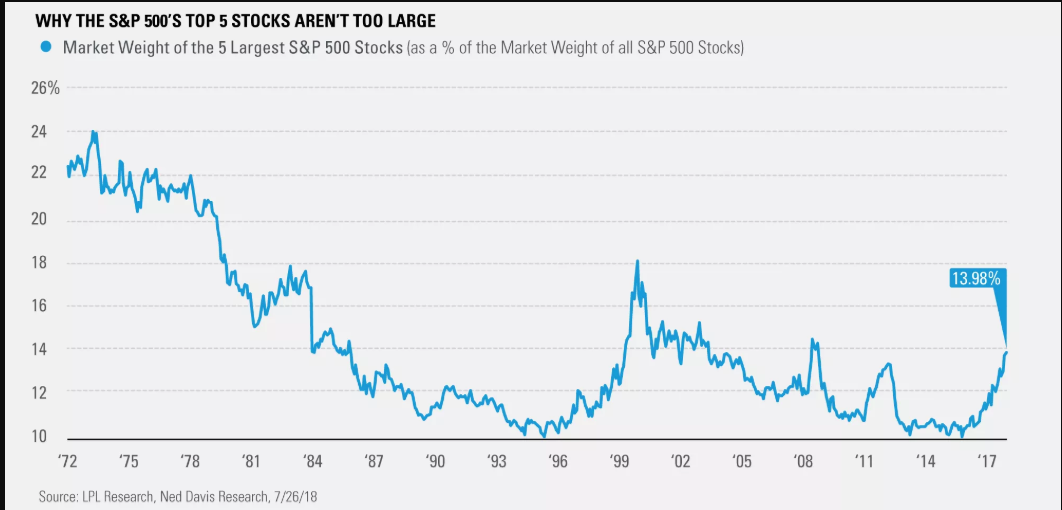
There has been a lot of news coverage around the five largest companies now being worth more than the bottom 250 in the S&P 500. Thanks to data from our friends at Ned Davis Research (NDR), the top five stocks in the S&P 500 account now for 13.98% of the total index. As our LPL Chart of the Day shows, the current weight of the top five stocks is actually beneath the average of 14.33% using NDR’s data going back to 1972.

This is another sign that investors should ignore the narrative that only a few stocks are leading us higher and that the market is doomed.

https://lplresearch.com/

Continue reading →

Topley’s Top Ten – July 31, 2018

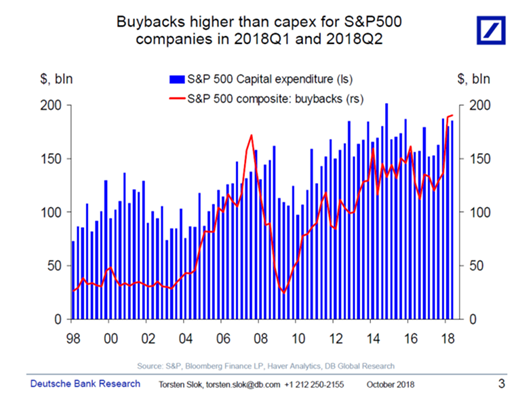
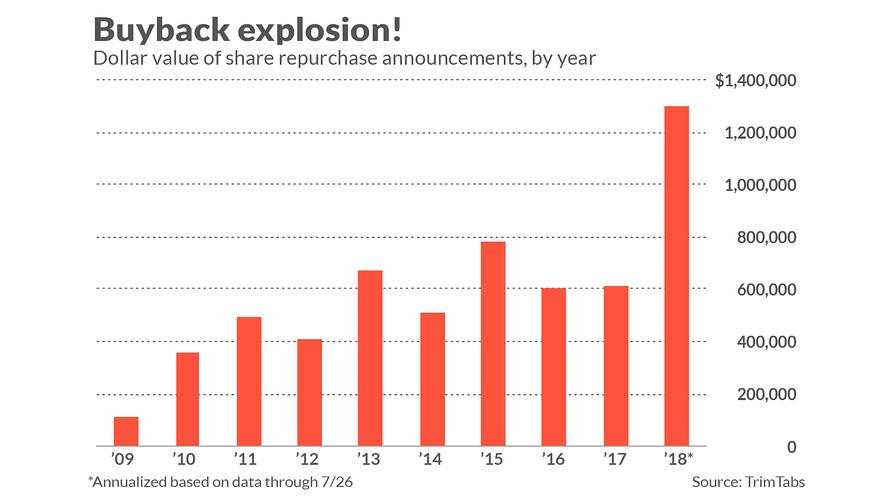
1.As Expected….Buyback Explosion Post Tax Cut.

You will notice that this new quarterly record was nearly double that previous one. Corporations aren’t just gradually ramping up their repurchases; they’re falling over themselves to do so.

But is total buyback activity a good stock market indicator? In the 1980s and 1990s, at least, it was. In those decades, a number of academic studies found, the stock of the average company that announced a new buyback company proceeded to significantly outperform the market over several years following that announcement.

Since then, the situation has changed. One recent study, for example, found no outperformance from buyback activity over the decade through 2012 — that the stock of the average company announcing a buyback performed no better than the S&P 500 SPX, -0.58%  after that repurchase program was announced.

Opinion: Stock buybacks are no reason to buy a stock

Share repurchases once signaled confidence, but now just substitute for dividends

https://www.marketwatch.com/story/stock-buybacks-are-no-reason-to-buy-a-stock-2018-07-31

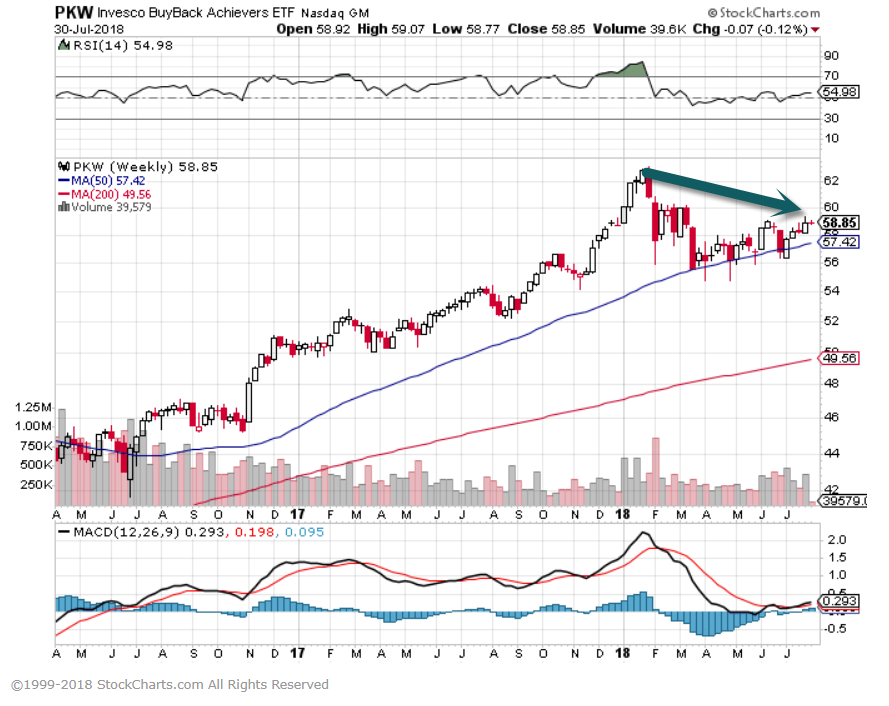
PKW-Buyback ETF Still Below Peaks

www.stockcharts.com

Continue reading →

Topley’s Top Ten – July 23, 2018

There will only be a couple Top 10’s this week due to vacation

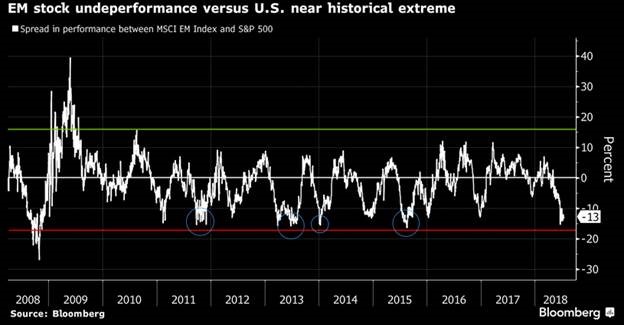
1.Emerging Markets Stock Underperformance Versus U.S. Near Historical Extremes.

Goldman, BlackRock and Franklin Templeton all say now’s the time to buy emerging markets – “The performance of emerging-market equities relative to U.S. large caps, as measured by the spread of rolling three-month returns, is near a threshold of -17 percent, which hasn’t been breached since the global financial crisis”

From Dave Lutz at Jones Trading

Continue reading →

Topley’s Top Ten – July 17, 2018

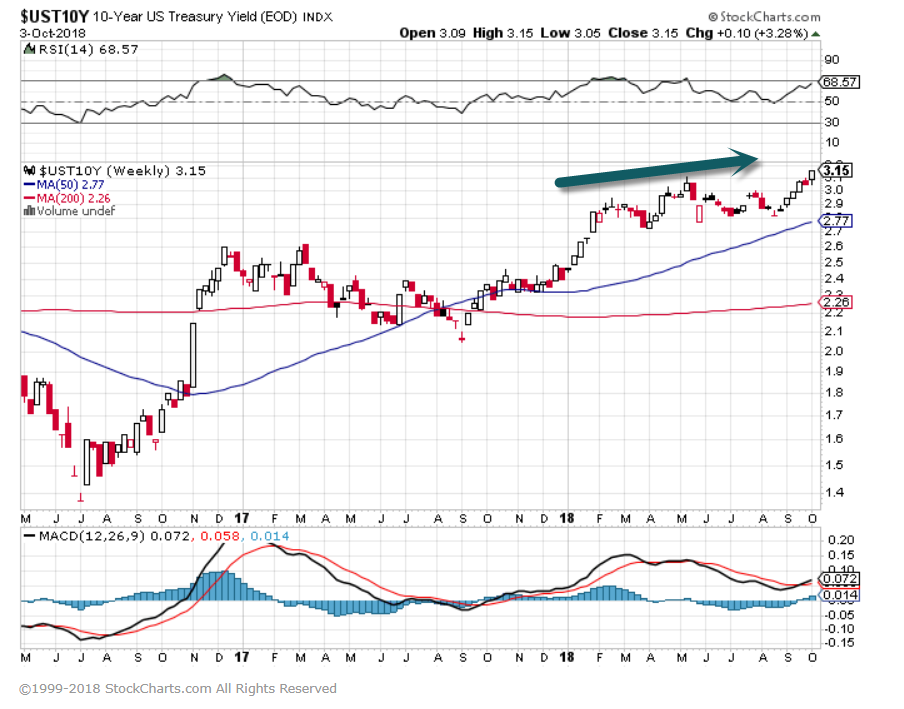
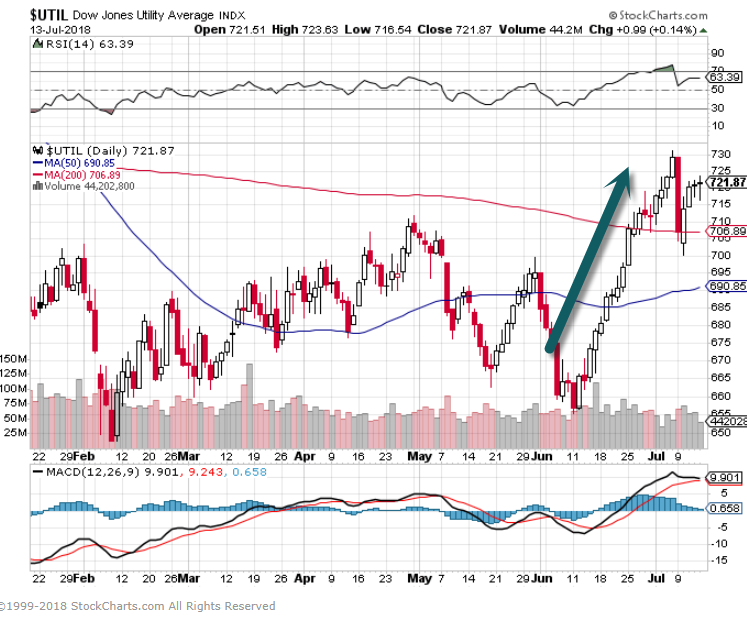
1.10 Year Back Below 3%…Utilities Gain 2% Per Week for a Month Straight.

Utility stocks in the S&P 500 have made gains of at least 2% in four straight weeks, a first for that sector. The previous record was three consecutive weeks in 2000 and 2004.

Why Utility Stocks Are Worth a Second Look
Lawrence C. Strauss
https://www.barrons.com/articles/why-utility-stocks-are-worth-a-second-look-1531344310

www.stockcharts.com

Continue reading →

Topley’s Top 10 – July 12, 2018

1.The Ultimate Question-Can Earnings Keep Rising?

Can Companies Keep Up Strong Beat Rates in Q2 Earnings Season?
Jul 11, 2018

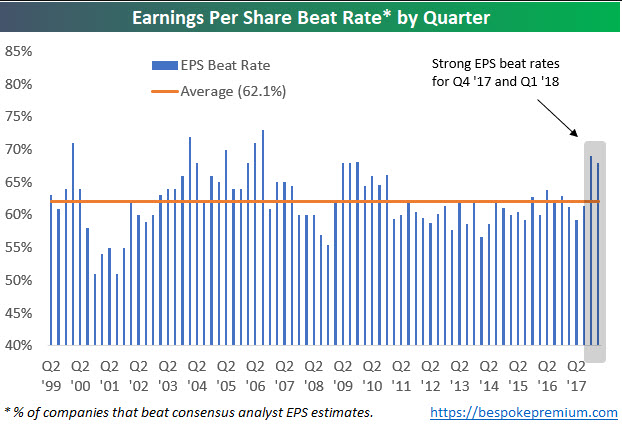
One thing we’ll be watching closely this earnings season is whether companies can keep up the extraordinarily high beat rates seen over the past two quarters.

Over the past two earnings seasons, even though analysts had to up their estimates quite a bit due to the Trump corporate tax cuts, companies were easily able to beat expectations.  Since 1999, 62.1% of earnings reports have reported EPS that were greater than consensus expectations.  As shown below, though, the last two quarters saw much higher than average beat rates.

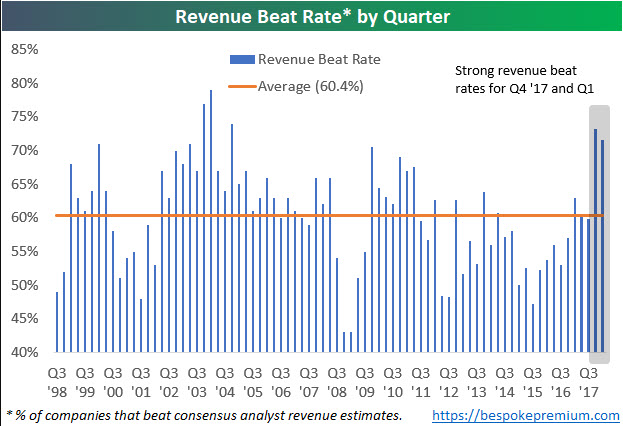
Not only have bottom line EPS beat rates been strong, but top-line revenue beat rates have been strong as well.  Revenue beat rates over the last two earnings seasons were higher than any quarter since Q4 2004.

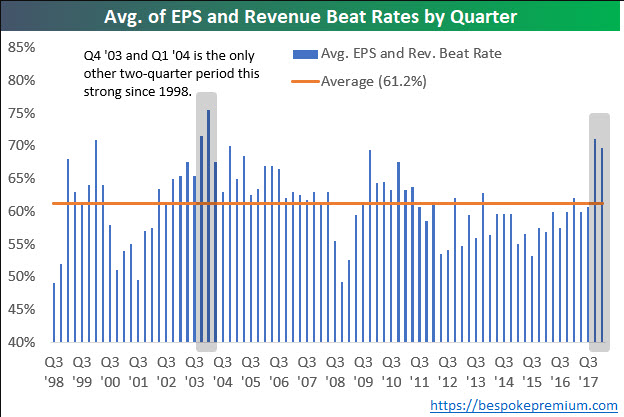
The chart below takes the average of each quarter’s earnings and revenue beat rate.  When looking at the strength of both the top and bottom line beat rate each earnings season, the only other two-quarter period that showed stronger beat rates than the last two quarters was back in Q4 2003 and Q1 2004.

Needless to say, investors have gotten used to stronger than expected earnings reports over the last six months.  If companies aren’t able to keep up the pace this season, we think the market will struggle.

https://www.bespokepremium.com/think-big-blog/

Continue reading →

Topley’s Top Ten – July 10, 2018

1.A Record $2.5 Trillion in Mergers Were Announced in the First Half of 2018

By Stephen Grocer
July 3, 2018

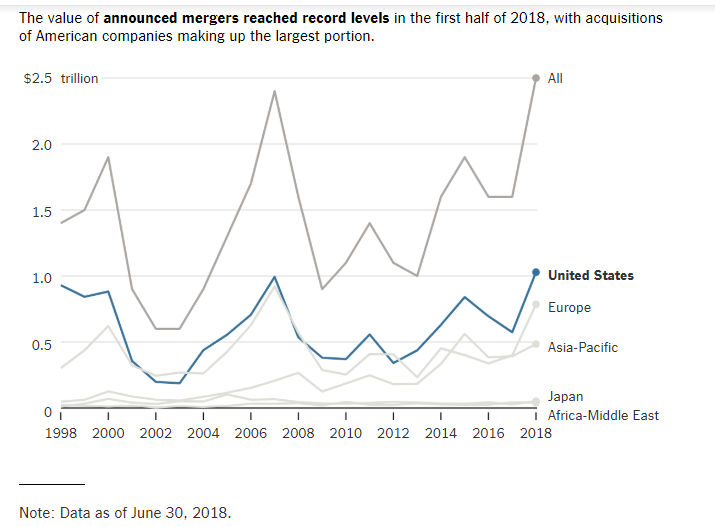
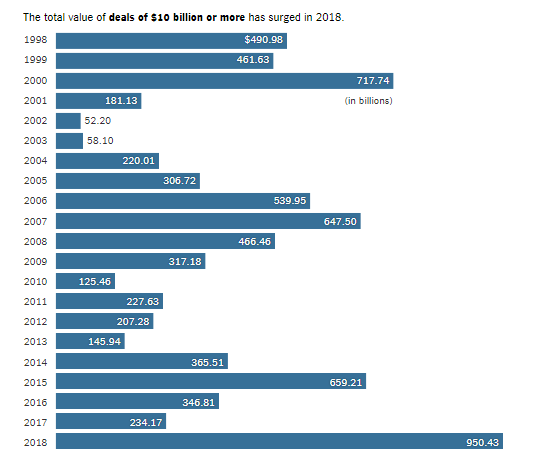
More than $2.5 trillion in mergers were announced during the first half of the year, as fears of Silicon Valley’s growing ambitions helped drive a record run of deal-making.

Four of the 10 biggest deals were struck in part to fend off competition from the largest technology companies as the value of acquisitions announced during the first six months of the year increased 61 percent from the same period in 2017, according to data compiled by Thomson Reuters. That has put mergers in 2018 on pace to surpass $5 trillion, which would top 2015 as the largest yearly total on record.

Even rising global trade tensions did not manage to stifle acquisitions: Deals involving companies based in different countries nearly doubled compared with the first half of last year, and accounted for more than 40 percent of all announced transactions.

https://www.nytimes.com/2018/07/03/business/dealbook/mergers-record-levels.html?rref=collection%2Fsectioncollection%2Fbusiness-dealbook&action=click&contentCollection=dealbook&region=rank&module=package&version=highlights&contentPlacement=4&pgtype=sectionfront

Continue reading →

Topley’s Top Ten – July 9, 2018

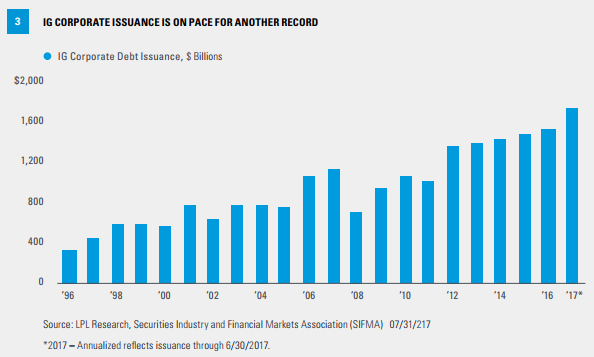
1.At Current YTD Pace….Investment Grade Corporate Looking At Worst Returns Since 1974..Following Record Issuance.

Indeed, investors can’t be blamed for wondering whether it’s worth investing in bonds at all, now that they’re finding negative returns across the market: Investment-grade corporate bonds are down 4.9% this year, including interest payments, which puts them on track for their worst calendar-year performance since 1974, according to Bank of America Merrill Lynch

Barrons

https://www.barrons.com/articles/bolster-your-bond-portfolio-1530915409

Record Issuance

https://seekingalpha.com/article/4130422-u-s-corporate-debt-2018

Continue reading →

Topley’s Top Ten – Short Version – June 27, 2018

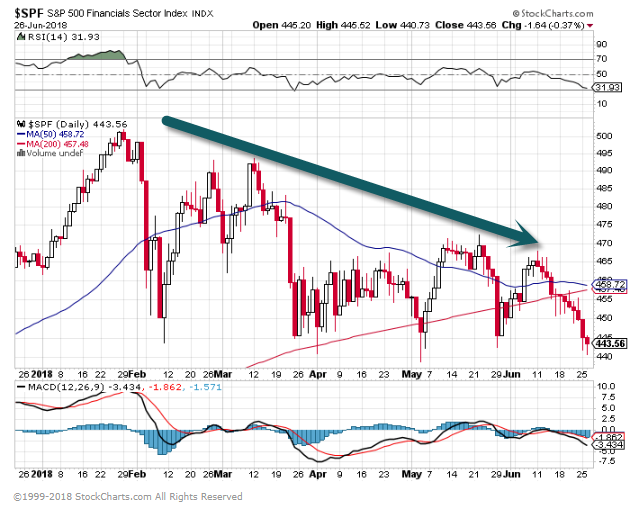
1.S&P Financials Down 12 Straight Days…Longest on Record….Even 2008?

S&P Financials close below 200day ….-11% off highs.

www.stockcharts.com

Bank Stocks Are On Their Longest Losing Streak Ever By Sarah Ponczek and Felice Maranz

S&P 500 Financials Index falls for 12th straight day

Financial Select Sector SPDR Fund ETF sees 8 days of outflows

https://www.bloomberg.com/news/articles/2018-06-26/banks-endure-record-streak-of-losses-as-yield-curve-flattens

Continue reading →

Topley’s Top Ten – June 21, 2018

1.Chinese Investment in the US Drops 90% Amid Political Pressure

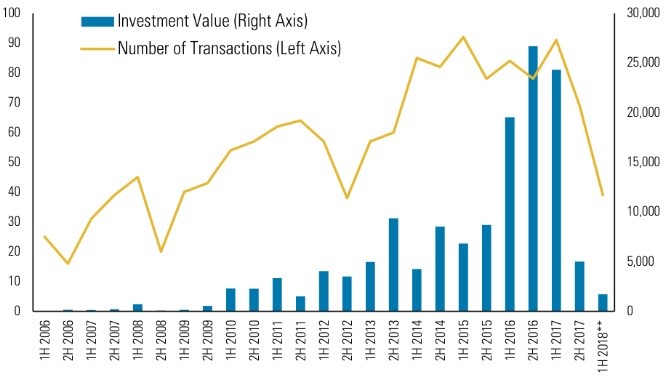
  • Chinese acquisitions and investments in the U.S. fell 92 percent to just $1.8 billion in the first five months of this year, consulting and research firm Rhodium Group says.
  • Counting divestitures, net Chinese deal flow to the U.S. during that time was a negative $7.8 billion, the report says.
  • Beijing is trying to limit capital outflows and excessive leverage, while the Trump administration is increasing scrutiny of Chinese investments in the U.S. amid concerns about intellectual property protection.

Evelyn Cheng | @chengevelyn

The decline follows a sharp drop in the second half of last year as pressure from both Beijing and the Trump administration curbed a recent surge in cross-border investment. Completed Chinese deals in the U.S. hit a record $46 billion in 2016, and dropped to $29 billion in 2017, according to Rhodium.

Completed Chinese FDI deals in the US* in $ millions (2006-2018)

Source: Rhodium Group. *Includes completed M&A transactions with over 10% resulting stake and greenfield projects that have broken ground. **January to May 2018.

https://www.cnbc.com/2018/06/20/chinese-investment-in-the-us-drops-90-percent-amid-political-pressure.html

Continue reading →

Topley’s Top Ten – Short Version – June 19, 2018

1.8 Tech Stocks Market Cap Bigger Than Europe, EM and Japan.

The world’s hottest tech companies are now worth more than $5 trillion, and they could be pointing out the next big bubble

Stock traders celebrate on the last trading day of 1999, which closed at a record 17,091 points, on the floor of the stock exchange in Sao Paulo, Brazil.Paulo

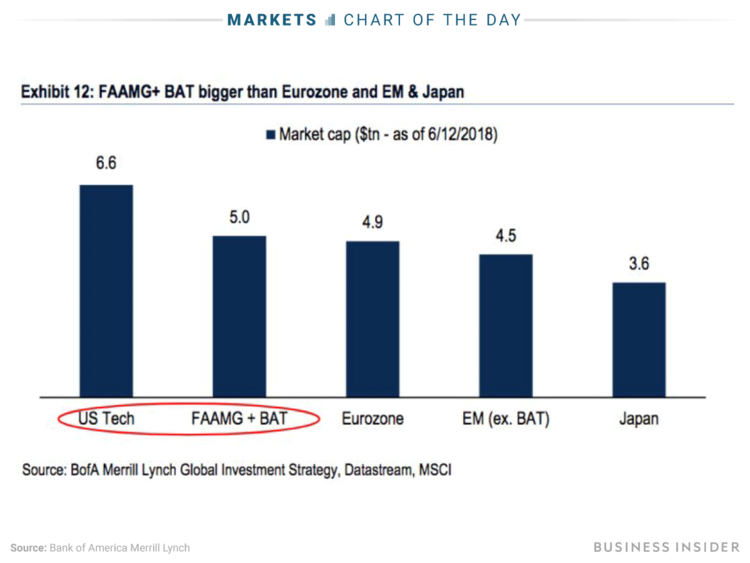
  • The most prominent US and Chinese tech stocks are worth more, by market cap, than the stock markets of the eurozone and Japan.
  • Facebook, Amazon, Apple, Microsoft, Google, Baidu, Alibaba, and Tencentare worth $5 trillion, according to data compiled by Bank of America Merrill Lynch. US tech stocks are worth even more, at a $6.6 trillion market cap.
  • Michael Hartnett, BAML’s chief investment strategist, has cited this size as a reason investors should reduce their exposure to tech stocks.
  • “Long FAAMG + BAT” is considered the most crowded trade, according to BAML’s global fund-manager survey.

Here’s your stat of the day: Eight tech companies are worth more than the stock markets of Japan and the entire eurozone.

The companies make up what Wall Street has abbreviated as “FAAMG + BAT”: Facebook, Amazon, Apple, Microsoft and Google (or Alphabet), plus the Chinese tech companies Baidu, Alibaba, and Tencent.

As of last Tuesday, they had a combined market capitalization of $5 trillion, according to data compiled by Bank of America Merrill Lynch. US tech stocks were worth even more, at $6.6 trillion.
Bank of America Merrill Lynch

http://www.businessinsider.com/facebook-amazon-other-tech-giants-larger-than-major-stock-markets-2018-6

2. Amazon CEO Jeff Bezos is now worth a record $141 billion—here’s how he became the richest person in the world

Zameena Mejia
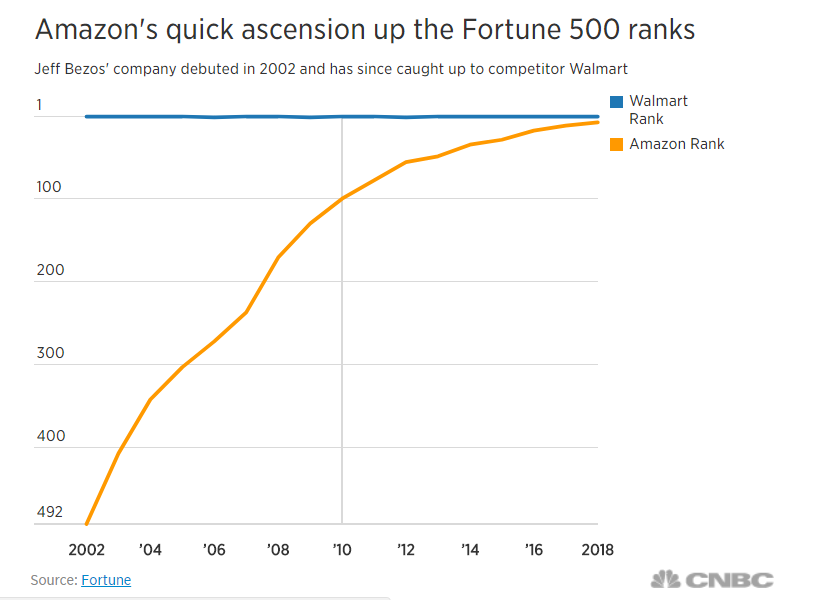
Amazon founder and CEO Jeff Bezos, the wealthiest person in the world, is richer than he has ever been before. Since June 1, the tech titan’s net worth has grown over $5 billion and now totals $141.9 billion, according to the Forbes World’s Billionaires list. That makes Bezos worth roughly $49 billion more than Bill Gates and about $60 billion more than Warren Buffett.

This latest win for Bezos is just one of many he has enjoyed this year.

As Amazon’s customer base sticks around despite the latest Prime latest price hike in exchange for a slew of services and perks, the company’s stock has continued to increase in value. Even Buffett now regrets not investing in Amazon when he had the chance.

Earlier this year, Bezos officially became the richest person in the worldand also helped make Amazon the second most valuable company in the world, behind Apple. And his success can arguably be traced back to a risk he took when he was 30 years old.

https://www.cnbc.com/2018/06/18/how-amazon-made-jeff-bezos-the-richest-man-alive-worth-141-billion.html

3.The Money Thrown Around By Big Tech Is Mind-Boggling…Google Invests $550 M for 1% Stake.

Google Invests $550 Million in Chinese Online Shopping Site JD.com

Partnership will help both companies expand their retailing presence in Southeast Asia, the U.S. and Europe

By
Liza Lin

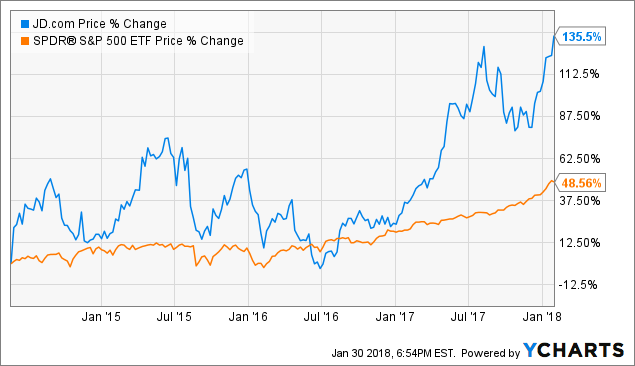
SHANGHAI— Alphabet Inc.’s GOOGL 2.10% Google unit is investing $550 million in Chinese online retailer JD.com Inc., JD 0.39% a move that will deepen its ties with China and ramp up its rivalry withAmazon.com Inc. AMZN 0.46%

The deal, which according to a JD spokesman gives Google a 1% stake, will help both companies expand their retailing presence. Under the partnership, JD will start selling products on Google Shopping, reaching consumers in the U.S. and Europe as it seeks to diversify beyond China’s highly competitive e-commerce market.

Google Shopping shows retailers’ ads for goods above the blue links in Google’s search results for many types of products, like apparel and appliances.

The search giant is building alliances as it races Amazon to develop new ways for people to shop, from voice-enabled smart speakers to faster and more convenient home grocery delivery.

Write to Liza Lin at Liza.Lin@wsj.com

Appeared in the June 19, 2018, print edition as ‘Google Tries New Approach To China.’
 https://seekingalpha.com/article/4141859-potential-multibaggers-jd-com-global-ambitions

4.Credit Deteriorating as Market Goes Higher

Equity Markets: The S&P 500 has diverged from investment-grade spreads.

Source: TS Lombard, @ReutersJamie

https://blogs.wsj.com/dailyshot/

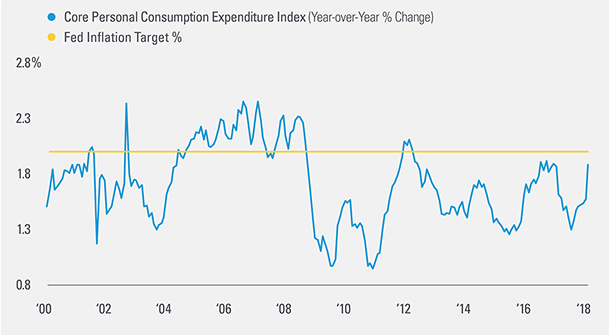
5.FED’s Favorite Inflation Measure Still Below 2%

Fed’s Preferred Inflation Measure Still Below Target

– Inflation has picked up and the Personal Consumption Expenditure Index (PCE)
ex-food and energy, the core version of the Fed’s preferred measure of inflation,
has accelerated toward the Fed’s 2% target.

– The PCE has not yet breached the 2% level, and in fact has not been over target since a brief stretch in early 2012.

https://lpl-research.com/hoc/#a1
 

6.Too Much Smart Beta?  IShares Closes 16 ETFs

iShares To Close 16 ETFs

June 18, 2018

HEATHER BELL

The ETF industry’s biggest ETF issuer doesn’t often shut down ETFs, but when it does, BlackRock’s iShares arm tends to do it in the summertime.

iShares announced today that it will be closing 16 ETFs, almost all of them falling under the smart-beta rubric. The funds’ last day of trading will be Aug. 15.

Of the nonsmart-beta ETFs that are shuttering, the iShares Currency Hedged MSCI Europe Small-Cap ETF (HEUS) launched in 2015, and only has about $3 million in assets under management (AUM), while the iShares Currency Hedged MSCI ACWI ETF (HACW), which launched around the same time, has $6 million. The iShares Currency Hedged International High Yield Bond ETF (HHYX), another 2015 launch, has less than $2 million in AUM.

iShares joins other asset managers that have closed currency hedged equity ETFs that were the rage in 2015 after failing to gather assets. Back then it seemed as if the currency hedged train would be unstoppable as HEDJ, DXJ, DBEF and others topped the leader board. But when the dollar reverses, it’s harder to meet minimum thresholds to remain viable,” said Todd Rosenbluth, director of ETF and mutual fund research at CFRA.

Smart-Beta Closures

The other remaining funds to be closed are factor-focused products and include four currency-hedged minimum-volatility ETFs as well as nine multifactor sector funds. The four hedged min-vol funds all rolled out in the last quarter of 2015, and none have more than $20 million in AUM. They include:

Meanwhile, the nine multifactor sector ETFs are as follows:

The entire family has roughly $50 million in AUM. The products were launched in 2016 after John Hancock rolled out its own family of multifactor sector funds based on indexes created by Dimensional Fund Advisors. Those funds currently have about $365 million in AUM after a slow start.

“iShares had already moved on from multi factor sector products when they launched the active iShares Evolved suite, including theiShares Evolved US Consumer Staples ETF (IECS). Investors have focused on market-cap-weighted and to a lesser extent on equal-weighted sector ETFs, but anything else more complicated to explain has struggled to garner interest,” Rosenbluth noted with regard to the scheduled closures.

The total number of closures so far for 2018 far outpaces the record-breaking amount of shutdowns that occurred in 2017; that’s mainly because of the 50 iPath ETNs that were shuttered earlier this year. Factor out those closures, and numbers are comparable with 2017. This latest announcement just adds more weight to the idea that 2018 will demolish 2017’s record.

Contact Heather Bell at hbell@etf.com

http://www.etf.com/sections/features-and-news/ishares-close-16-etfs

7.Americans Eating Out Equal to Home.

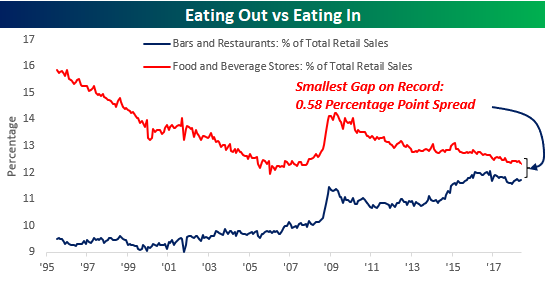
The chart below compares the historical share of total sales that eating in (Food and Beverage Stores) and eating out (Bars and Restaurants) have accounted for.  With “Eating In” accounting for 12.31% of total sales and “Eating Out” accounting for 11.73%, the 0.58 percentage point gap between the two categories is the narrowest it has ever been.  What’s even more fascinating about the shift in eating trends over the last 20+ years is the fact that even as Americans have changed where they eat (out vs home), the percentage of total sales that “food and beverage” account for has held steady.  Combined, the two categories currently account for 24.05% of total retail sales, and that compares to a historical average of 23.64% going all the way back to 1995.

In the house of the future, what will replace the kitchen?

https://www.bespokepremium.com/think-big-blog/
8.To increase your emotional intelligence, develop these 10 qualities

I hope you gain value from this and learn to understand the ways you can influence your mind, and the minds of others, by growing emotionally every day, in all that you do.

  1. Empathy

I love this definition of empathy:

“Empathy is the capacity to understand or feel what another person is experiencing from within their frame of reference, i.e., the capacity to place oneself in another’s position.”

There are two different types of empathy. This piece from the Greater Good Science Center at UC Berkeley beautifully depicts what they are:

“Affective empathy” refers to the sensations and feelings we get in response to others’ emotions; this can include mirroring what that person is feeling, or just feeling stressed when we detect another’s fear or anxiety. “Cognitive empathy,” sometimes called “perspective taking,” refers to our ability to identify and understand other peoples’ emotions.

We empathize based on the reaction to others. What I’d also say is that empathy can be cultivated and learned through experiences. Store away in your memory those feelings that you feel both in reaction, and as you put things in perspective. Write these thoughts out, analyze them and determine how you want to treat others in the same way you’d want to be treated.

  1. Self-awareness

Self-awareness is the art of understanding yourself, recognizing what stimuli you’re facing and then preparing for how to manage yourself both in a proactive and reactive manner. Self-awareness is how we see ourselves, and also how we perceive others to see us. The second, external aspect, is always the most difficult to properly assess.


Dr. Tasha Eurich says:

“Leaders who focus on building both internal and external self-awareness, who seek honest feedback from loving critics, and who ask what instead of why can learn to see themselves more clearly—and reap the many rewards that increased self-knowledge delivers.”

For yourself, ask the introspective questions, yearn for knowledge and be curious. And for others, seek feedback in an honest, caring environment.

  1. Curiosity

“I have no special talents. I am only passionately curious.” — Albert Einstein

Show me a curious person who’s willing to learn and improve, and I’ll show you a success story waiting to happen. When you’re curious, you’re passionate, and when you’re passionate you are driven to want to be your best. Your “antennae” are up to things you love, to wanting to grow and learn more. This learning mindset positively affects other areas of your life—like relationships.

Tomas Chamorro-Premusic writes:

“First, individuals with higher CQ are generally more tolerant of ambiguity. This nuanced, sophisticated, subtle thinking style defines the very essence of complexity. Second, CQ leads to higher levels of intellectual investment and knowledge acquisition over time, especially in formal domains of education, such as science and art.” Source: HBR

  1. Analytical mind

The most emotionally intelligent and resolute people are deep-thinkers that analyze and process all new information that comes their way. They continue to analyze old information, habits and ways of doing things to see if they can extract ways to improve. We’re all “analysts” in the sense that we consciously think about all new information that comes our way.

Savvy EQ individuals are problem-solvers and everyday philosophers who contemplate the “why” of existence, the “why” of why we do what we do, and who care passionately about living a virtuous life. Having an analytical mind means having a healthy appetite for a continuously improving mindset geared at bettering yourself and always remaining open to new ideas.

  1. Belief

A major component of maintaining emotional self-control is using the power of faith to believe in yourself both in the present and in the future. It’s believing that the people and things in your life are there for a reason, and that everything will ultimately work out for good.

Faith alone will not help you. It takes action, of course. But when you combine faith with powerful values like hard work, perseverance and a positive attitude, you have formed the foundation of a champion. Every great leader and thinking uses faith, either in a practical context, emotionally and certainly spiritually.

Spend time in meditation. Think about the way you believe in yourself. Engender a greater faith toward the person you are and who you want to become. And trust and believe that the pieces in your life will come together in a way that will help you live boldly and joyfully.

  1. Needs and wants

The emotionally intelligent mind is able to discern between things that they need versus things that would be “nice to have” that classify more aptly as wants. A need, particularly in the context of Abraham Maslow’s “Hierarchy of Needs” is the basic level stuff like safety, survival and sustenance. Once those things are met, then we can progress to other needs and of course, wants.

A “want” is a big house, nice car, and even the brand new iPhone. We do not need those things to survive, but rather we want them based on our own personal desires or what we perceive to matter to society. Become well-versed in knowing what you truly need to live, to accomplish goals and to support yourself and loved ones. Make sure you draw a very clear distinction between what it is you need, and what it is you want.

Emotionally intelligent people know the difference between these two things, and always establish needs prior to fulfilling wants.
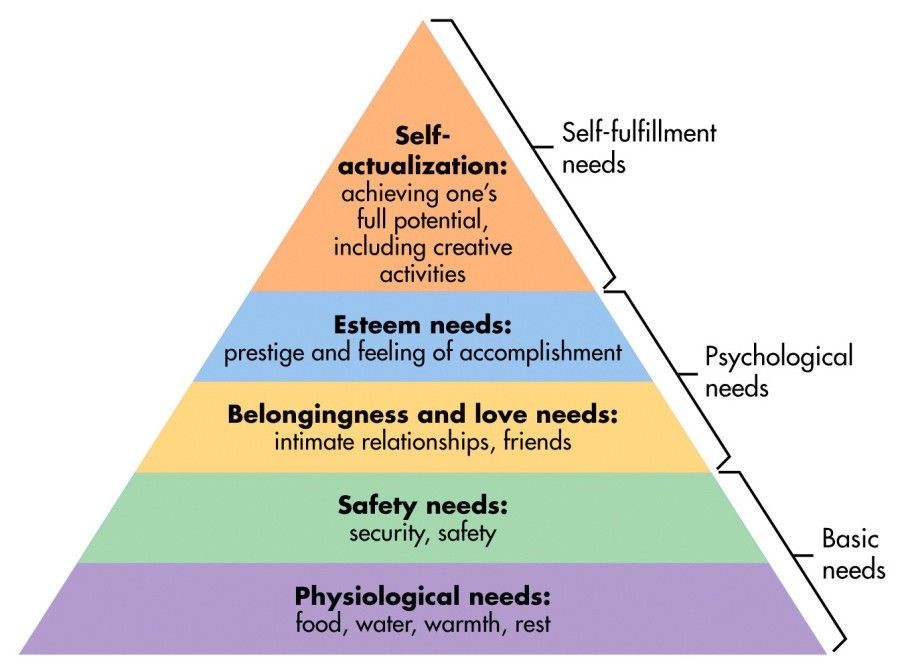
Abraham Maslow’s “Hierarchy of Needs.”

  1. Passionate

Inspired leadership and love for what you do is born from having a passion for a subject or people. People with a high EQ use their passion and purpose to ignite the engine that drives them to do what they do. This passionate is infectious and contagious—it permeates all areas of their lives and rubs off on the people around them.

Passion is sort of that je ne sais quoi that when you feel it, or even when you see it in others, you simply know. Passion is the natural desire, instinct, drive, ambition and motivated love for a subject or someone. Passion brings positive energy that helps sustain us and inspire us to want to keep going. And there’s no secret that emotionally intelligent people who are passionate are also willing to persevere and power forward no matter their circumstances.

  1. Optimistic

If you want to increase your opportunities, improve your relationships and think clearly and constructively, you’re best positioned to maintain a positive attitude. Of all the things that we try to control and influence, our attitude is the primary thing that is always within our control. We can choose to live each day by being positive. It’s that simple.

“When we are happy—when our mindset and mood are positive—we are smarter, more motivated, and thus more successful. Happiness is the center, and success revolves around it.” — Shawn Achor

  1. Adaptability

“Adaptability is not imitation. It means power of resistance and assimilation.” – Mahatma Gandhi

Emotionally intelligent people recognize when to continue their course, and when it’s time for a change. This vitally import recognition and ability to make crisp, swift decisions in your best interest is called adaptability. You must determine when to stay the course, or when to keep moving forward in another direction.

Similarly, when one strategy is not working, try evaluating and determining if something else will work. From the way you treat yourself, to how you treat others, to your daily routine, always stay open-minded and be willing to adapt and introduce new elements to how you think and what you do.

Throughout your life, you’ll need to change course and make assessments on whether you’ll be happy and successful if you choose one path or another. Recognize that you can always change. You can always start over. It may not always be the most prudent or wise decision, but only you will truly know in your heart what is or what isn’t. Start with leaving the option on the table.

  1. Desire to help others succeed and succeed for yourself

Last but not least, an emotionally intelligent person is interested in overall success and achievement—not just for themselves, but for their peers. Their inspired leadership and passion, combined with their optimism, drives them to want to do best for themselves and others.

Too often, we get so self-absorbed and concerned only with “What’s in it for me?” We have to be concerned about this. It’s a must, so don’t let anyone ever convince you otherwise. But in the same way that we should be focused on our self-interest, we should also maintain a spirit of desire and hope for wanting to see the people around us succeed.

Not only is this a brilliant safeguard against envy and greed, it also revitalizes our passion and drives us toward achieving our next goal. It helps us gain allies and builds powerful relationships that come back to help us in reciprocal fashion.

Join my newsletter and check out my bestselling book, The Value of You. This will give you inspiration to start planning for success on your journey. If you’re interested in working with me try me here.

This post was originally published on Medium.

https://qz.com/1304343/to-increase-your-emotional-intelligence-develop-these-10-qualities/


Found at Barry Ritholtz blog www.thebigpicture.com

Topley’s Top Ten – June 5, 2018

1.Stocks Added to S&P 500 Index Underperform Those Kicked Out by an Average of 23 Percentage Points Over 12 Months.

Barrons-Rob Arnott

Studying S&P 500 index data from 1989 to 2017, Arnott found that the stocks added to the index underperformed those that were kicked out by an average of 23 percentage points over the next 12 months   Stocks added are almost always trading at high multiples. Discretionary deletions, when companies are removed for not meeting criteria, are almost always trading at bargain-bin prices. It occurred to me that no one had taken a close look at the “buy high, sell low” nature of indexes, exploring that as trading cost.

https://www.barrons.com/articles/rob-arnott-on-beating-stock-indexes-1527897602

Continue reading →

Topley’s Top Ten – May 31, 2018

1.VIX Options Trading Drops

Traders’ interest in VIX options keeps on waning. The collapse of a popular exchange-traded note amid a surge in market turmoil earlier this year helped send the number of Cboe Volatility Index contracts tumbling, and this month options volume has slumped to a three-year low. The VIX is heading for a May drop, a pattern that led to gains in June in the past four years, Bloomberg notes.

@sentimentrader notes “Using big 1-day jumps in the VIX as a signal that volatility is about to pick up going forward has been, to put it mildly, unsuccessful.”

From Dave Lutz at Jones.
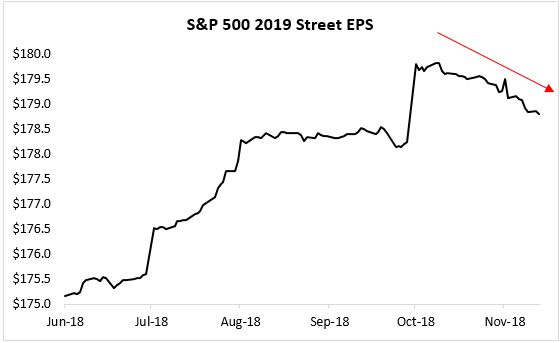
Continue reading →

Topley’s Top Ten – May 14, 2018

Want some good news? S&P 500 is positive YTD and it is May. You have to go back to ’90 last time that happened and the full year didn’t sport a total return that was positive. In fact, since ’70, the full year has been green 35 out of 36 years that saw the SPX up YTD in May (@RyanDetrick)

 1.Short to Intermediate Term NYSE Advance/Decline Bullish.

https://www.marketwatch.com/story/an-indicator-thats-90-accurate-suggests-hidden-strength-in-the-stock-market-2018-05-11

Introduction

The Advance-Decline Line (AD Line) is a breadth indicator based on Net Advances, which is the number of advancing stocks less the number of declining stocks. Net Advances is positive when advances exceed declines and negative when declines exceed advances. The AD Line is a cumulative measure of Net Advances. It rises when Net Advances is positive and falls when Net Advances is negative. Chartists can use Net Advances to plot the AD Line for the index and compare it to the performance of the actual index. The AD Line should confirm an advance or a decline with similar movements. Bullish or bearish divergences in the AD Line signal a change in participation that could foreshadow a reversal.
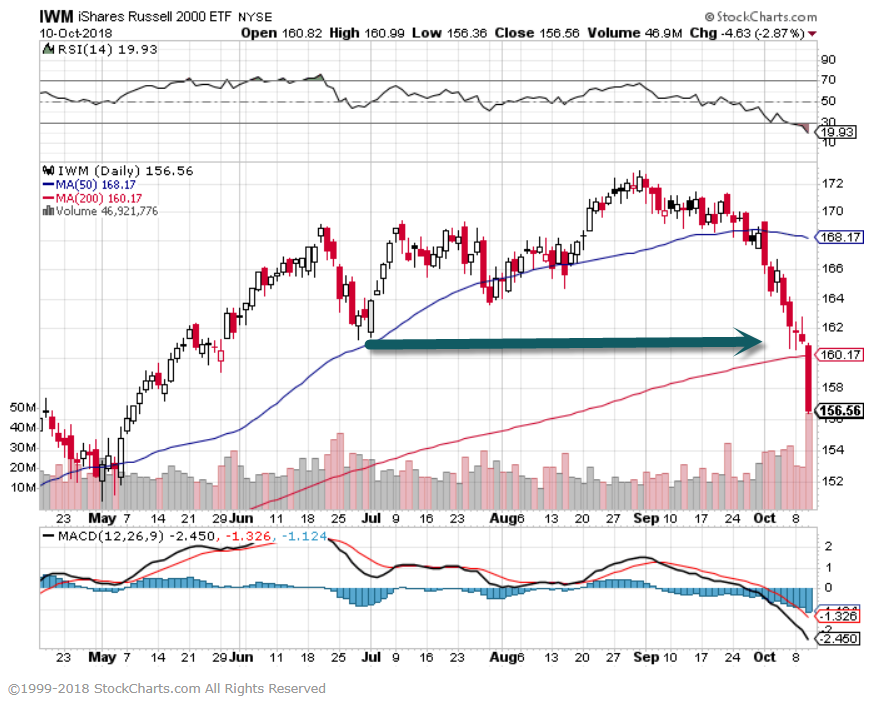
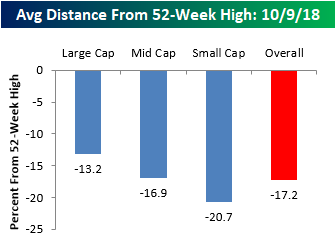
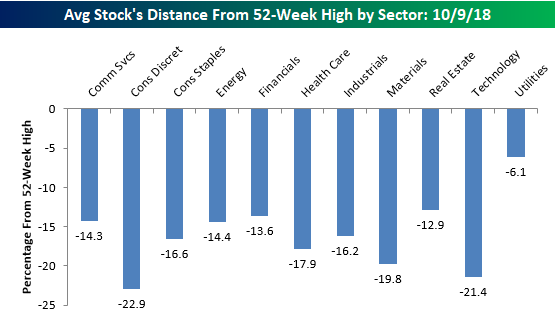
http://stockcharts.com/school/doku.php?id=chart_school:market_indicators:ad_line

Continue reading →

Topley’s Top Ten – May 9, 2018 (Short Version)

1.Spread Between Defensive Consumer Staples and Consumer Discretionary Has Only Been Higher in 2000

On page 6 of this month’s report, we provide the chart below which shows the spread between the weightings for Consumer Discretionary and Consumer Staples.  At +6.12 percentage points, the only time Consumer Discretionary’s weight versus Consumer Staples has been higher was in April 2000.


https://www.bespokepremium.com/think-big-blog/

  Continue reading →

Topley’s Top 10..Short version – May 4, 2018

1. Tech and Consumer Discretionary Still Leading Sectors….No Shift Yet to Traditional Defensive Sectors.

Bespoke’s Sector Snapshot — 5/3/18
May 3, 2018

If you’re not yet a subscriber and would like to see the report, please start a two-week free trial to Bespoke Premium now.

Below is one of the many charts included in this week’s Sector Snapshot, which highlights the year-to-date percentage change of the eleven S&P 500 sectors.  At this point, just three sectors are still in positive territory, while eight are in the red.  Consumer Staples and Telecom are down the most with declines of more than 13%.

https://www.bespokepremium.com/think-big-blog/
Continue reading →