Topley’s Top Ten – August 14, 2017

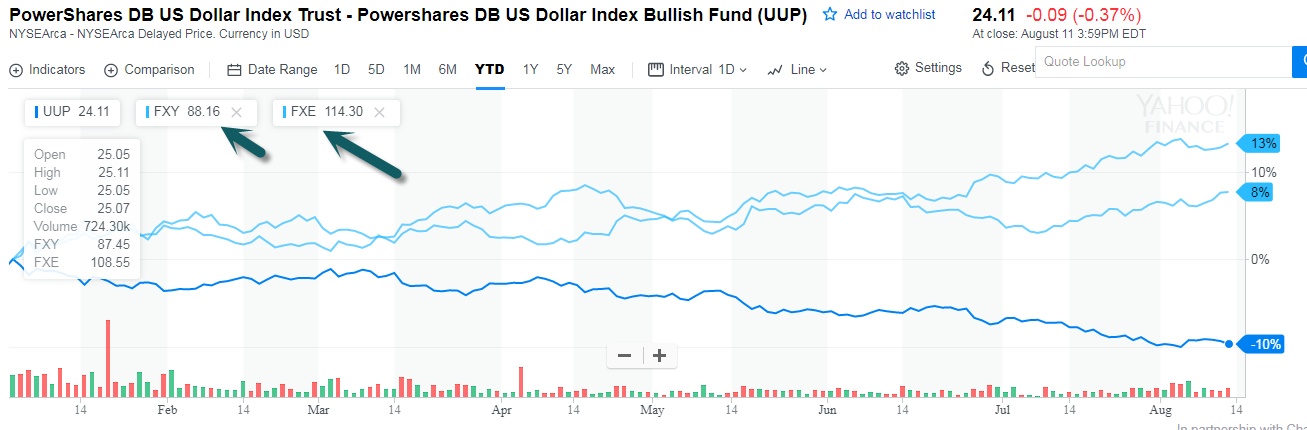
1.Dollar Bull Chart UUP -10% in 2017.

Dollar Bull Chart UUP Vs. FXY (YEN) FXE (Euro)

www.yahoofinance.com

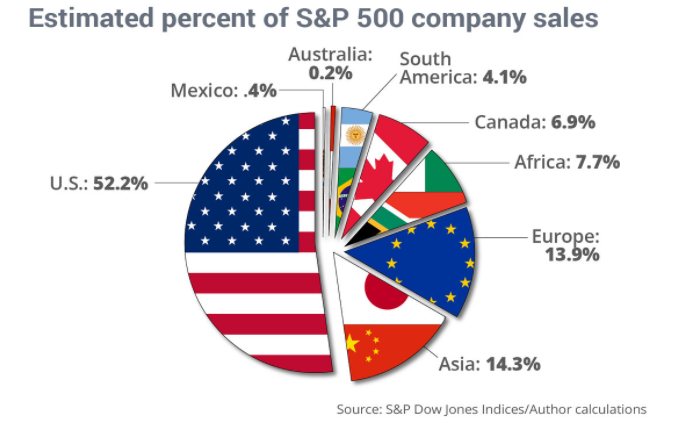
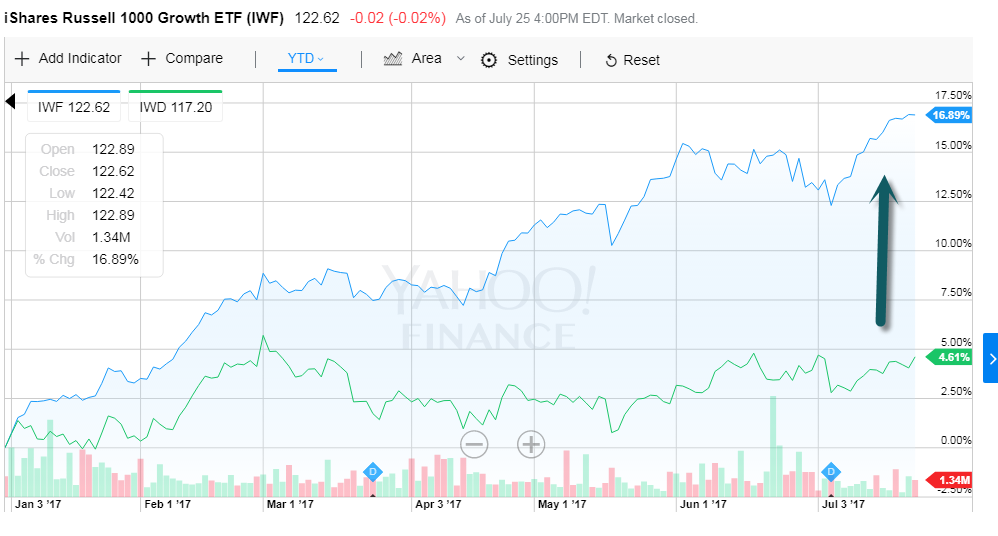
As Large Cap Growth has Dominated Market…Will they get another boost from weak dollar???  Tech sales 64% international

Barrons Story

The Bad News Buck

The dollar has declined against every major currency in 2017, and is down 11% against the euro, 6% against the yen and 5% against the pound sterling.

The buck has declined against every major currency in 2017; it’s down 11% against the euro, 7% against the yen, and 5% against the pound sterling. This boosts U.S. exports, pads the buying power of visitors, and has widespread impact in the stock market: Technology companies’ strong sales, nearly 60% of which are earned abroad, look even stronger when translated back into dollars. The 50 stocks in the Standard & Poor’s 500 index with the most overseas revenues surged 13.8% in the first half, versus 1.3% for the 50 with the most domestic sales, notes Bespoke Investment Group.

http://www.barrons.com/articles/the-bad-news-buck-1502505659

Continue reading →

Topley’s Top 10 – August 11, 2017

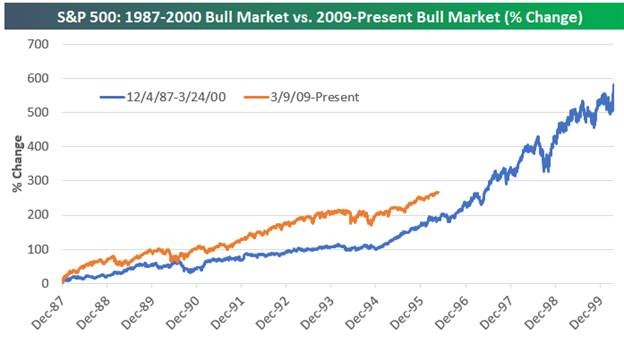
1. 2017 vs. 1999

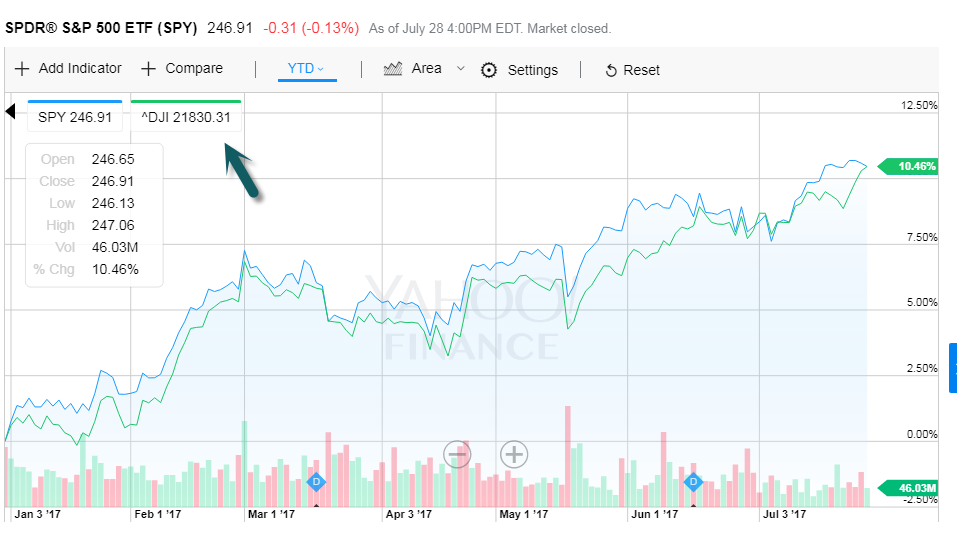
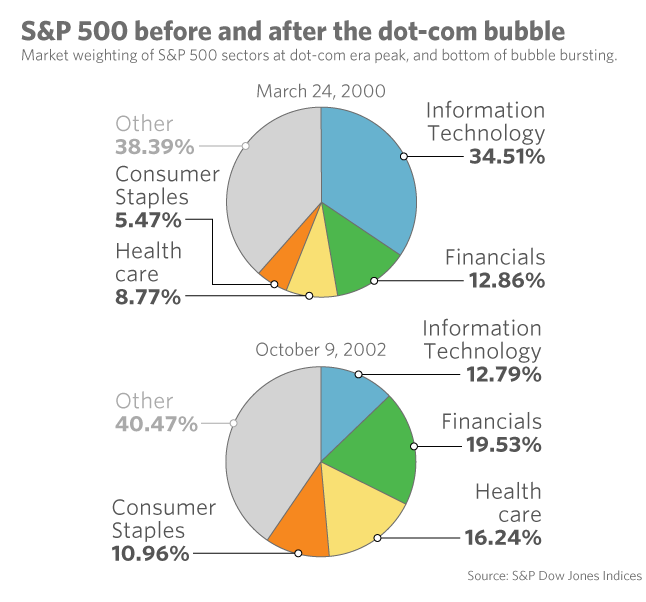
The market is fundamentally expensive but it’s not 1999 yet.

https://www.bespokepremium.com/think-big-blog/

See my blog post on comparisons to 1999


This long-running hot streak in the tech sector has led to forecasts of another 1999 bubble. It has sparked future doom from a host of soothsayers, who have been waiting for their gloomy predictions to come true since the global financial crisis ended in 2009. Since the crisis, today’s Wall Street Masters of the Universe are not the traders popularized in Michael Lewis’s original book “Liars Poker.” Nor are they the superstar investment bankers of the Internet boom. Instead, they’re a bunch of unknown hedge fund managers that predicted a crash in 2008 and made a fortune in its aftermath.  Since that event, headline grabbers on Wall Street have shifted from tireless cheerleaders of the rising bull market to pessimists predicting the next crash.

https://matttopley.com/category/quarterly/

Continue reading →

Topley’s Top 10 – August 4, 2017

 1.Bloomberg IPO Index Remains Sluggish

Aug 3, 2017

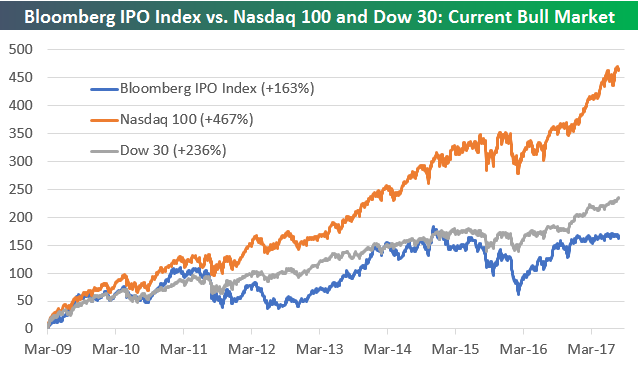
One index that hasn’t been participating in the market’s rally this year is the Bloomberg IPO Index, which is made up of companies that have IPOd within the past year.  We just wanted to show you a quick chart to highlight the weakness for IPO stock performance.

Below is a chart comparing the performance of the Bloomberg IPO Index to the Nasdaq 100 and the Dow Jones Industrial Average since the bull market began back in March 2009.  As shown, the Tech-heavy Nasdaq 100 is up by far the most at +467%, which might make you assume that IPOs would also be doing pretty well.  But even the Dow 30 has outperformed the IPO Index and by quite a bit at that!  Since the bull market began, the Dow is up 236% on a simple price return basis, while the IPO index brings up the rear in this group with a gain of just 163%.  Over the past year, the IPO index has basically traded completely sideways.

https://www.bespokepremium.com/think-big-blog/bloomberg-ipo-index-remains-sluggish/

Continue reading →

Topley’s Top 10 – July 27, 2017

First the important stuff…Who the Hell is Dead and Who is Alive in Thrones?

http://www.businessinsider.com/game-of-thrones-who-is-alive-and-dead-in-all-the-major-houses-2017-7/#jon-arryn-dead-51


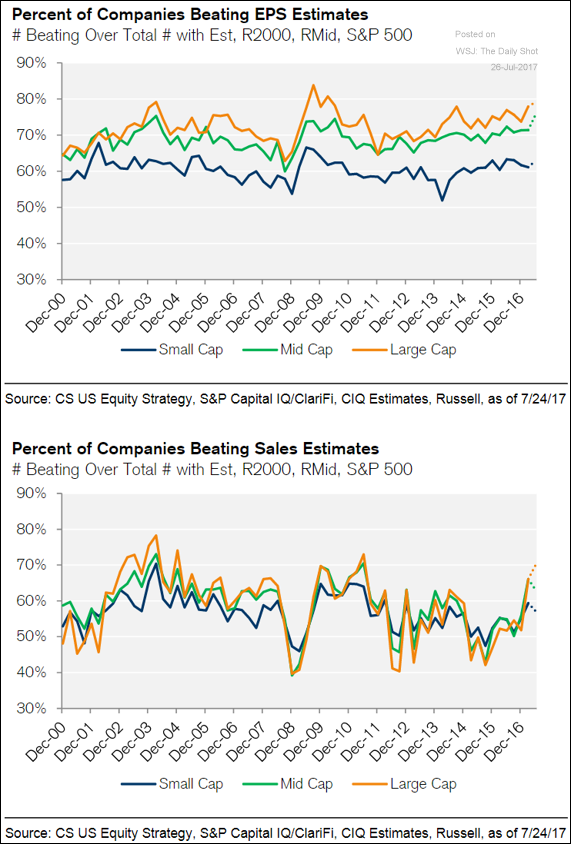
1.Earnings Update…Key to Maintaining the Bull.

Equity Markets: The charts below show the percentage of companies beating earnings and sales estimates, broken out by company size.

Source: Credit Suisse

  Continue reading →

Topley’s Top 10 – July 25, 2017

1.Tech Expensive?  Double Digits Earnings Growth and Highest Percentage of Names Exceeding Earnings.

Tech sector stocks: Growth at a reasonable price

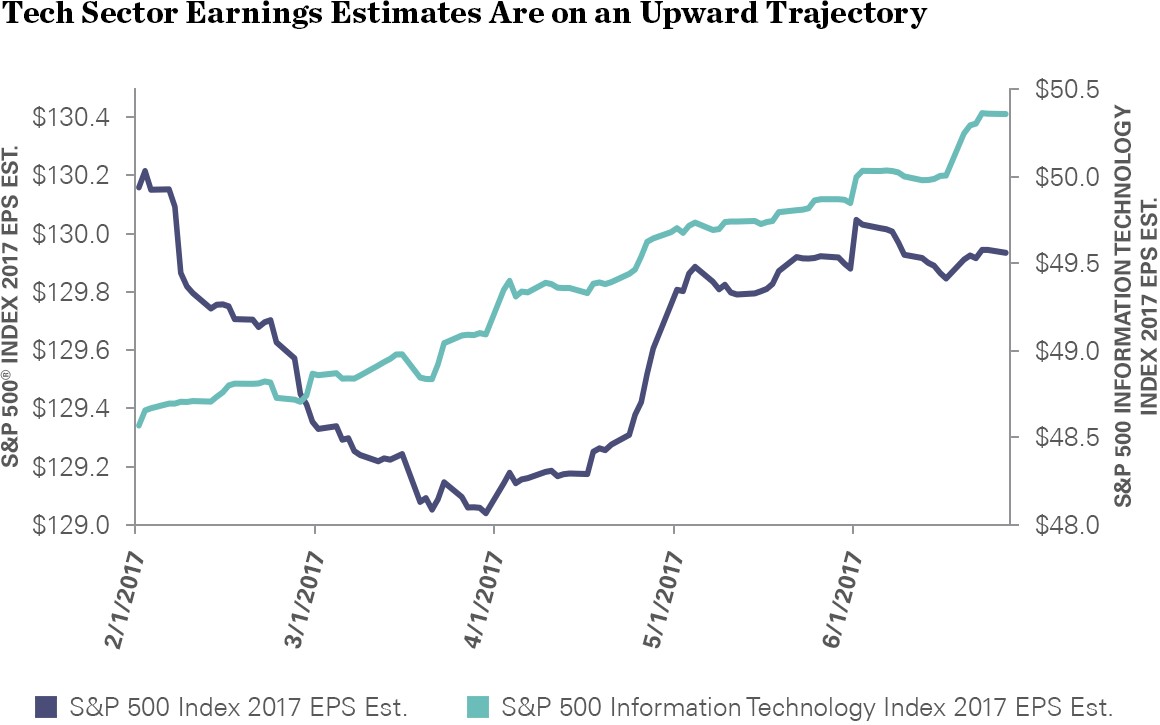
The tech sector posted double-digit earnings growth in the last two quarters, and it boasts the highest percentage of firms exceeding earnings expectations in the past four quarters among the 11 Global Industry Classification Standard (GICS) sectors.2

Such strong earnings growth momentum is expected to continue through 2017, evidenced by the rising earnings estimates shown in the chart below. The global economic environment is driving the sector’s growth prospects, as some of the headwinds the sector faced last year have turned into tailwinds. Since the tech sector has more foreign sales exposure than other sectors, it is more likely to benefit from the weaker US dollar and improving global growth we have seen this year.3


Source: Bloomberg Finance L.P., as of 6/27/2017. EPS estimates are based on consensus analyst estimates compiled by FactSet.

http://blog.spdrs.com/post/spotting-trends-despite-the-tech-sell-off-the-sector-still-offers-opportunity

Continue reading →

Topley’s Top 10 – July 18, 2017

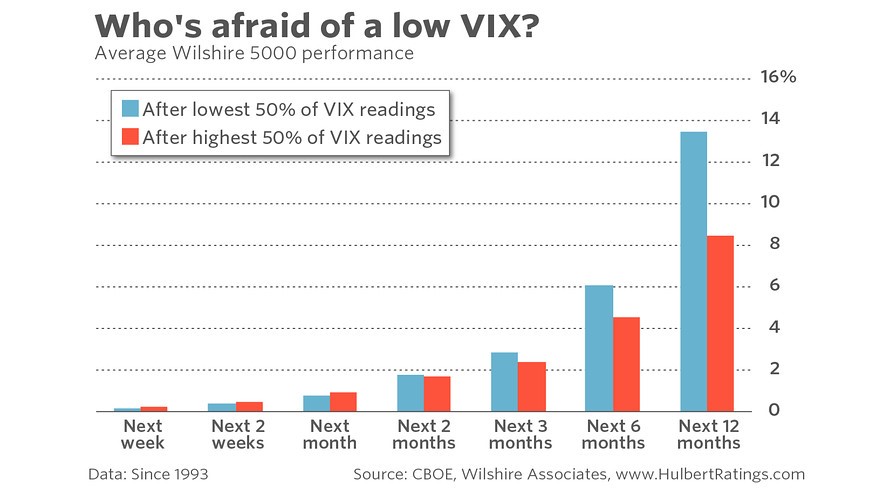
1. What Happens When the VIX Hits Record Lows.


This happy result is not an accident. Over the last three decades, the way to have made money from the VIX was to interpret it opposite to how a contrarian would—to be a contrarian’s contrarian, if you will. That at least is the conclusion of an academic study that is forthcoming in the prestigious Journal of Finance and written by two Yale finance professors, Alan Moreira and Tyler Muir. If the future is like the past, they convincingly show, you can safely invest in equities so long as the VIX remains low. You would reduce your equity exposure only when volatility spikes.

Mark Hulbert.

Read full story

http://www.marketwatch.com/story/the-shockingly-subdued-vix-doesnt-mean-what-you-think-it-means-2017-07-18


Continue reading →

Topley’s Top 10 – June 23, 2017

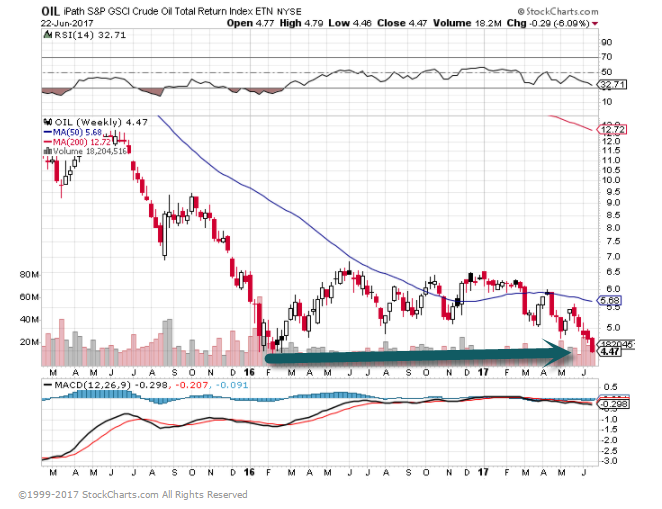
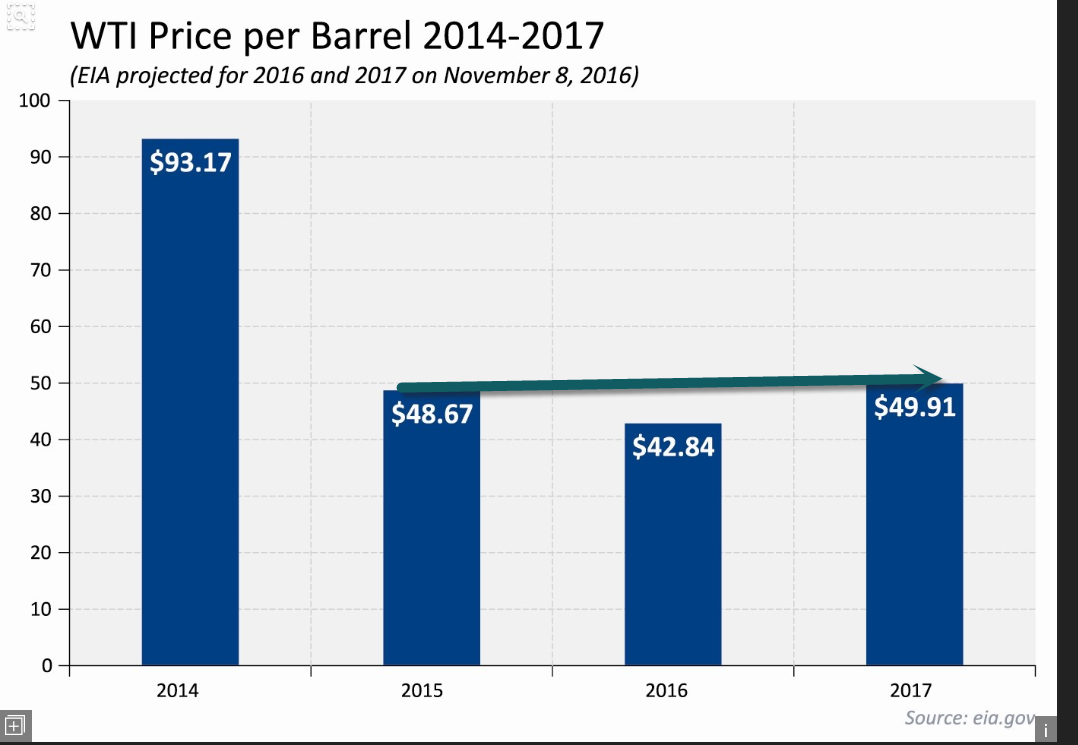
1.Oil Off to Its Worst Start Since in 20 Years.

So far this year, oil has lost 20 percent in value, its weakest performance for the first six months of the year since 1997.

Compliance with an agreement by the Organization of the Petroleum Exporting Countries and other producers to cut output by 1.8 million barrels per day from January reached its highest in May since the curbs were agreed last year.

Yet global inventories of both crude and refined products remain well above their long-term averages.


Oil ETF Right on 2016 Lows.

www.etfdailynews.com


Continue reading →

Topley’s Top Ten – June 20, 2017

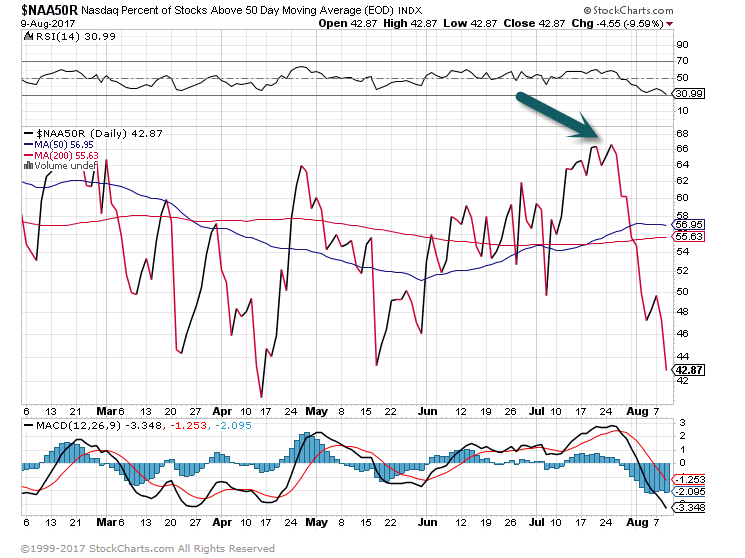
1.Market Breadth is Declining.

SPDR BLOG

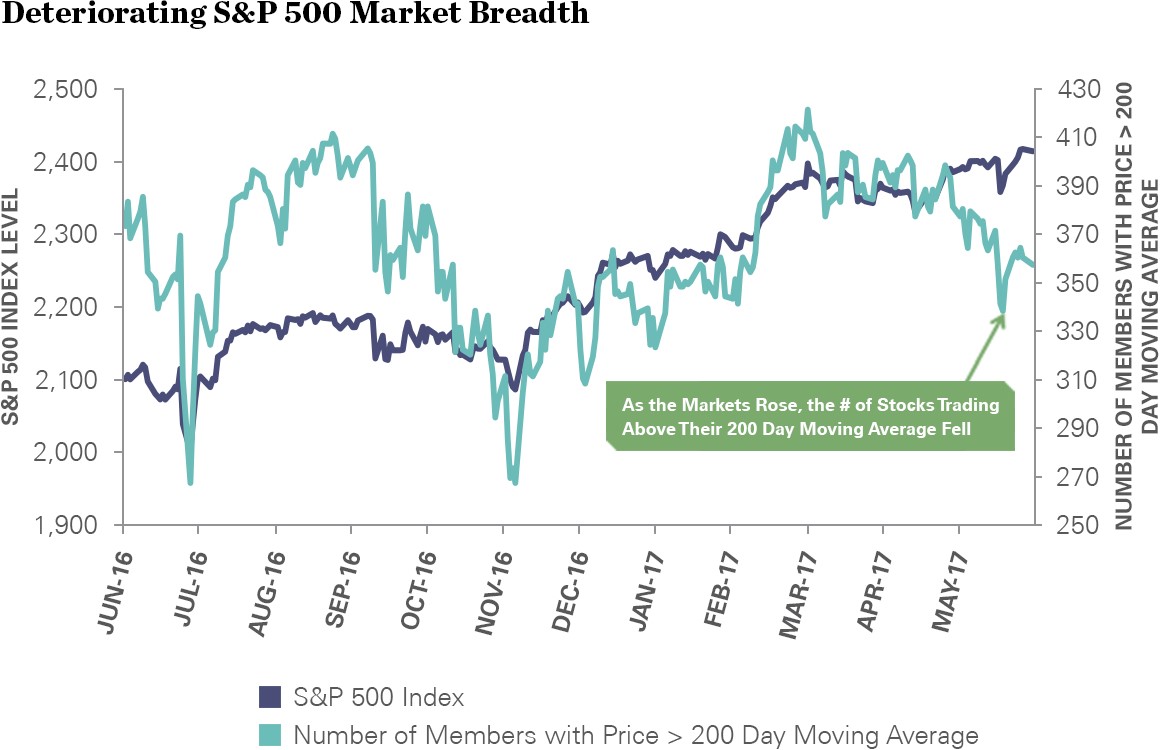
When market gains are being driven by a few stocks, it means the market’s breadth—the number of stocks moving higher in tandem—is narrowing. This not only indicates that a rally may be somewhat unsustainable, but it may also indicate a challenging time for active managers. When only a few securities lead the charge, it limits the power of individual stock pickers.

As shown above, the market keeps setting new highs while the number of stocks surging ahead (measured by the number of S&P 500 stocks trading above their 200-day moving average) is falling. This could signal rocky days ahead for a stock market looking to move higher


Source: Bloomberg Finance L.P., as of 5/31/2017.

Past performance is not a guarantee of future results. Index returns are unmanaged and do not reflect the deduction of any fees or expenses.

http://blog.spdrs.com/post/charting-the-market-5-charts-i-look-at-for-todays-complex-markets?WT.mc_id=em_SPDRInsider92017_June2017

Continue reading →

Topley’s Top Ten – June 13, 2017

1.SPDR Tech ETF Outflows …..Not “Crash” Level.

The SPDR Tech Select Sector ETF, which tracks tech companies in the S&P 500, saw a $560 million outflow on Friday, the biggest single-day removal since January 30, according to Bloomberg data. The trailing five-day outflow amounted to $737 million, which was the biggest weekly figure since the early 2016.

http://www.businessinsider.com/the-tech-stock-fairy-tale-is-heading-for-a-bad-ending-2017-6

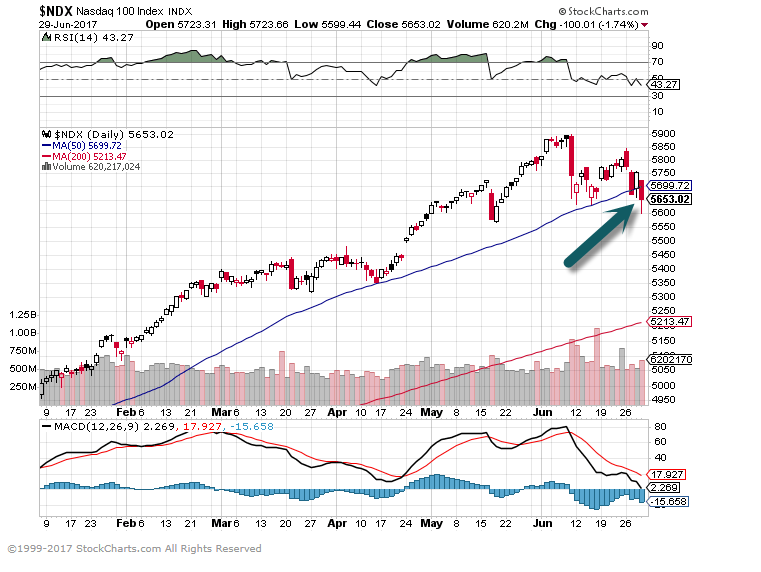
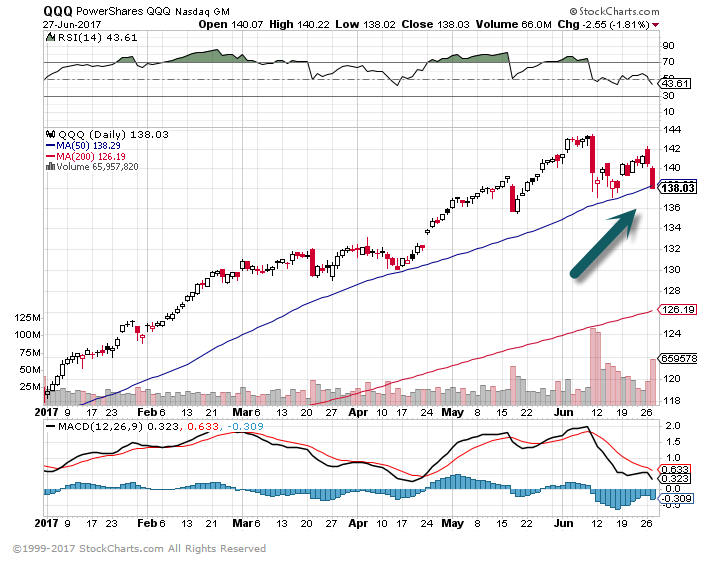
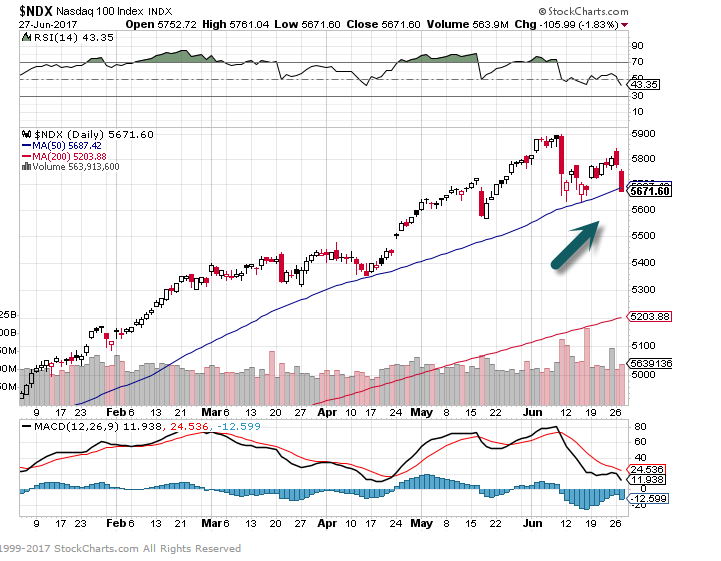
Nasdaq 100 Chart…..Pullback to 50day on good volume (2nd arrow)….Far from “crash” yet

Continue reading →

Daily Top 10 – May 26, 2017


On Vacation out of country next week, Top 10 sporadic at best.


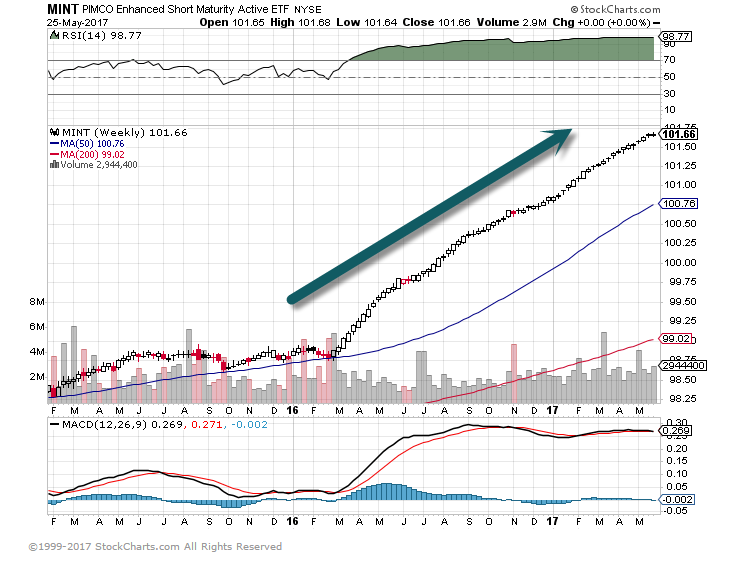
 1.Chart of Tech Bubble?  No Cash…Investors Pouring into Short-Term Fixed Income.

 The Most Hated Stock Bull Ever….MINT short-term assets doubled in 1 year.

In recent months, this “use for cash” story has been playing out strongly in the ETF space, as retail and institutional investors pour assets into ultra-short-dated bond funds.

These ETFs are considered alternative cash management tools because they typically deliver higher income than money market mutual funds. They are also good risk management tools for investors worried about interest rate risk.

And they can even be a type of defensive play if you want to have cash at hand in the event of a market sell-off—these ETFs offer strong daily liquidity, as in quick access to that cash.

MINT Has Doubled In Size

The most popular of these strategies, the PIMCO Enhanced Short Maturity Active ETF (MINT), is almost twice as big today as it was a year ago, with almost $7 billion in total assets. It has seen tremendous growth.
So far this year, MINT has attracted more than $1.3 billion in net creations, making it the largest actively managed ETF.
Other ETFs in this segment benefiting from this demand include the iShares Short Maturity Bond ETF (NEAR), gathering some $255 million year-to-date, and growing to become a $2.5 billion fund—now the market’s third-largest actively managed ETF.

http://www.etf.com/sections/features-and-news/etf-investors-looking-park-cash

Continue reading →

Topley’s Top Ten – May 26, 2017

On Vacation out of country next week, Top 10 sporadic at best.


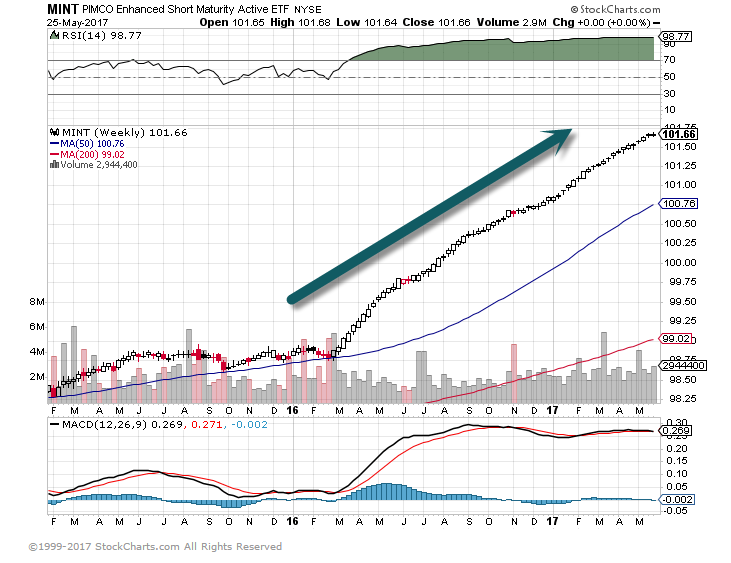
1.Chart of Tech Bubble? No Cash…Investors Pouring into Short-Term Fixed Income.

The Most Hated Stock Bull Ever….MINT short-term assets doubled in 1 year.


In recent months, this “use for cash” story has been playing out strongly in the ETF space, as retail and institutional investors pour assets into ultra-short-dated bond funds.

These ETFs are considered alternative cash management tools because they typically deliver higher income than money market mutual funds. They are also good risk management tools for investors worried about interest rate risk.

And they can even be a type of defensive play if you want to have cash at hand in the event of a market sell-off—these ETFs offer strong daily liquidity, as in quick access to that cash.

MINT Has Doubled In Size

The most popular of these strategies, the PIMCO Enhanced Short Maturity Active ETF (MINT), is almost twice as big today as it was a year ago, with almost $7 billion in total assets. It has seen tremendous growth.

So far this year, MINT has attracted more than $1.3 billion in net creations, making it the largest actively managed ETF.

Other ETFs in this segment benefiting from this demand include the iShares Short Maturity Bond ETF (NEAR), gathering some $255 million year-to-date, and growing to become a $2.5 billion fund—now the market’s third-largest actively managed ETF.

http://www.etf.com/sections/features-and-news/etf-investors-looking-park-cash

Continue reading →

Topley’s Top Ten – May 15, 2017

Next FBI Director Pop.

He attended Merrillville High School and graduated in 1970 from the United States Air Force Academy. He played basketball for four seasons at the Academy and in his senior year was the team captain and the leading scorer.[5] He graduated with a bachelor’s degree in Soviet Studies, and he underwent Air Force intelligence gathering and processing training.[6] At one point, Popovich considered a career with the Central Intelligence Agency.[7]

Popovich served five years of required active duty in the United States Air Force, during which he toured Eastern Europe and the Soviet Union with the U.S. Armed Forces Basketball Team. In 1972, he was selected as captain of the Armed Forces Team, which won the Amateur Athletic Union (AAU) championship. This earned him an invitation to the 1972 U.S. Olympic Basketball Team trials.

https://en.wikipedia.org/wiki/Gregg_Popovich

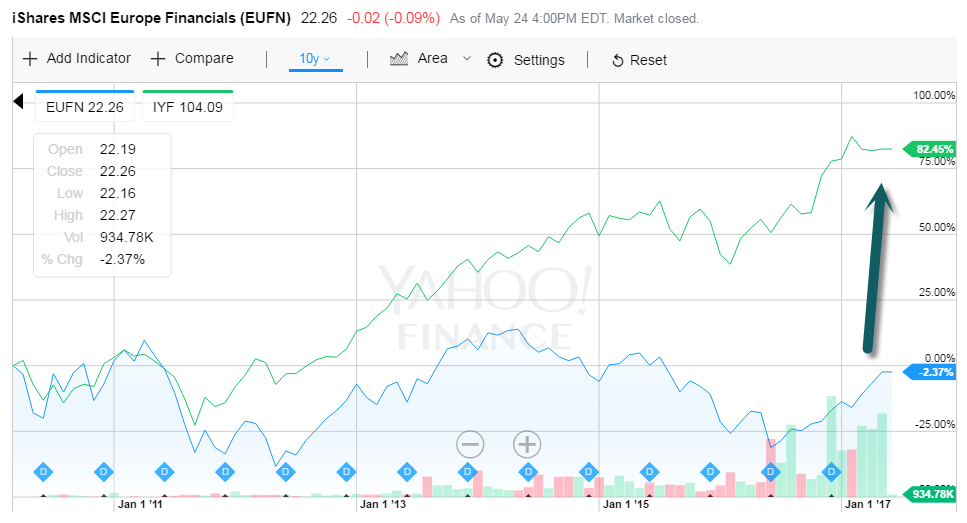
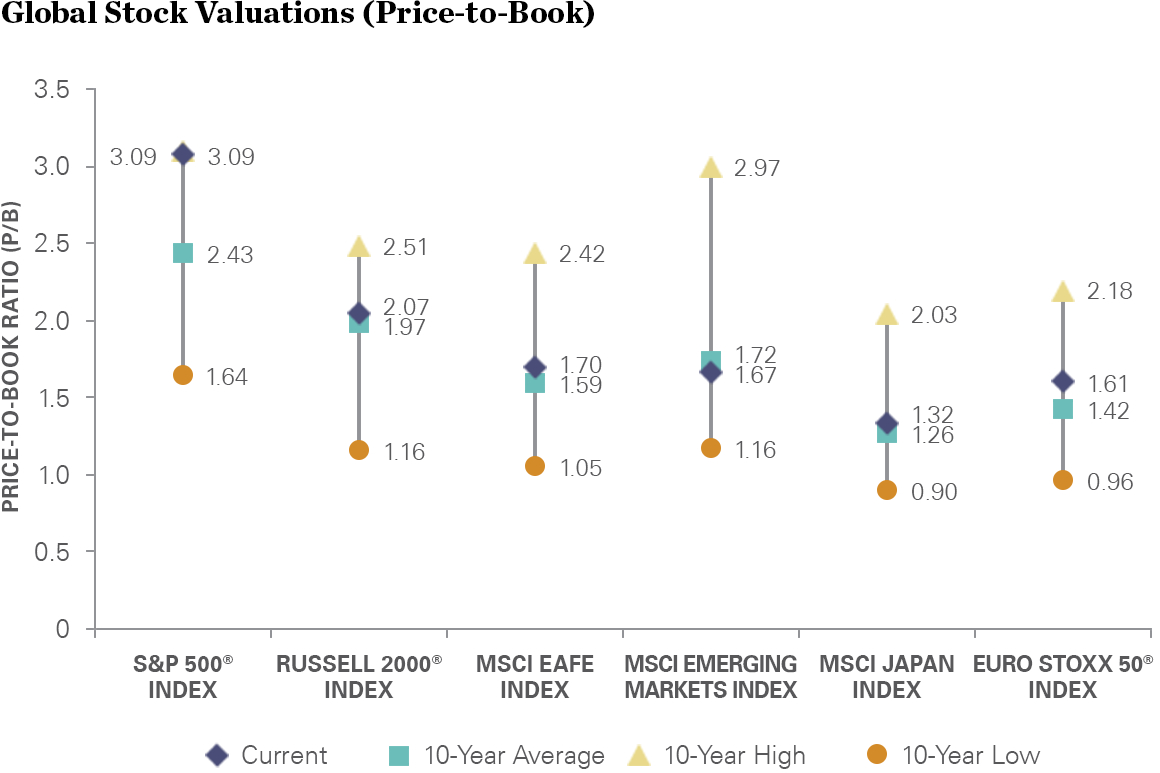
1.EAFE profits remain 45% below their prior peak, notes Doug Ramsey, chief investment officer of the Leuthold Group.

 Investors poured roughly $6 billion into European equities last week

http://www.businessinsider.com/money-pouring-into-european-stocks-at-record-pace-2017-5

From Barrons

Industry analysts look for EAFE earnings to increase by 18% to 19% this year, compared with an estimated gain of 10% in U.S. profits. While this rise comes off a low base for overseas stocks, it’s the direction and momentum that count most for investors. “We are in a normalization period” in which EAFE earnings will catch up with the U.S., says Savita Subramanian, head of U.S. equity and quantitative strategy at Bank of America Merrill Lynch. Subramanian recommends underweighting the S&P 500 relative to other markets, and notes that positive earnings revisions have been more numerous lately in Europe and Japan than the U.S.

http://www.barrons.com/articles/europe-on-sale-time-to-buy-foreign-stocks-1494648930?mod=BOL_twm_ls&tesla=y

Continue reading →

Topley’s Top Ten – May 9, 2017

1.The Dividend Bull Market Has Pushed Valuations to Record Levels.

Larry Swedroe Weighs In…
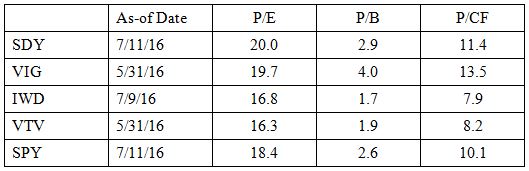
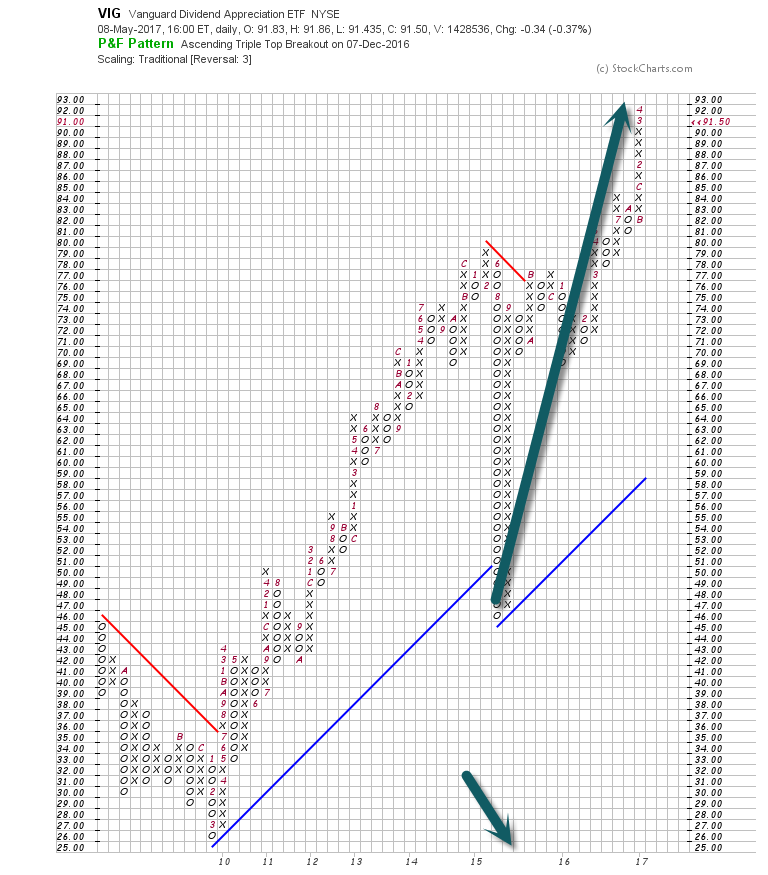
The table below shows three value metrics—price-to-earnings (P/E), price-to-book value (P/B) and price-to-cash flow (P/CF)—for two of the market’s most popular dividend strategies: the SPDR S&P Dividend ETF (SDY), with more than $14 billion in assets under management (AUM), and the Vanguard Dividend Appreciation ETF (VIG), with more than $22 billion in AUM. Data is as of July 13, 2016. VIG buys the stocks of companies with rapid growth in their dividends.

The table also shows the two large-cap value ETFs with the most AUM, the iShares Russell 1000 Value ETF (IWD) and the Vanguard Value ETF (VTV). Finally, I’ll compare the value metrics of these funds with that of the SPDR S&P 500 ETF (SPY). As you review the data, remember that the lower the price metric, the higher the expected return. Data is from Morningstar.

The above data makes clear that the popularity of the two dividend strategies (SDY and VIG) has led to a rise in the prices of these stocks and reduced their expected returns. No matter which value metric we look at, the expected returns for both SDY and VIG are now well below the expected returns of the two large value strategies, and also below that of the S&P 500 ETF. It’s an example of the curse of popularity, and what happens when a trade gets “crowded.” Forewarned is forearmed.

Larry Swedroe on Dividends
http://www.etf.com/sections/index-investor-corner/swedroe-irrelevance-dividends?nopaging=1

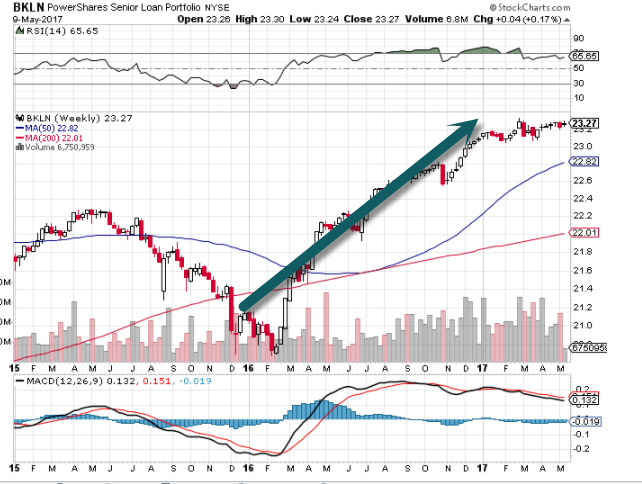
Dividend Stocks Have Doubled Since Pullback in Mid-2015

www.stockcharts.com

Continue reading →

Topley’s Top Ten – Short Version May 3, 2017

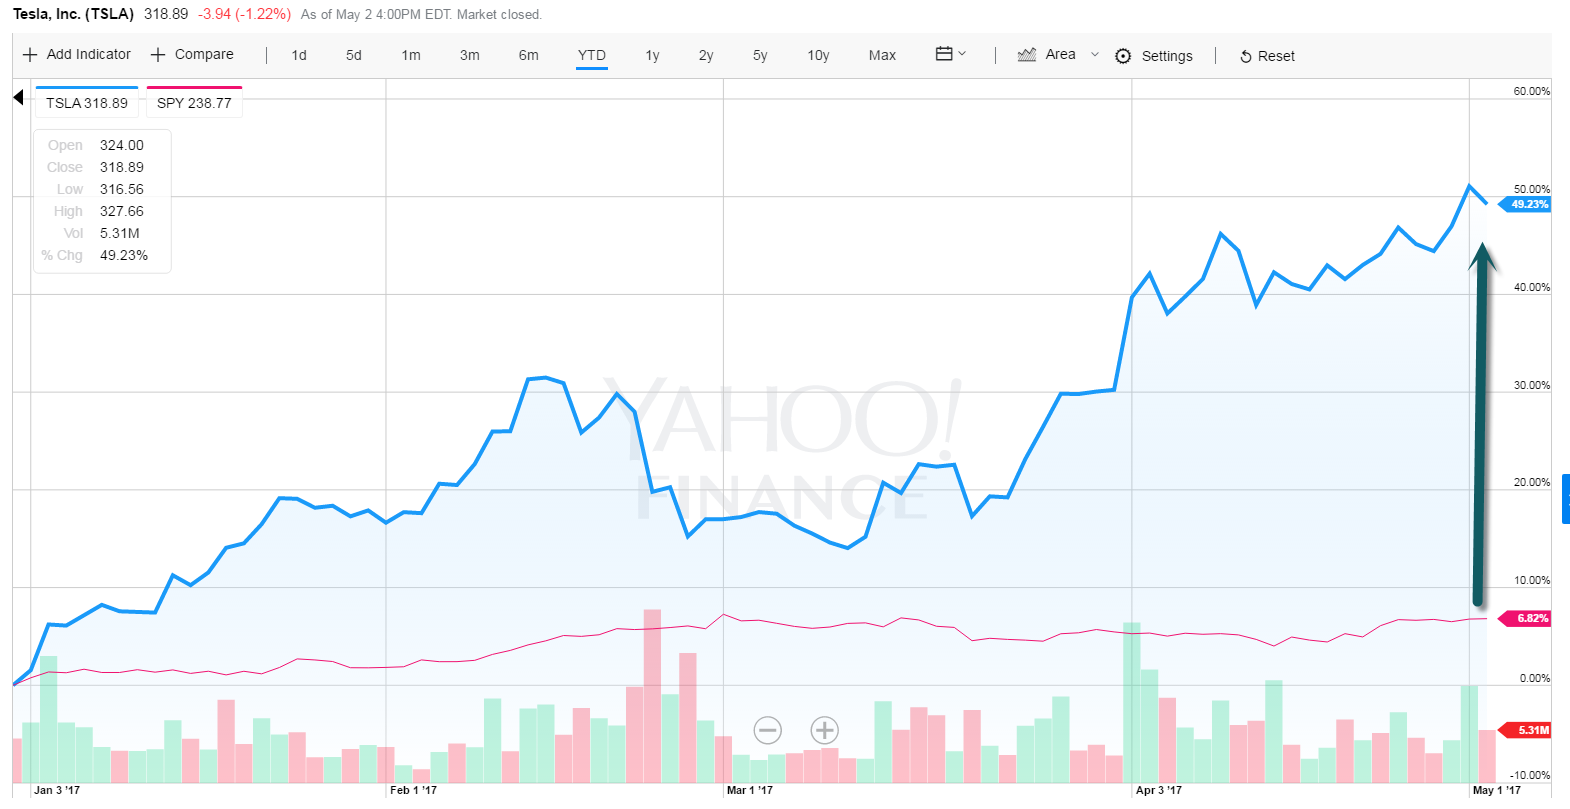
1.TSLA is Turning into Ice Juice for the Biggest Shorts on Wall Street.  TSLA +49% YTD.

Traders short selling Tesla’s (TSLA.O) soaring stock have lost $3.7 billion this year, eclipsing the combined losses of traders shorting Apple (AAPL.O), Amazon.com (AMZN.O) and Netflix (NFLX.O)

TSLA +49% vs. S&P +7%

www.yahoofinance.com
http://www.reuters.com/article/us-tesla-stocks-idUSKBN17Y29O

Continue reading →

Topley’s Top Ten – May 2, 2017

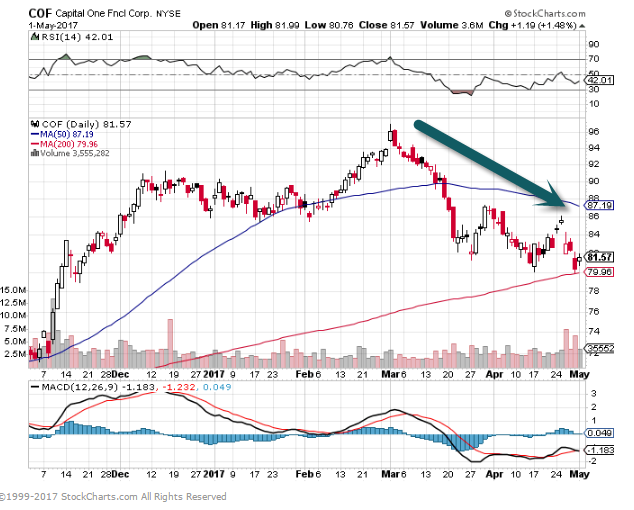
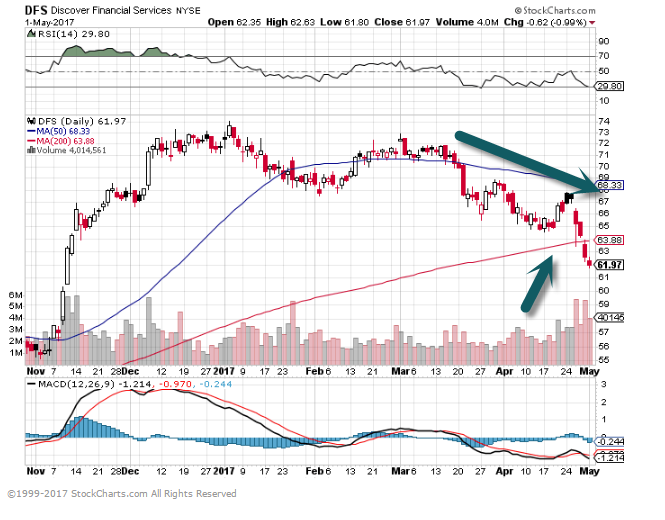
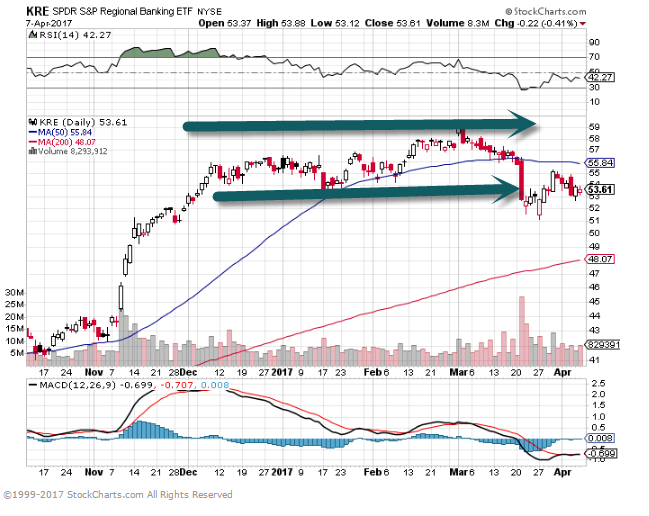
1.As Consumer Discretionary Stocks Continue Upwards…Credit Card Companies Sell Off??? Loan Loss Provisions Rise??

Synchrony, Capital One, and Discover – a gauge of how well over-indebted consumers are managing to hang on – have together increased their Q1 provisions for bad loans by 36% year-over-year.

Capital One 15% Off Highs.

Discover 15% Off Highs….Breaks 200day on Heavy Volume.

Wolf Street Read on Bad Debt at BI
http://www.businessinsider.com/us-consumer-debt-is-piling-up-2017-5

Continue reading →

Topley’s Top Ten – May 1, 2017

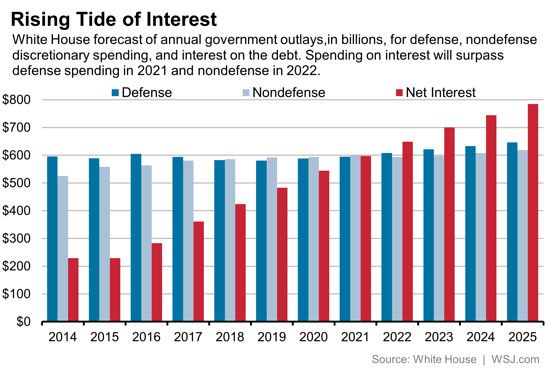
1.Why aren’t Interest Rates Rising? Government’s Biggest Cost Will Soon Be Interest on Debt.

We have actually been blessed by this decline in interest rates in the United States. In 2000, the total interest cost of servicing the federal debt was $360 billion, based on a blended interest rate on government bonds of 6%. Today, the blended interest rate is 2.1% and the total interest cost is $400 billion, only $40 billion more on a debt burden three times the size of its 2000 level. If interest rates on government securities rise 1%, the cost of debt service would increase almost $200 billion, offsetting most of the budget cuts being proposed by the Trump administration
Byron Wien Full Read Below
http://www.barrons.com/articles/byron-wien-the-scary-signal-of-the-bond-market-1493417352

Continue reading →

Topley’s Top Ten – Short Friday Version – April 28, 2017

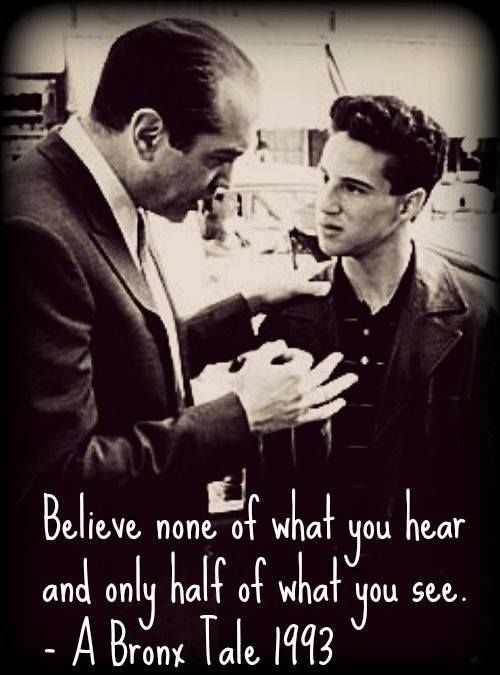
“A Bronx Tale” is on all week so I can’t help but watch some before bed each night. Who knew Sonny had such great advice for Wall Street?

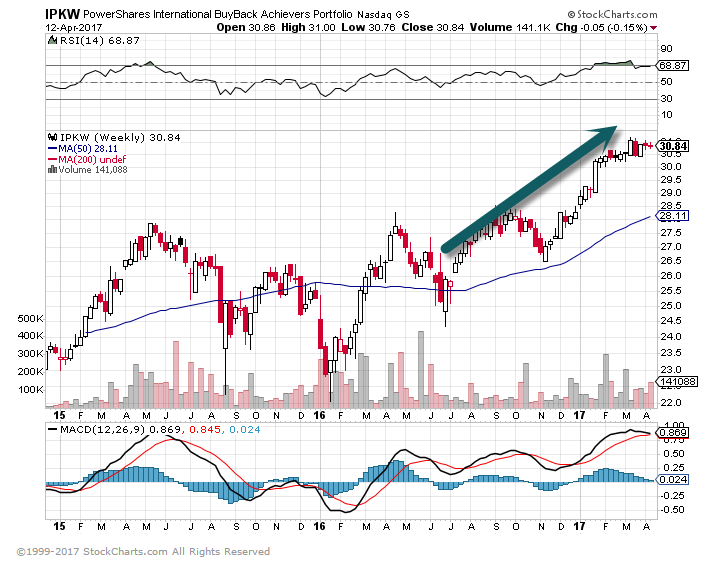
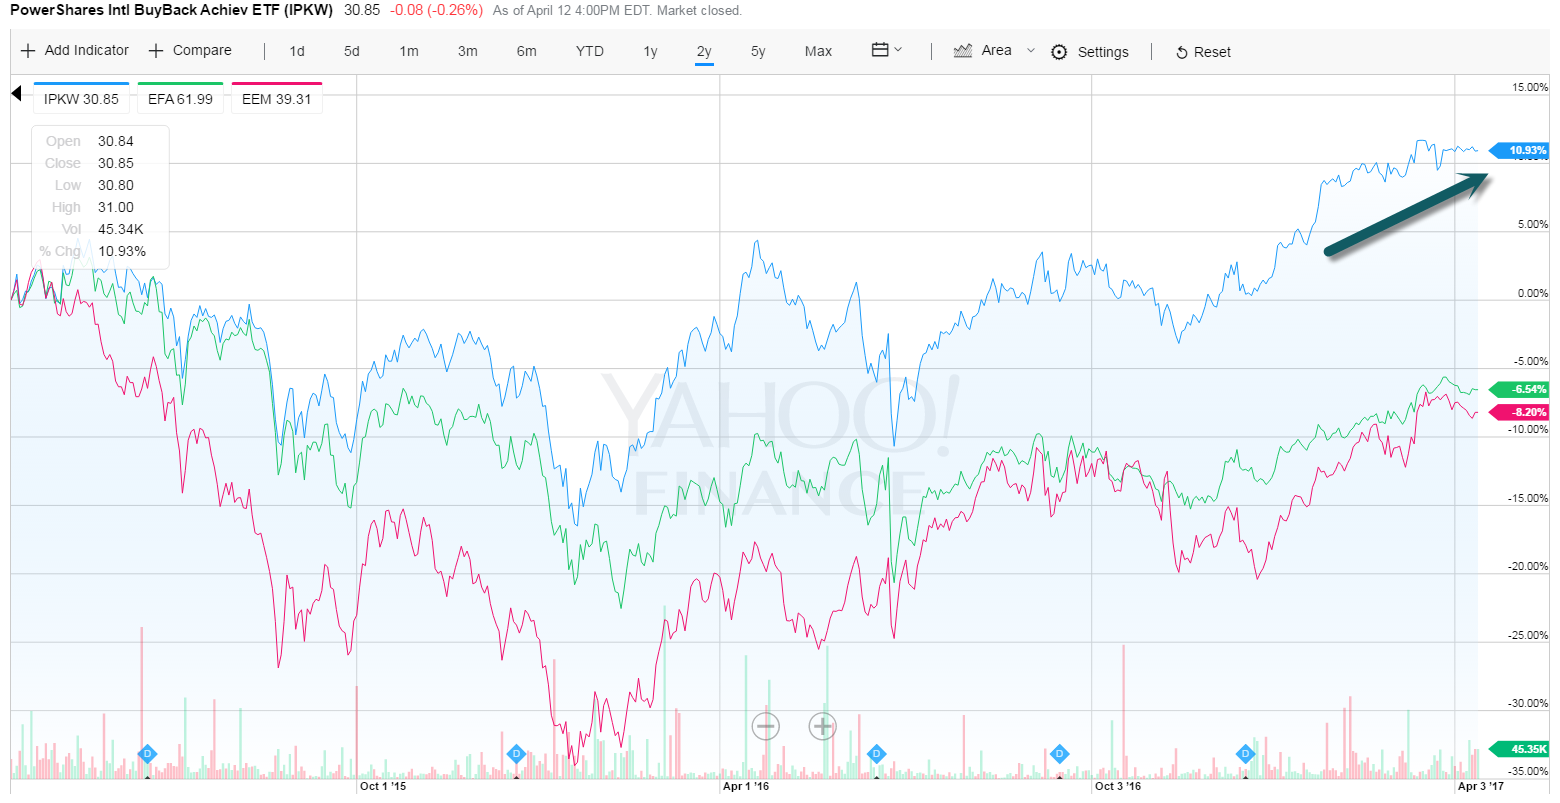
1.Top 10 Spends a Fair Amount of Space on Buybacks…..Buybacks Peaked and Market Keeps Humming!

Josh Brown-The Reformed Broker.
The truth is, however, that buybacks may have peaked for the cycle a year or two ago. Which, if you’re blaming monetary policy for their prevalence, would make sense. The Fed’s tapering off of monthly QE began in 2014, and the Fed Funds hikes began in December of 2015. We’ve been in a tightening environment – in both word and deed – for three years now.
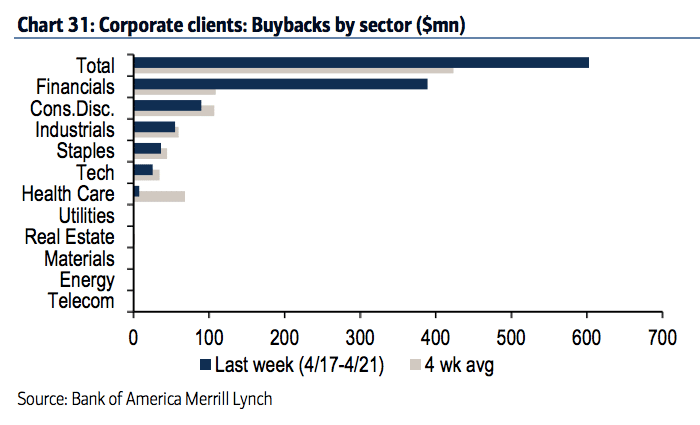
Bank of America looks at its corporate clients’ buyback activity and finds quite a drop-off year-to-date:
Buybacks by our corporate clients picked up last week to typical April levels, but year-to-date are tracking their lowest of any comparable period since 2013 and are down nearly 30% YoY—suggesting less of a boost to corporate EPS from buybacks.

Chart o’ the Day: Remember Buybacks?

Another Bear Scare Gets Put in the Bathroom

“Put him in the bathroom” A Bronx Tale

Continue reading →

Topley’s Top Ten – April 18, 2017

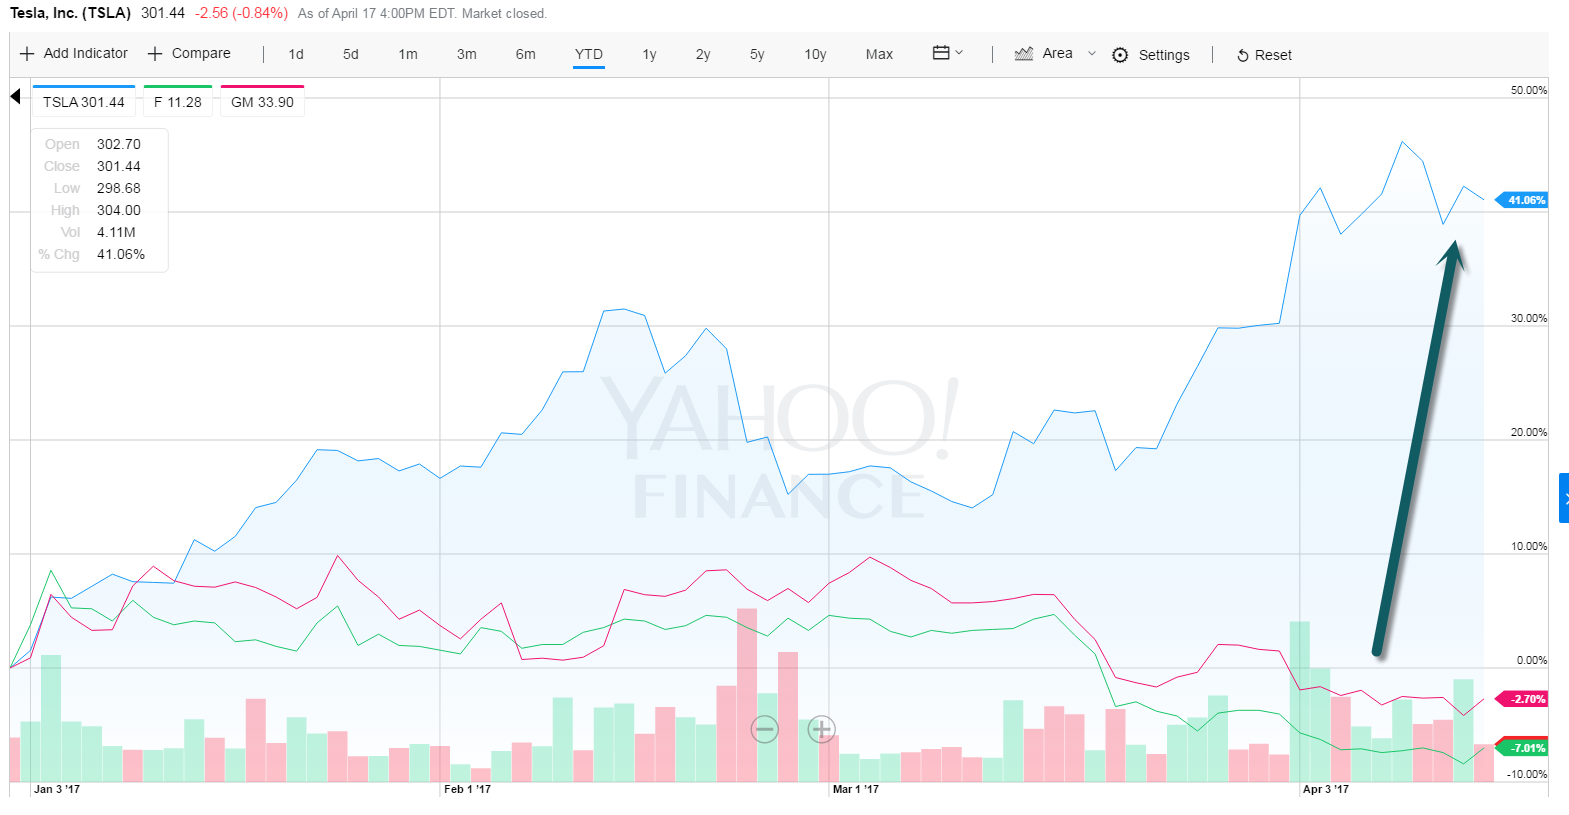
1.Ford and GM have Two of the Lowest P/E’s in S&P…..TSLA +41% YTD vs. F-GM Negative…..TSLA Trading at 271x Earnings.

Ford has the fifth-lowest price/earnings ratio in the S&P 500. The absolute lowest belongs to rival General Motors, which at $34, trades for under six times projected 2017 earnings. Barron’s has written favorably on GM, including in an article earlier this year (“GM Shares Could Drive 35% Higher,” Feb. 18), when GM traded around $37.
http://www.barrons.com/articles/ford-shares-are-too-cheap-1492229293

TSLA vs. U.S. Carmakers.

www.yahoofinance.com

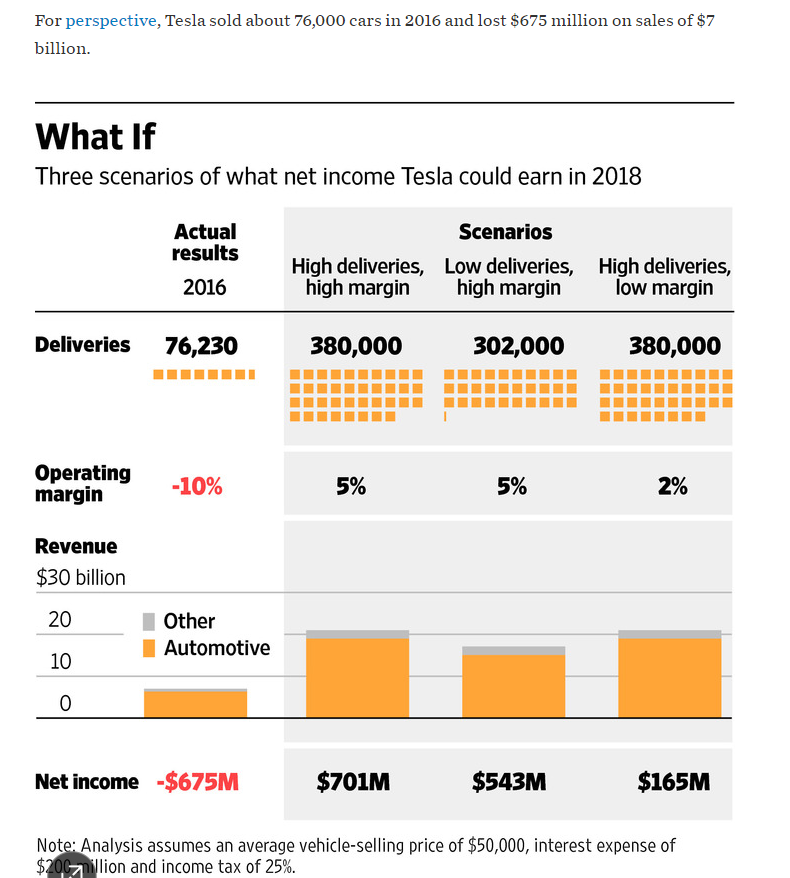
TSLA Lost $675 million in 2016


Read Full Story at WSJ

https://www.wsj.com/articles/what-is-tesla-really-worth-1492365561?tesla=y

Continue reading →

Topley’s Top Ten – April 17, 2017

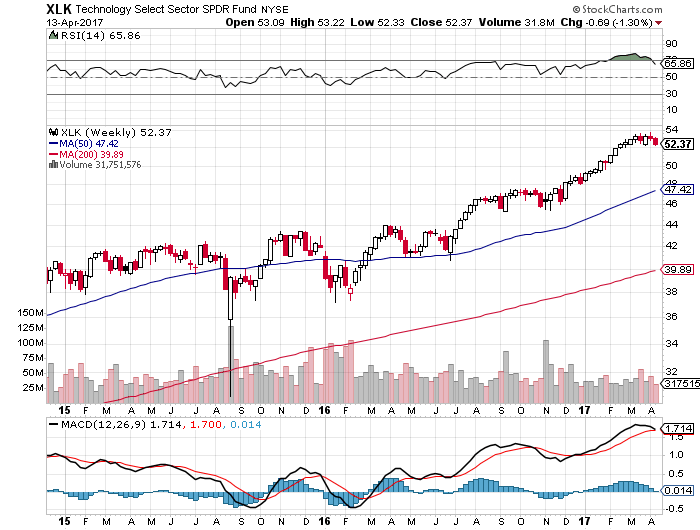
1.Leading Sector in 2017 Tech Finishes Down 10 Days in a Row. XLK +8.29% YTD vs. S&P +4%

The Standard & Poor’s 500 Information Technology Index has finished lower 10 days in a row, only the fourth such streak since 1989, when daily data on the sector was first posted, according to Bespoke Investment Group.
Barrons
http://www.barrons.com/articles/stocks-slip-1-on-week-as-geopolitical-worries-grow-1492229480

Continue reading →

Topley’s Top Ten – April 14, 2017

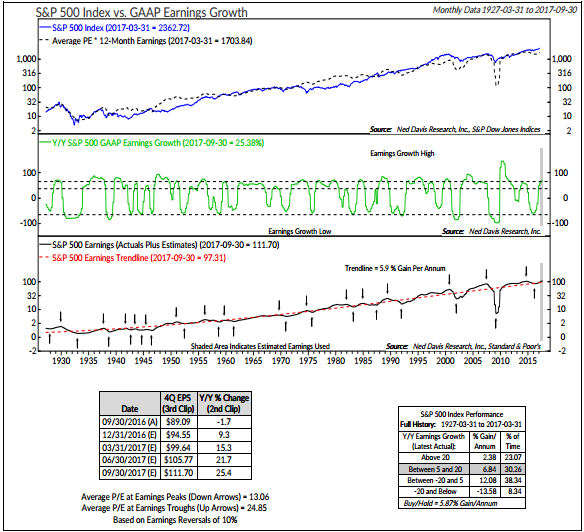
1.15% Year Over Year GAAP Earnings Growth is Higher than All but Three Previous Bull Market Peaks.

FUNDAMENTAL
Last year’s earnings rebound appears to be continuing in 2017. The 15% year/year growth in S&P 500 GAAP EPS is higher than at all but three previous bull market peaks and dividend growth remains above average. We are skeptical, however, that earnings will grow as fast as consensus suggests, as year/year comps become more difficult, earnings momentum will likely slow, leaving the market left with both elevated expectations and valuations.
Ned Davis

www.ndr.com

Continue reading →

Topley’s Top Ten – April 11, 2017

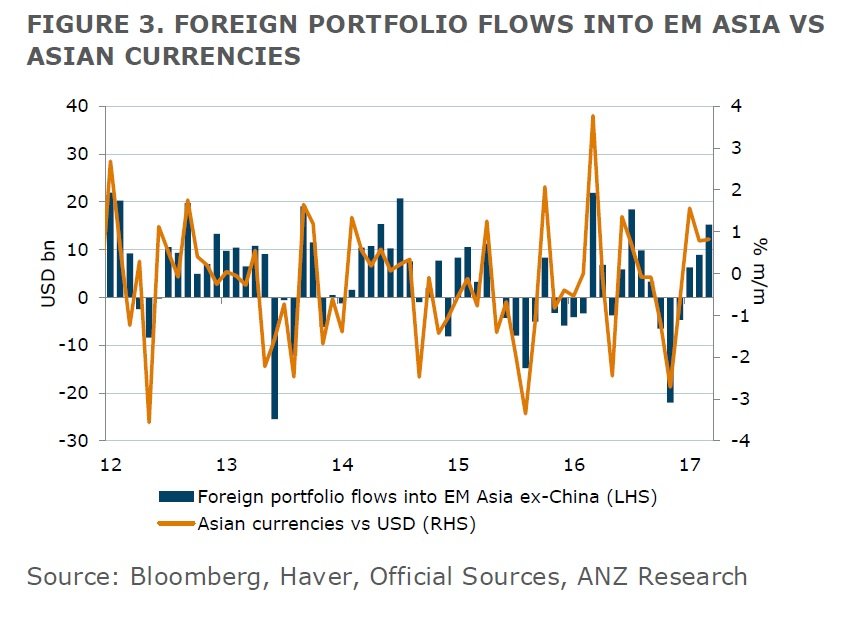
1. Foreign capital is flocking back to emerging markets in Asia

David Scutt, Business Insider Australia
Foreign capital is flooding back to emerging markets across Asia, particularly for stocks.

According to new research released by ANZ today, capital inflows to the region rose to $US15.3 billion in March, the largest one-month increase since the middle of last year.

It was the third consecutive month that net inflows were recorded, all but unwinding similarly large outflows seen in the final three months of last year.

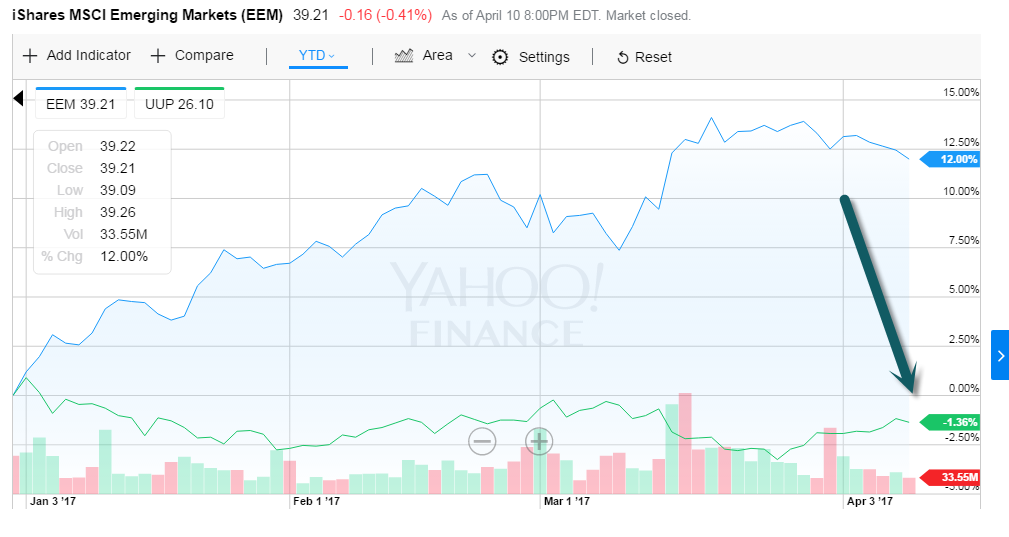
As this excellent chart from ANZ demonstrates, continued weakness in the US dollar against currencies in the region was probably a contributing factor behind the pickup in capital flows to the region.

http://www.businessinsider.com/foreign-capital-is-flocking-back-to-emerging-markets-in-asia-2017-4

Dollar Weakens and Emerging Markets Strenghten….Dollar (UUP) -1.36% YTD vs. Emerging Markets +12%

www.yahoofinance.com

Continue reading →

Daily Top Ten – March 29, 2017

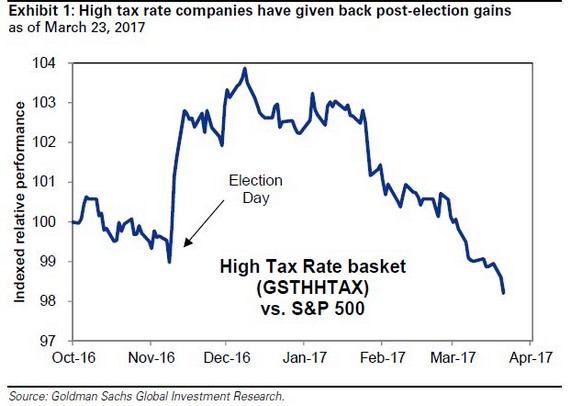
1.Trump Trader Reversal….Tax Cut Basket Gives Back All Gains.

Equity Markets: According to the next chart, the markets seem to be giving up on US corporate tax cuts. It shows that a broad basket of companies paying the highest tax rates has reversed all of its post-election outperformance and then some. The stock market doesn’t see these firms in a lower-tax regime anytime soon

Source: @tracyalloway

Continue reading →

Daily Top Ten – March 27, 2017

1.U.S. Stocks Vs. International…Big Spreads.

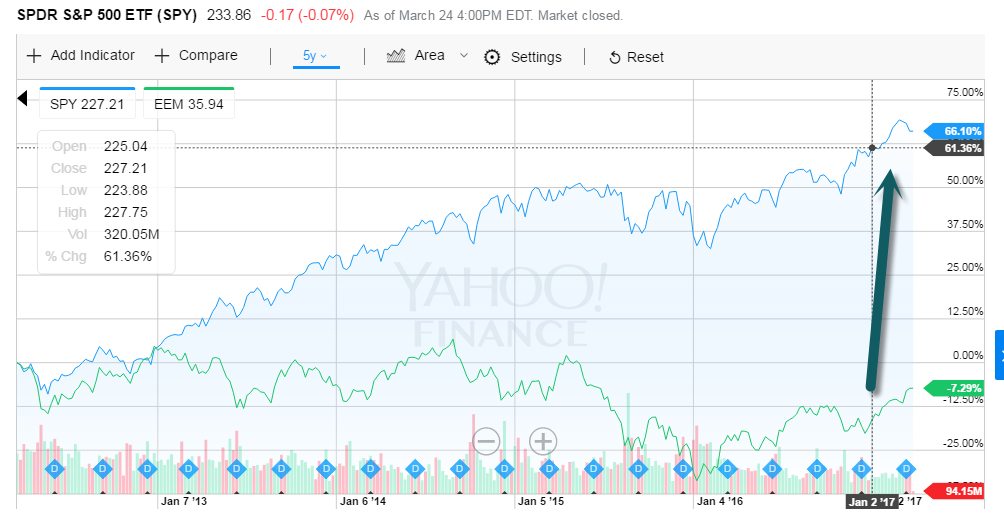
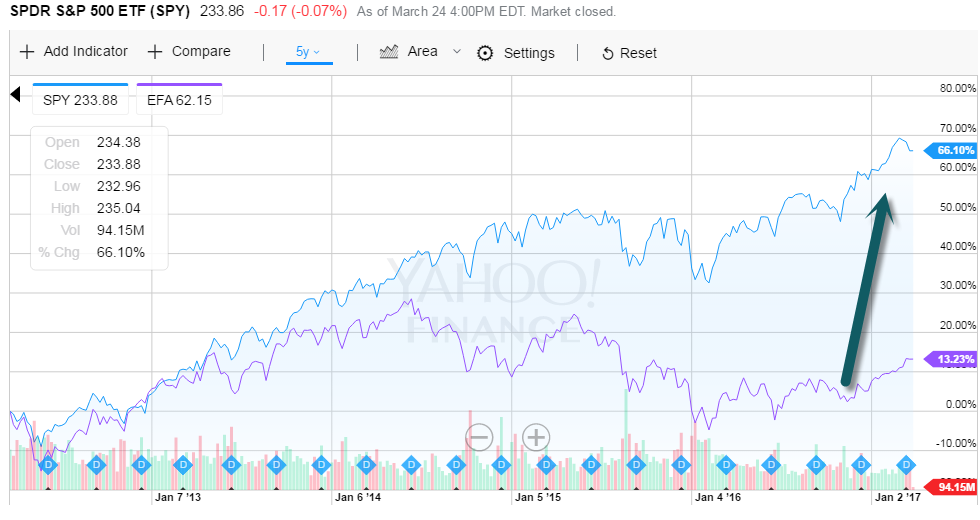
Since the 2009 bear-market low, the SPDR S&P 500 exchange-traded fund (ticker: SPY) has shimmied up 244%, outgunning the 96% gain in the iShares MSCI All Country Ex-U.S. ETF (ACWX), and 93% for the iShares MSCI Emerging Markets ETF (EEM).

5 Year Chart…S&P +66% vs. EEM -7%

5 Year Chart S&P +66% vs. International Developed +13%

www.yahoofinance.com

Continue reading →

Daily Top Ten – March 20, 2017

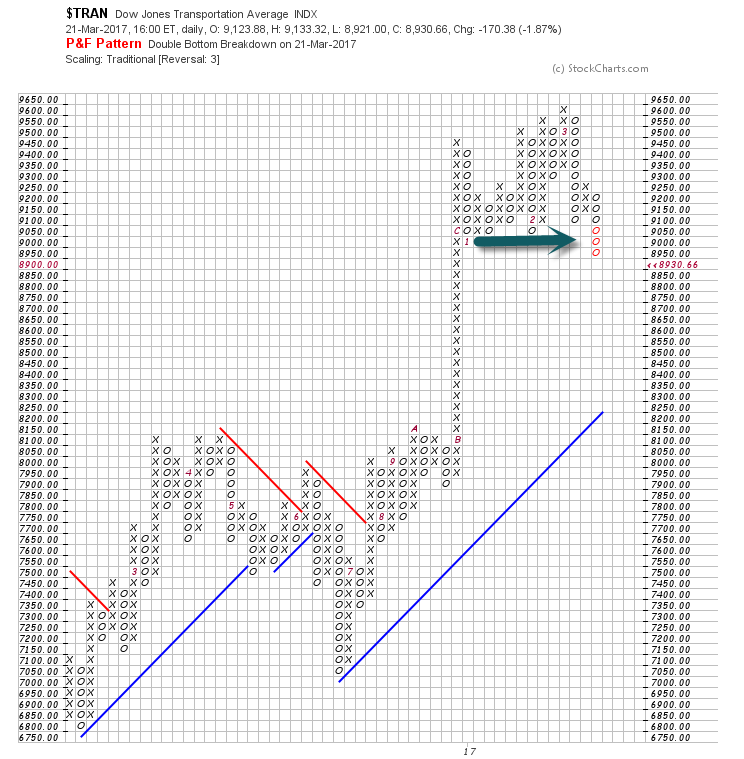
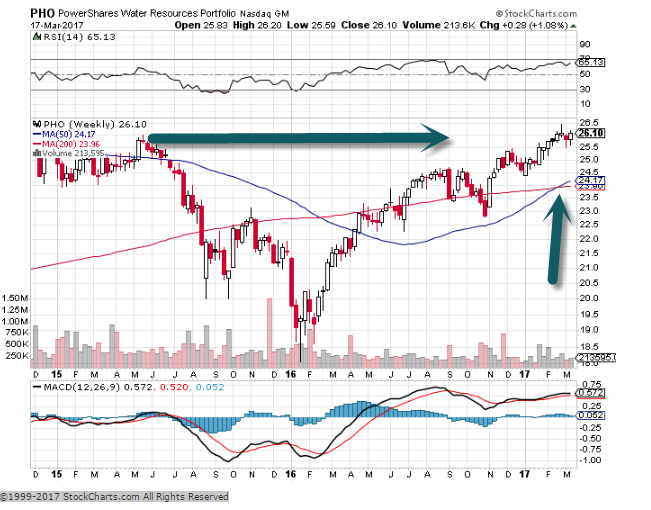
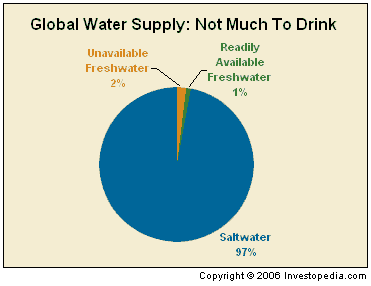
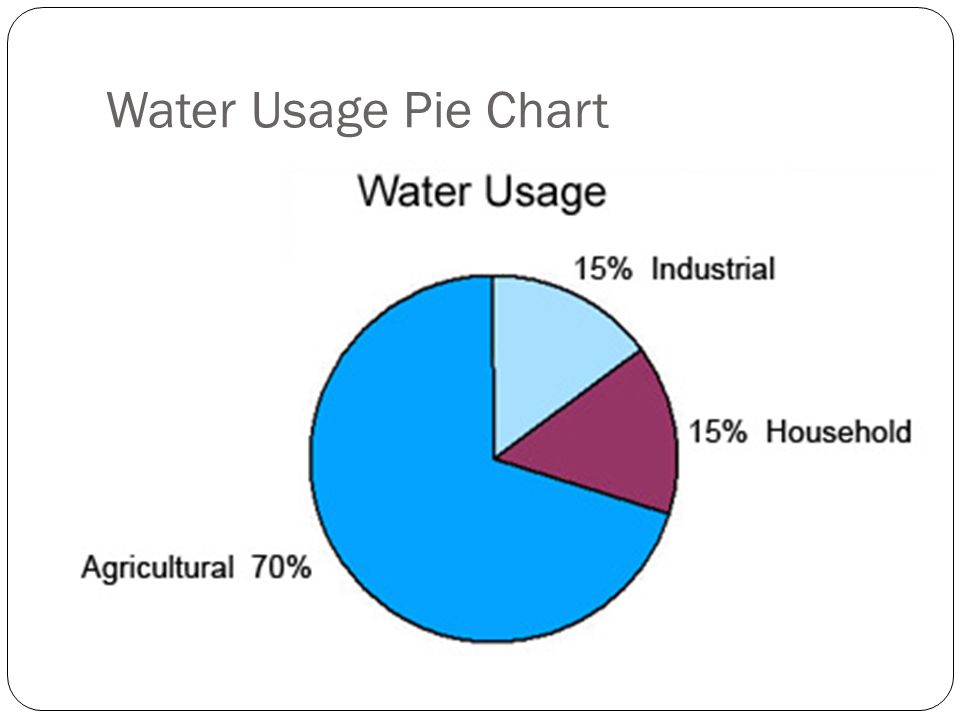
1.Water ETF Breaking to New Highs….The World Needs More Fresh Water.

PHO Water ETF…New Highs 50day thru 200day to Upside.

How to Invest in Water: 5 Picks
Analysts and money managers see a wave of water-related investments ahead. But there isn’t a single dominant company to bet on.
Today, for instance, the PowerShares Water ETF trades at 23.1 times trailing 12 month earnings—a tad richer than its median over the past decade, but well shy of the peak of 28.1 times. Compare this with, say, the Industrial Select Sector SPDR ETF (XLI), which is already straining at itsdecade-peak of 20.7 times trailing earnings.
http://www.barrons.com/articles/how-to-invest-in-water-5-picks-1489814477

http://slideplayer.com/slide/6632427/

Continue reading →

Daily Top 10 – March 17, 2017


1.Will Corporations Switch from Buybacks to Capital Spending in 2017?


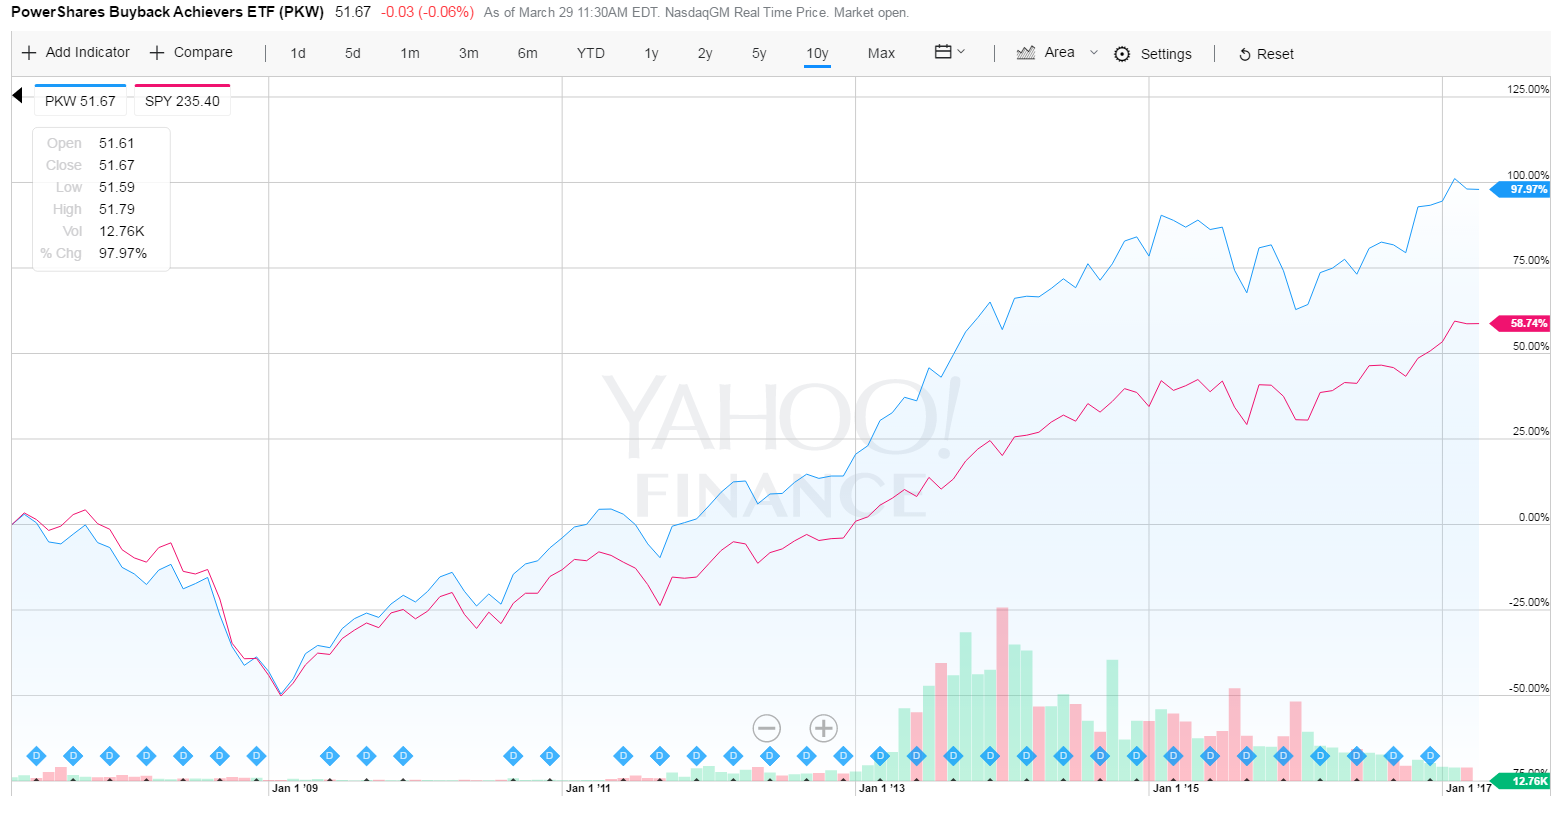
Buyback ETF vs. S&P…New Trend??  Buybacks added fuel to this bull run.

Buybacks 4th qt. 2016 half the previous qt. and lowest since 2014
For years, American companies’ loved nothing more than using their cash to buy their own stock. But tastes may be changing.

But the data also suggest a shift is underway. In the fourth quarter, nonfinancial companies bought back a net $323 billion in equities, at a seasonally adjusted annual rate, half as much as in the previous quarter and the lowest amount since the second quarter of 2014.

And unlike the third quarter, companies’ capital spending surpassed their cash flows, which is a return to normal. Companies usually borrow to spend, betting the payoff from the investments more than pay off the debt.
https://www.wsj.com/articles/stock-buybacks-are-so-yesterday-1489088699

Continue reading →

Daily Top Ten – March 6, 2017

1.Positive Returns During January and February

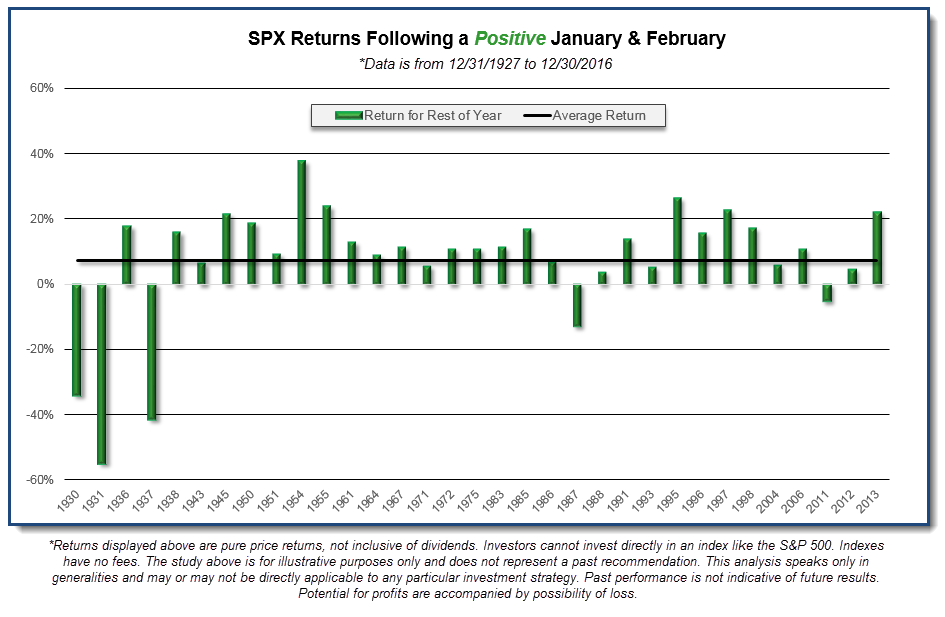
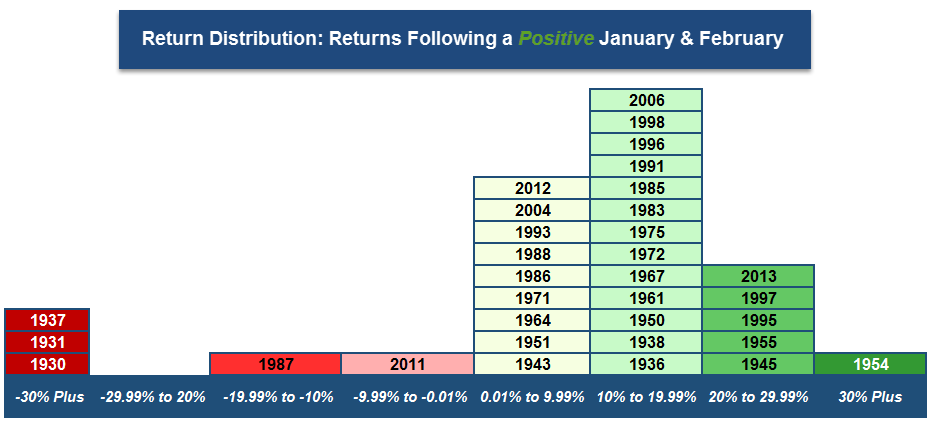
The images below show a bell curve and bar chart of the SPX returns for the remainder of the year (March – December) when both January and February returns were positive. As we can see from both images, the market tends to finish in positive territory for the remainder of the year as well, though there are a few exceptions. Here are some statistics from our findings:

· During the years where January and February were both positive the combined months average return was 7.40% (out of 33 occurrences). In 2017, the SPX was up 5.57% from 12/30/2016 to 2/28/2017.
· The remainder of the year (March – December) the SPX was up an average of 7.37%.
· Out of the 33 occurrences, 28 occurrences were positive (84.85%) and 5 were negative (15.15%).
· Average return for just the 28 positive occurrences was 14.01%.
· Of the five negative occurrences, three of them date back to the 1930’s. The two other negative occurrences were 1987, which saw the SPX fall -13.06% from March thru December (largely due to the October crash), and 2011, when the SPX finished down -5.24% from March to December.

From Dorsey Wright
https://oxlive.dorseywright.com/research/bigwire/

Continue reading →

Daily Top 10 – March 3, 2017

1.March Madness…Highest Monthly Return Month for 10 Years.

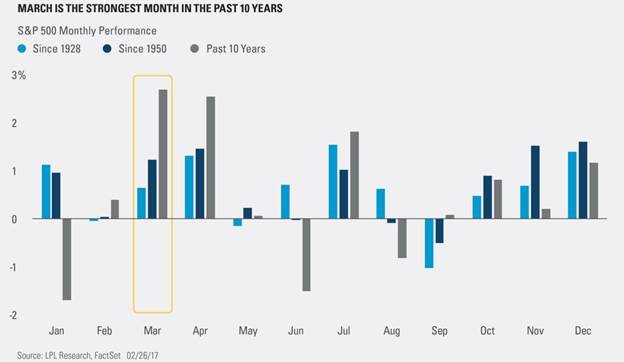
March is known for many things, from spring training, to the NCAA tournament, to spring flowers, to consistent equity gains? That’s right, over the past 10 years, there hasn’t been a month for the S&P 500 with a higher average monthly return than March.

“When the first two months of the year have been higher, March has closed higher 19 of 26 times (73.1%) and has been up an average of 1.4%” – “The S&P 500 is set to close up four consecutive months once February is in the books. When the S&P 500 has been up four or more months heading into March, then March actually has become stronger, as since 1950, it has closed higher 11 of 13 times (84.6%) with an average return of 2.3%.” noted LPL


Thanks to Dave Lutz at Jones for Chart.

Continue reading →

Daily Top Ten – March 1, 2017

1.Energy Pricing in a Strong Recovery?

Yet, the valuation has been inflated by a collapse in profits for oil companies. Because analysts expect little in the way of earnings over the next year, but a recovery later, the ratio of price to year-ahead earnings for oil stocks is elevated. The energy sector stands at more than 30 times Thomson Reuters IBES’s estimate of operating earnings over the next 12 months, higher than any time from when the sector data started in 1995 up to last year—when it briefly reached an extreme of almost 60 times.

https://www.wsj.com/articles/a-new-way-to-look-at-crazy-stock-valuations-1488212972?tesla=y

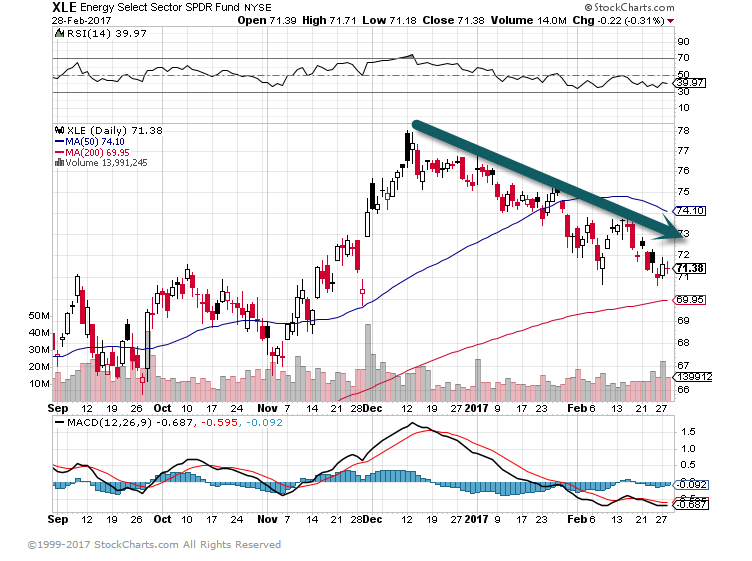
XOP 16% Off 2017 Highs.

XLE 7% Off Highs.

Continue reading →

Daily Top Ten – February 26, 2017

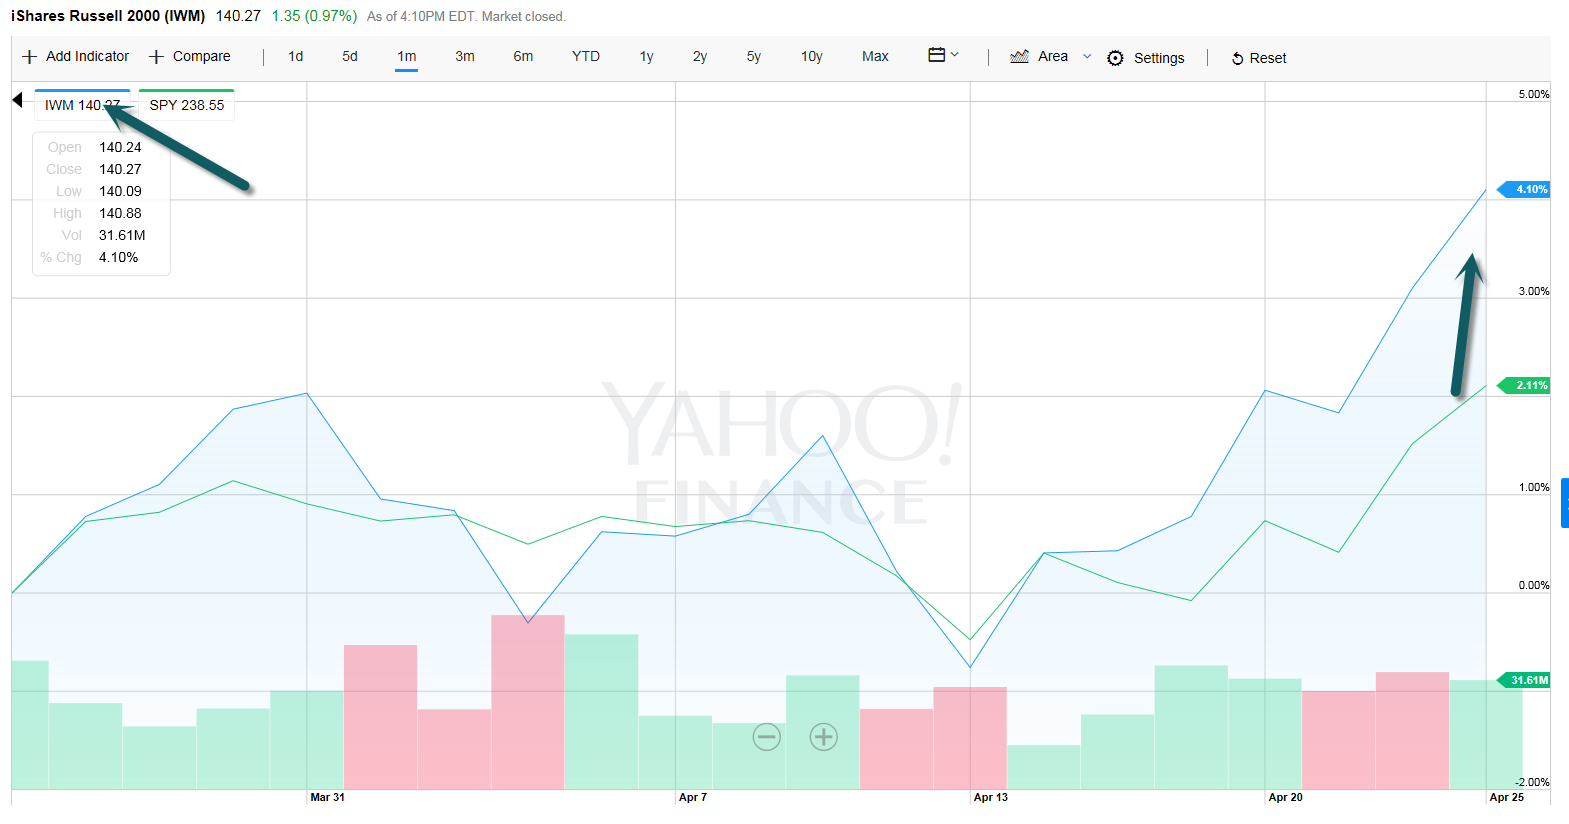
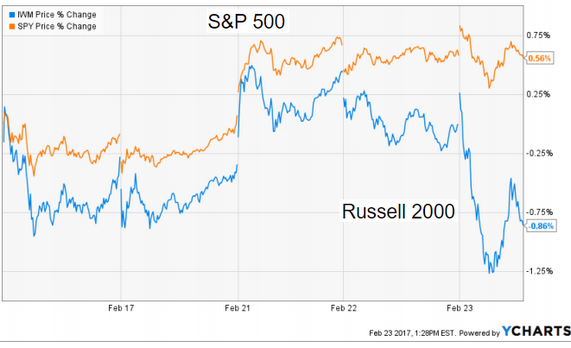
1.Small Caps Lag in Feb….Tax Cuts Delayed Until Late Summer.

S&P vs. IWM (Small Cap Index) Feb.

www.thedailyshot.com

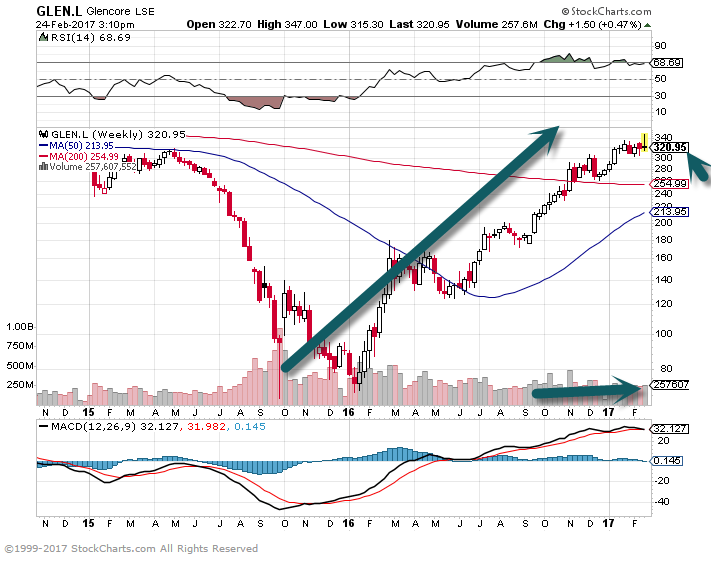
2.Glencore—Another Commodities Name Up From the Ashes….+76% Since Ja. 2016 Pullback.

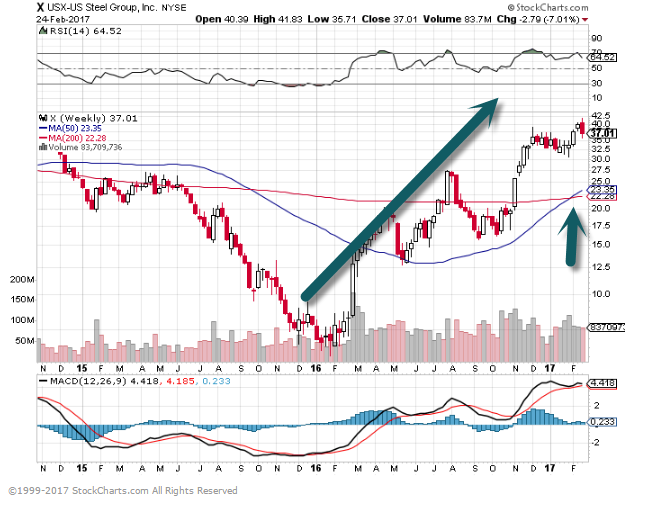
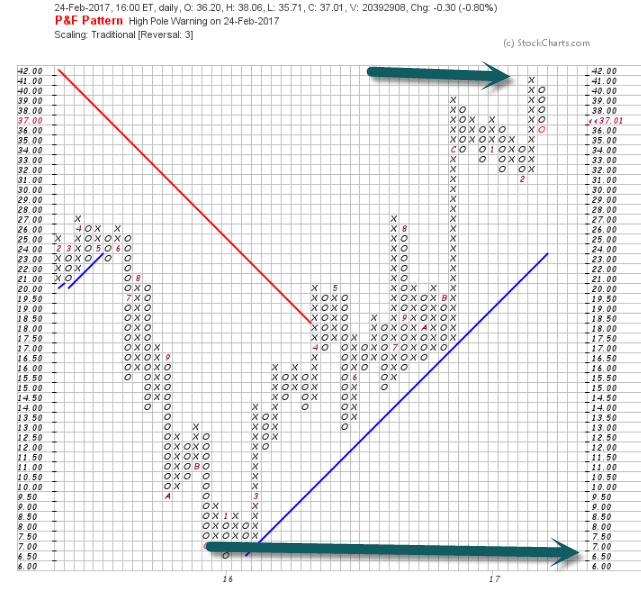
3.Another Name Up from Death March…Who had the U.S. Steel Trade?  $6.50 to $41

U.S. Steel +530% Off Bottom…50day thru 200day to Upside on Weekly Chart.

Bottom 2016 $6.50

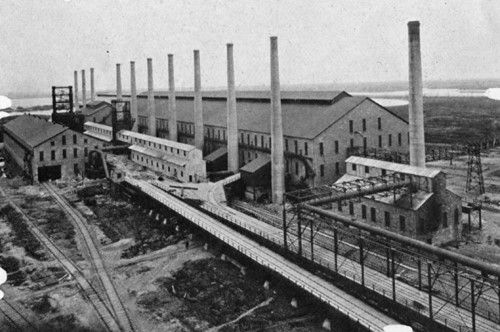
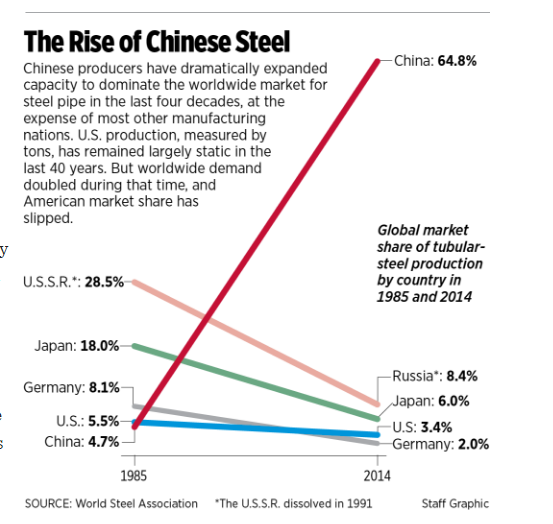
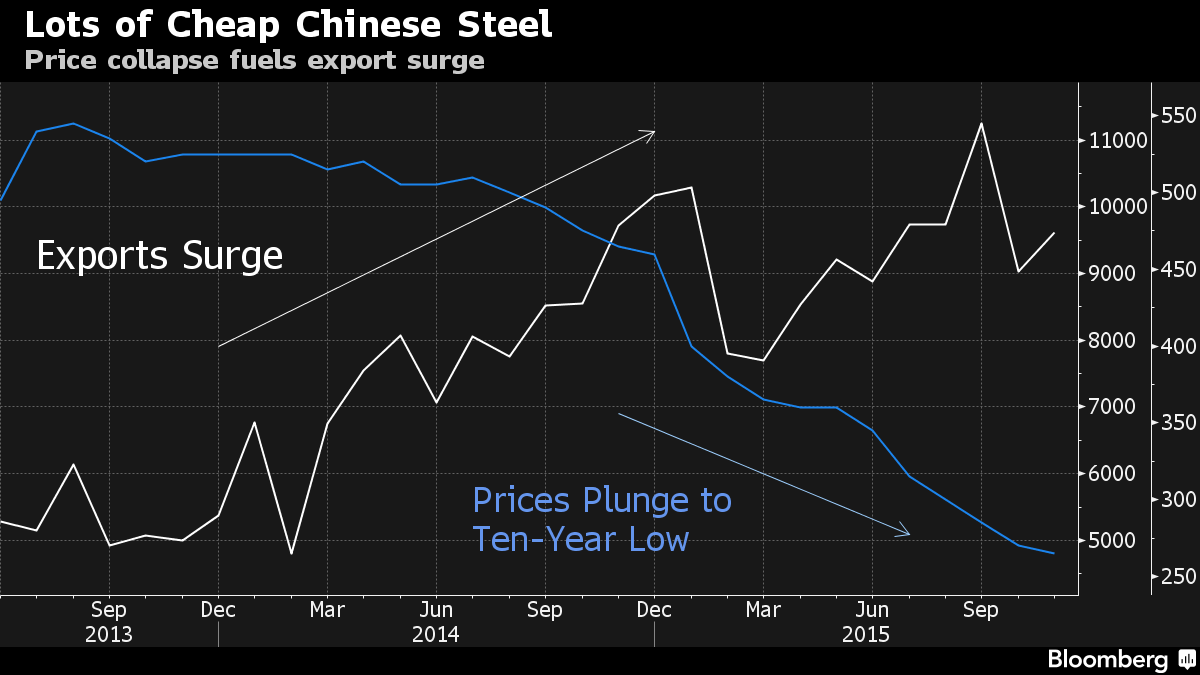
4.The Rise of Chinese Steel and Collapse of Price.

http://www.philly.com/philly/business/American-steel-pipes-Trump-Pennsylvania-Durabond.html

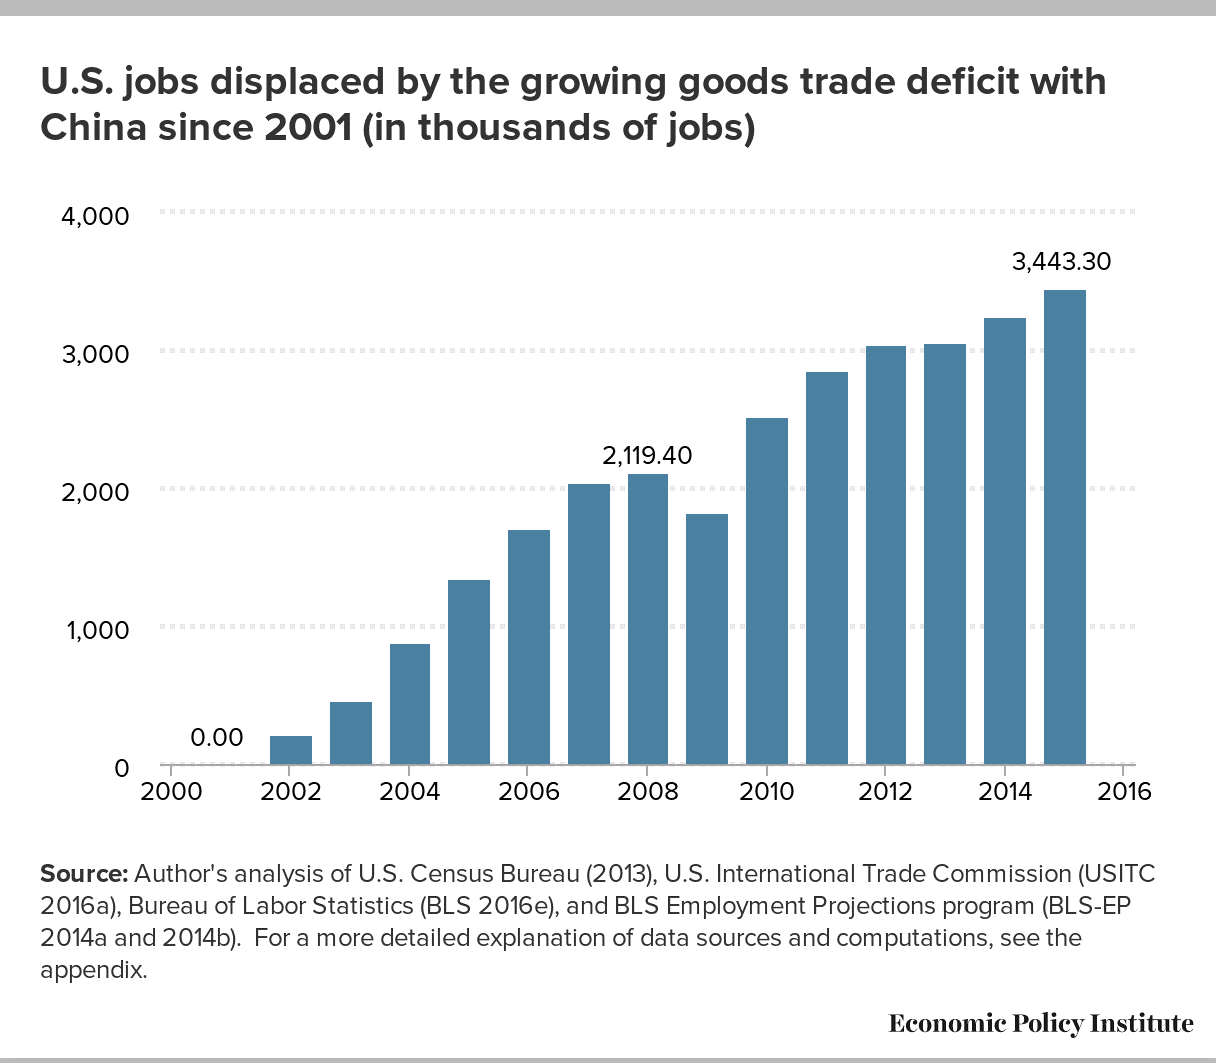
5.That’s a Ton of Displaced Jobs in 15 Years….Populism?

23 Million People Remain Outside Confines of Labor Force-David Rosenberg.

How would you advise President Trump?

We have 23½ million Americans age 25 to 54 who reside outside the confines of the labor force. It is not that they’re unemployed. They by definition have disengaged from the entire economy, and that number has never been that high. The irony is that we have a record level of job openings. There is a skills mismatch.

So we need a WPA-type program, except with education?

Yes—education, training, skills development, apprenticeship programs. We have to find a way to retool these disenfranchised prime working age folks. Enrollment in universities and colleges is going down, and we do not have nearly enough engineers, scientists, and mathematicians. The No. 1 priority should be redressing the single biggest constraint on the economy outside of the fact that we have excessive debt loads.

Read Full Interview.

http://www.barrons.com/articles/david-rosenberg-cautious-on-the-trump-rally-1488000316

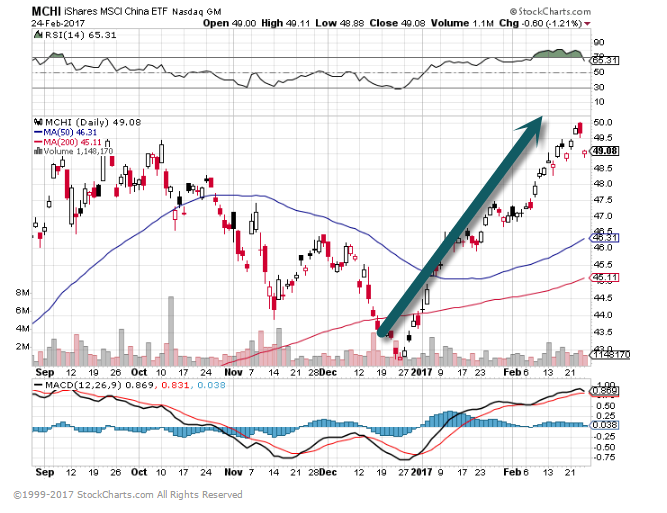
6.China MCHI Index +11.6% YTD…$815m in Outflows 2017


-$9B Outflows 2016

-$21B Outflows 2015

7.U.S. and China Infrastructure Boom…Cui bono

Commodity Rebound Would Be Boon for Russia, Indonesia

The two would benefit more than other developing economies if the U.S. and China spend heavily on infrastructure projects.

By

DIMITRA DEFOTIS

As commodity prices stabilize, two developing countries should be winners: Russia and Indonesia.

Among major emerging markets, commodities as a percentage of exports are greatest in Russia, at roughly 70%, followed by Brazil (51%), India (35%), and Indonesia (35%), according to World Trade Organization data provided by Pavilion Global Markets. But India imports half of its commodities and food needs, and the rise in oil prices may weigh on its economy, as will the lingering negative of last fall’s rupee demonetization. And Brazil is still struggling with high interest rates and debt, as it recovers from a deep recession.

But stronger commodity prices should benefit Russia and Indonesia. Driving demand are two factors: The first is China, which could spend close to $800 billion over the next three years on transportation improvements alone. The second is the U.S,, which also is likely to undertake infrastructure projects that will drive commodity consumption.

Exports from emerging markets have risen over the past six months, helping to boost foreign currency reserves in half of them, says François Boutin-Dufresne, a global strategist at Pavilion, an independent research and brokerage firm in Montreal. He’s bullish on buying the MSCI Emerging Markets Index over the next three to six months. The iShares MSCI Emerging Markets exchange-traded fund (ticker: EEM) is up 11% this year.

http://www.barrons.com/articles/commodity-rebound-would-be-boon-for-russia-indonesia-1488000350

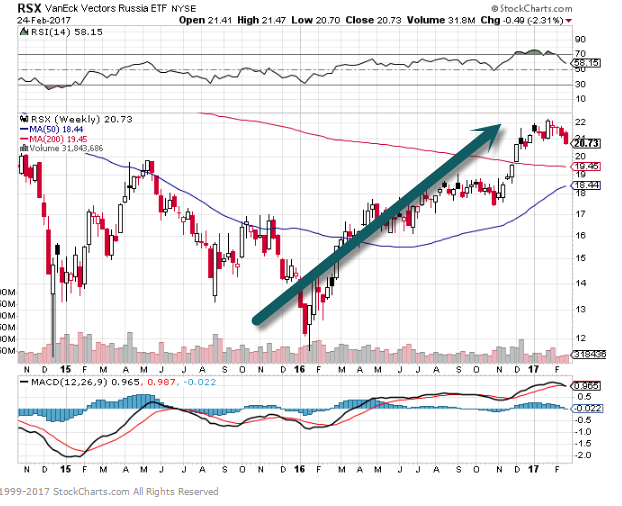
RSX-Russian Market Doubled Off Bottom

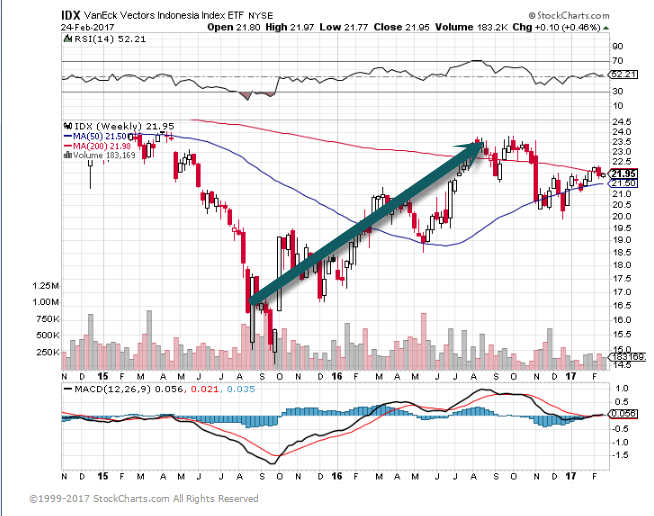
Indonesia Rally then Sideways.

8.5% Rally From Here Would Make Us Second Strongest Bull of All Time

Feb 24, 2017

When it comes to rankings, a “ten” is typically considered as good as it gets.  In many sports, a “ten” is considered the best possible score.  In 1976, Nadia Comaneci was the first gymnast to ever score a perfect ten when she was flawless on the uneven bars.  Then, in 1979, Bo Derek also taught us that a ten was perfect.

In 1984, the “perfect ten” was one-upped when ‘guitarist’ Nigel Tufnel from Spinal Tap introduced the world to amps that had a volume control that topped out at eleven.  His reasoning was that every once in awhile there are those times where you have the volume up to ten and everything is going great but there is nowhere else to go from there.  To solve the problem Tufnel tells the interviewer (played by Rob Reiner) that his amps go to eleven for those times when the band needs the “extra push off the cliff.”

This week, the DJIA was more than perfect, and like the amps from Spinal Tap, it pulled an eleven.  And it did so in dramatic fashion, as the only time that the DJIA traded in positive territory was in the final seconds of the trading day.  So where do we go from here?

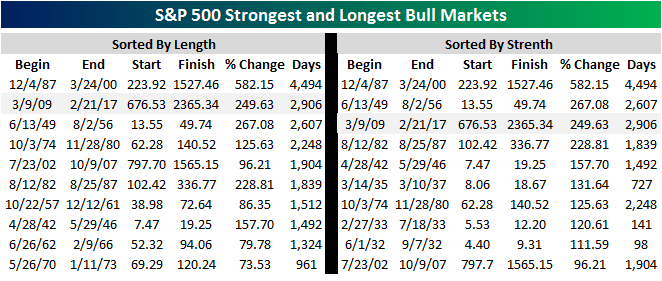
Along with the DJIA this week, all of the major averages hit new bull market and all-time highs, as one of the most unloved bull markets of all time continues to chug along.  For the S&P 500, the current bull ranks as the second longest and third strongest of all time.  While it will be some time before the current bull makes a run for the top spot in either category, in strength terms, a gain of 5% from here will put the current bull into second all-time as well.

https://www.bespokepremium.com/think-big-blog/

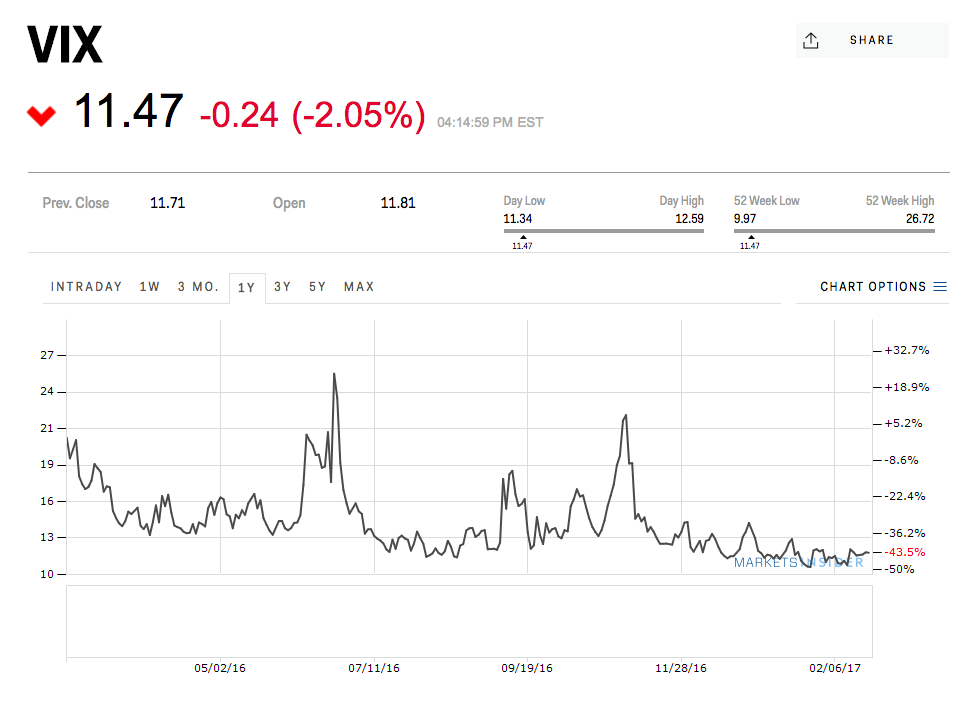
9.Read of the Day…FED Watching VIX.

After reading Alan Greenspan’s book, I was shocked how much the FED monitored the financial press, but I am even more surprised that they are watching the VIX.


The Fed is worried about a key measure in the stock market

  • Frank ChaparroJanet L. Yellen, Chair, Board of Governors of the Federal Reserve System, looks over her notes as she testifies before the United States Senate Committee on Banking, Housing, & Urban Affairs on “The Semiannual Monetary Policy Report to the Congress” on Capitol Hill in Washington, DC on Tuesday, February 14, 2017.AP
  • The Federal Reserve said January 22 it is worried about the “low level of implied volatility in equity markets”
  • The VIX, a gauge of market fearfulness, has been bouncing around at historic lows
  • That seems at odds with the “considerable uncertainty” the Fed expects in US policy

The Federal Reserve is worried that the stock market might be showing signs of complacency. 

The central bank’s most recent communication — the Fed minutes for the January/February meeting — released on January 22 shows that members are split on whether President Trump’s agenda will spur economic growth.

That uncertainty doesn’t seem to be showing up in the stock market, however. The Chicago Board Options Exchange volatility index, which gauges investor anxiety (technically, implied expectations for volatility in the stock market) and is widely known as the VIX index, has been trending down. 

The Fed minutes said: “They also expressed concern that the low level of implied volatility in equity markets appeared inconsistent with the considerable uncertainty attending the outlook for such policy initiatives.”

What is implied volatility, and why is it so low?

The VIX is commonly read as a gauge of market fearfulness, and measures the market’s expectation of volatility implicit in the price of options on the Standard & Poor’s 500.

One way to think of it is like the cost of an insurance policy. When the market is expected to be volatile, there are more buyers of insurance, and so the cost of that insurance rises. When the market is relaxed, nobody’s interested in buying insurance against a wild swing, so the protection offered by options is inexpensive. 

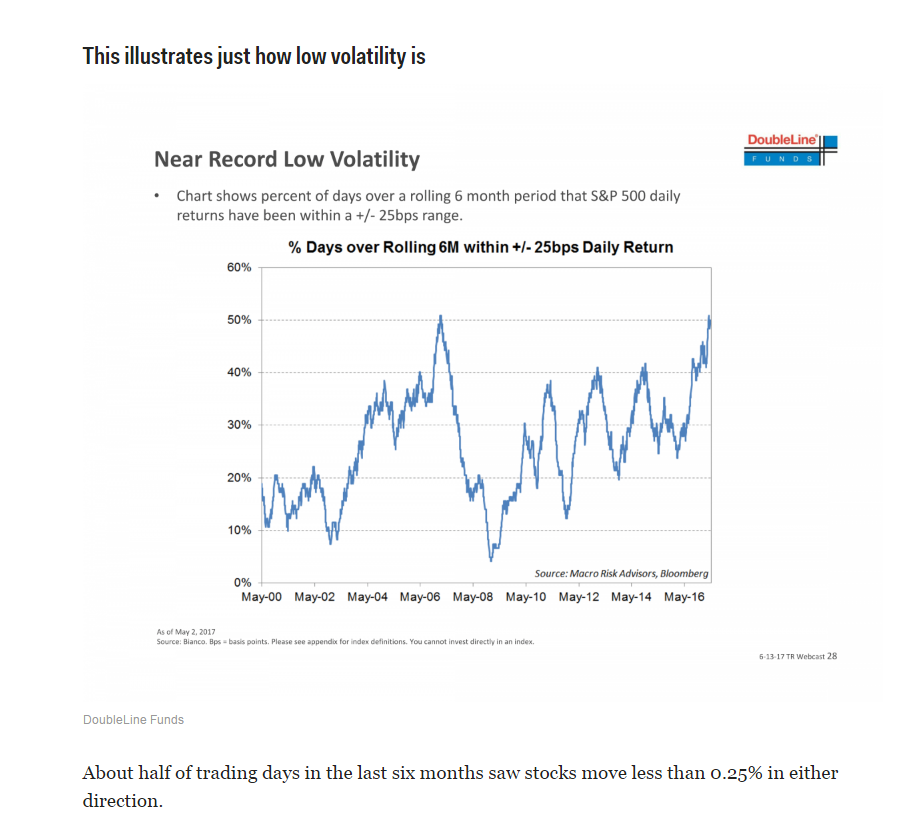
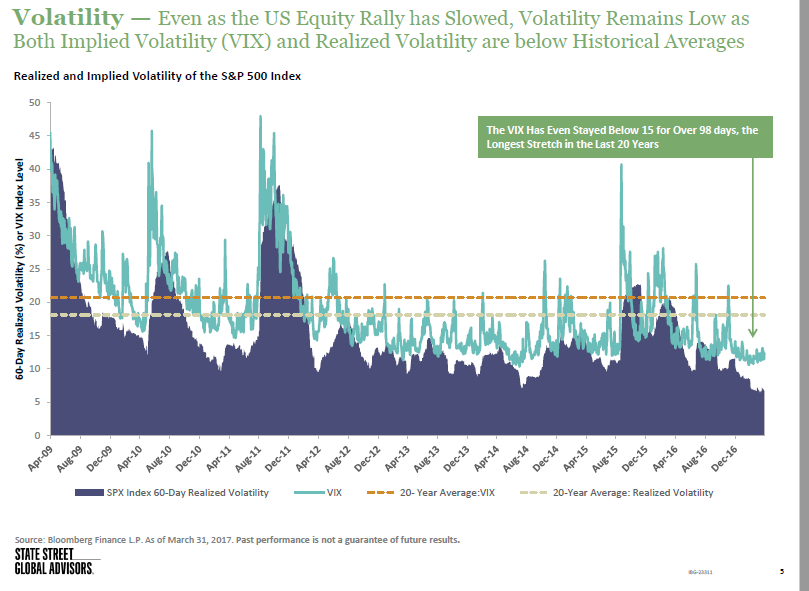
Lately, the VIX has barely been moving, only breaking 20 on a handful of occasions, and generally trending below 13.

10.Mark Cuban…Next Job Growth will be About Interpreting the Data.

After Job Skill

The billionaire investor predicts one crushing reality of automation.


When Mark Cuban speaks, people listen. The billionaire investor and Shark Tank personality has a slew of wildly successful businesses under his belt. Whether he’s commenting on the recent Time Warner and AT&T merger, recommending books for entrepreneurs, or sounding off about the 45th president, the internet hangs on Cuban’s every last word.

Now his latest prediction about the future of jobs is picking up steam. In a recent interview with Cory Johnson on Bloomberg TV, Cuban presented an interesting argument against people pursuing so-hot-right-now computer science degrees or attending learn-to-code bootcamps.

“What looks like a great job graduating from college today may be not be a great job graduating from college five years or 10 years from now,” Cuban said.

He predicts the next wave of innovation will be “the automation of automation.” By that, Cuban means software will soon begin writing itself, which will ultimately eliminate those lucrative software development jobs. About writing software, Cuban said: “It’s just math, right?” Humans will no longer be needed.

Though it’s ironic, Cuban believes technology will eventually kill tech jobs themselves. “There are no manufacturing jobs coming back. There are no coal mining jobs coming back,” Cuban said. He thinks software development jobs are next on the chopping block.

The next most in-demand job skill

If Cuban’s prediction does indeed come true, with the need for coders, developers, and engineers eventually evaporating, what sort of workers will be in demand? Those who can make sense of the data that automation is spitting out. No, not data scientists. Cuban believes employers will soon be on the hunt for candidates who excel at creative and critical thinking.

“I personally think there’s going to be a greater demand in 10 years for liberal arts majors than for programming majors and maybe even engineering,” Cuban said. He cited degrees such as English, philosophy, and foreign languages as being the most valuable. “Maybe not now,” Cuban acquiesced. “They’re gonna starve for awhile.” Their day, though, is likely coming, he says.

Cuban went on to voice his support for programs such as AmeriCorps, which engage young people in public service work across the United States. “Having people come in and have a social impact and making it a real job is what we’re gonna need.”

http://www.inc.com/betsy-mikel/mark-cuban-says-this-will-soon-be-the-most-sought-after-job-skill.html


Daily Top Ten – February 24, 2017

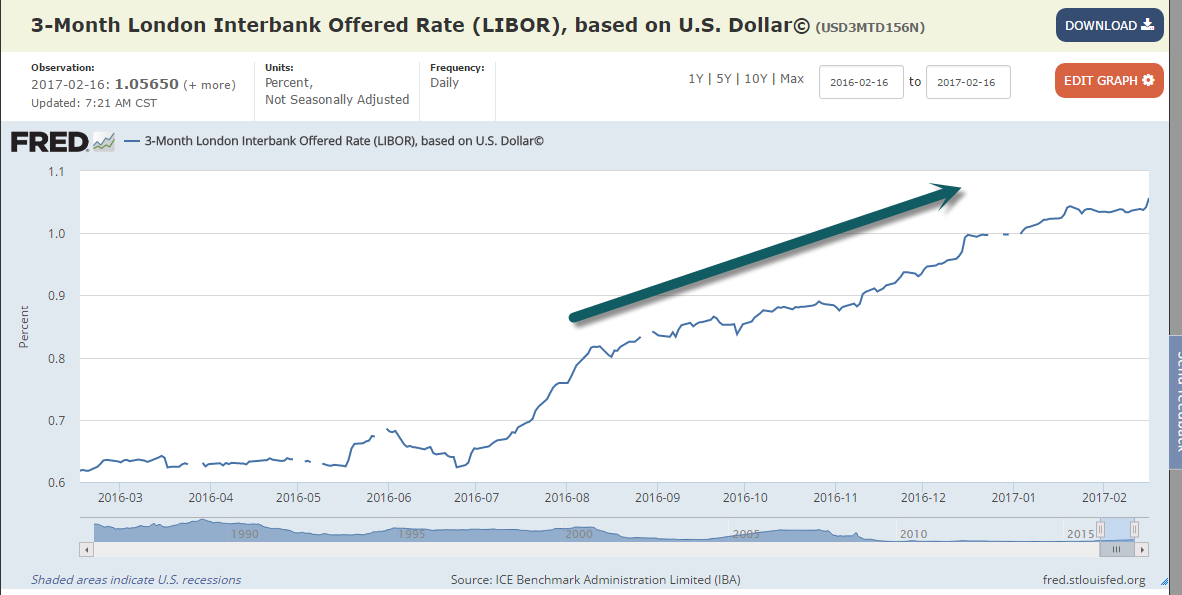
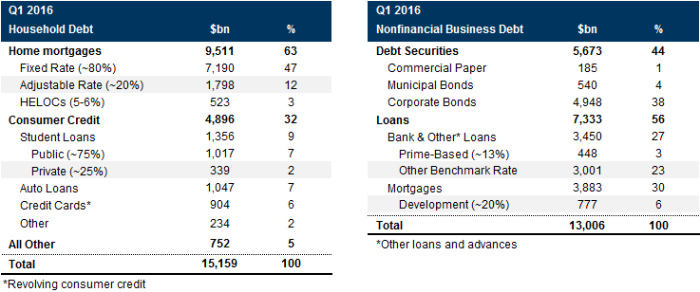
1.$28 Trillion in Debt is Based Off Libor….The Rate has been Moving Up Since July 2016

 BREAKING DOWN ‘LIBOR’

LIBOR (or ICE LIBOR) is the world’s most widely-used benchmark for short-term interest rates. It serves as the primary indicator for the average rate at which banks that contribute to the determination of LIBOR may obtain short-term loans in the London interbank market. Currently there are 11 to 18 contributor banks for five major currencies (US$, EUR, GBP, JPY, CHF), giving rates for seven different maturities. A total of 35 rates are posted every business day (number of currencies x number of different maturities) with the 3-month U.S. dollar rate being the most common one (usually referred to as the “current LIBOR rate”).

Read more: LIBOR http://www.investopedia.com/terms/l/libor.asp#ixzz4Zb2kAkBE
Follow us: Investopedia on Facebook

https://fred.stlouisfed.org/series/USD3MTD156N

 The breakdown of nonfinancial debt referencing Libor is as follows: it amounts to just over $28 trillion, with trillions more added if one adds the financial Libor-referenced debt.


http://www.zerohedge.com/news/2016-08-11/libor-blows-out-fresh-6-year-highs-28-trillion-debt-question-emerges

  Continue reading →

Daily Top Ten – February 23, 2017

1.Low Liquidity Among Hedge Funds and Holding the Same Names Like Never Before

(Bloomberg) — There’s safety in numbers. Until a stampede starts.

That’s the theory underlying a study of hedge fund holdings by Novus Partners Inc., which sought to calculate how easily the market could absorb concerted selling by large money managers. Using an analysis that turns mainly on how much volume is occurring in stocks favored by professional speculators, Novus says liquidity is at an all-time low.

Read Full Article

https://www.bloombergquint.com/markets/2017/02/21/hedge-fund-liquidity-falls-to-danger-zone-in-u-s-stock-market
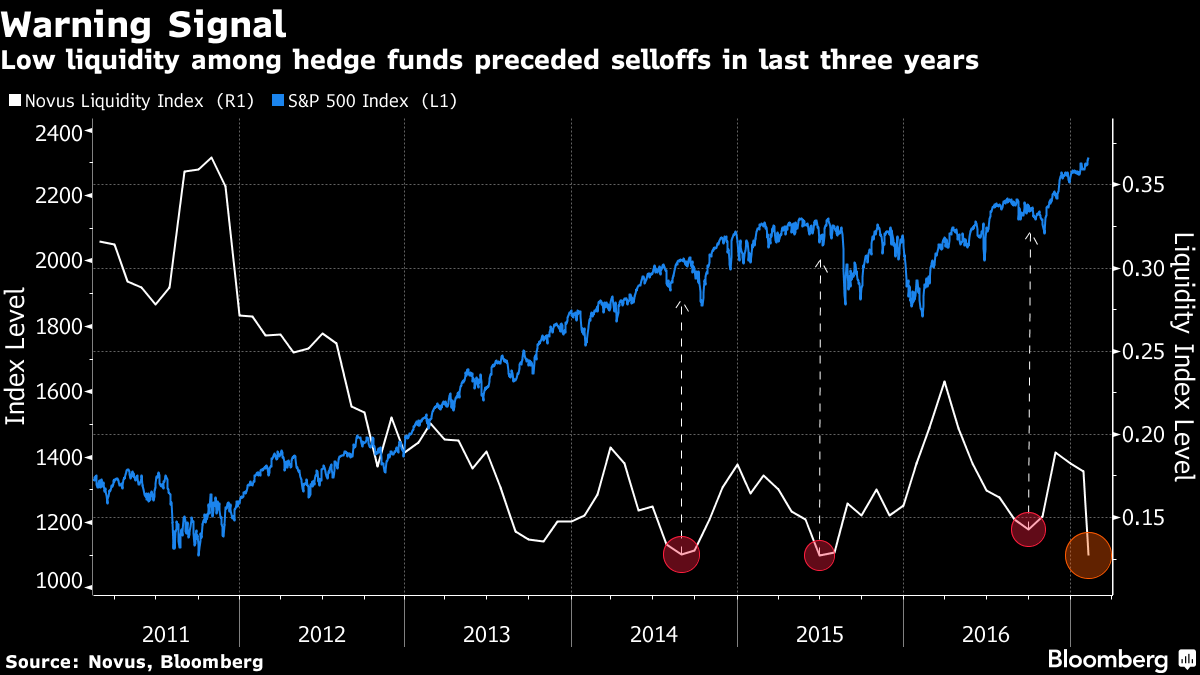
Hedge Funds in Crowded Trades.
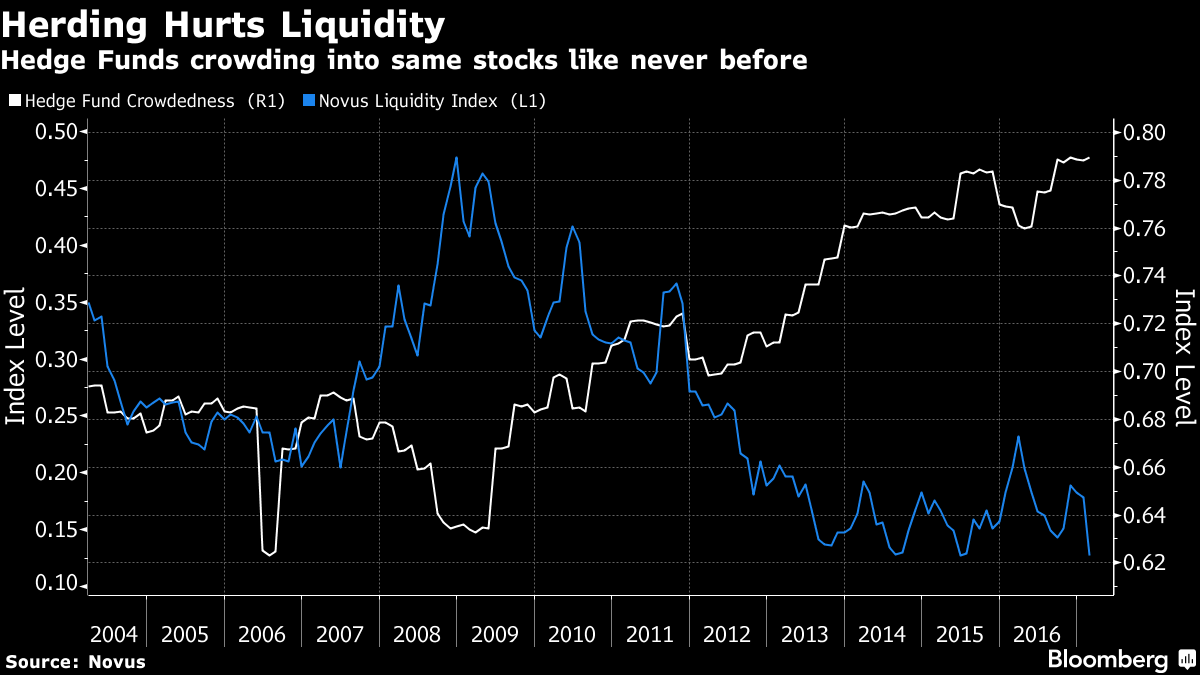
Found at Abnormal Returns Blog

https://abnormalreturns.com/

2.U.S. Consumer Prices Recorded Biggest Increase in 4 Years.

 Reuters:

U.S. consumer prices recorded their biggest increase in nearly four years in January as

households paid more for gasoline and other goods, suggesting inflation pressures could be picking up.

The Labor Department said on Wednesday its Consumer Price Index jumped 0.6 percent last month after gaining 0.3 percent in December. January’s increase in the CPI was the largest since February 2013.

In the 12 months through January, the CPI increased 2.5 percent, the biggest year-on-year gain since March 2012.

The CPI rose 2.1 percent in the year to December.

Economists polled by Reuters had forecast the CPI rising 0.3 percent last month and advancing 2.4 percent from a year ago.

Inflation is trending higher as prices for energy goods and other commodities rebound as global demand picks up.

 Found on Josh Brown Blog
http://thereformedbroker.com/2017/02/15/cpi-busts-out/
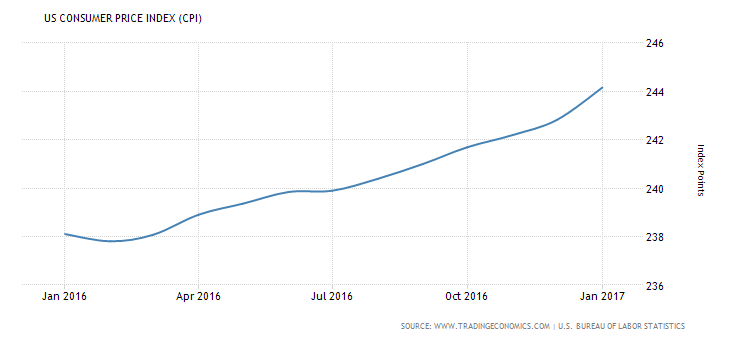
 

 http://www.tradingeconomics.com/united-states/consumer-price-index-cpi

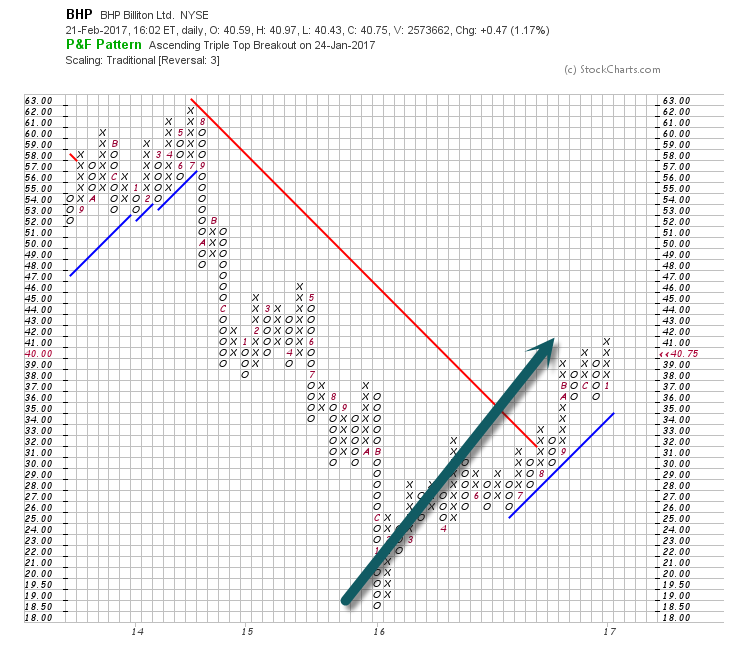
3.BHP +121% Off 2016 Lows…Commodities Tell?  Global Growth Tell?

Buoyed by a resurgence in commodity prices, BHP Billiton (NYSE:BHP) swung back into the black during the fiscal first half of 2017, posting a net profit of $3.2B, compared with a loss of $5.7B in the same period a year earlier. The company said it would also raise its interim dividend to $0.40, up from $0.16, on the back of the uptick in earnings. BHP +1% premarket. www.seekingalpha.com

BHP breaks above red downtrend line from 2014
 www.stockcharts.com

4.VIX in Bottom Decile is not that Dangerous…When VIX gets in Top Decile “Buy”
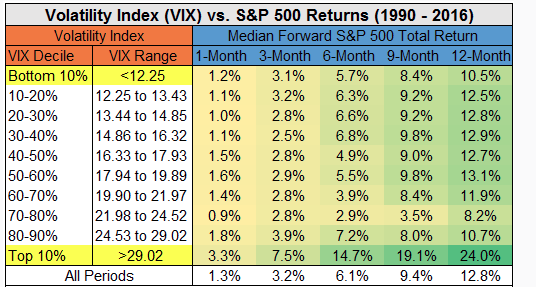
 

 They say you should never short a dull market –>”when the VIX is in the bottom decile of historical readings, as it is now, the S&P 500’s forward returns are a hair below average but still solidly positive (1.2% in one month, 5.7% in six months and 10.5% in 12 months.) He also concludes it’s even more foolish to short a wild market: when the VIX is in its top decile, returns over the next year are a whopping 24% “

From Dave Lutz at Jones.

5.More Volatility Comments…Here’s What Volatility Reveals About This ‘Expensive’ U.S. Stock Market

Source: RoadTrafficSigns.com

The big money in markets is often made by seeing what others don’t. It’s about resisting the gravitational pull of consensus, treading lightly where consensus is right, while spotting subtleties where the herd might be wrong.

Where Consensus Could Be Wrong: Volatility

#Volatility #ElectionDay

One subtlety we’ve been watching recently is volatility. Volatility, of course, is the measurement of the daily market fluctuations. In times of fear, the volatility of an asset rises. In times of buoyancy, all is well. The market simply floats higher and volatility falls.

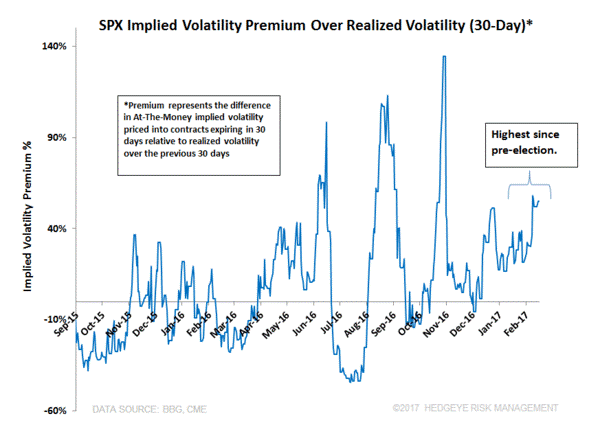
We have a nuanced view of volatility here at Hedgeye. Conceptually, there are two types of volatility we’re looking at, realized volatility (i.e. the volatility of an asset historically) and implied volatility (i.e. investors’ expectations of future volatility that’s embedded in options markets).

These volatility readings are painting a clear picture for investors today. As the stock market continues to make all-time highs, historical or realized volatility is falling to cycle lows. Meanwhile, fearful traders expect rising future volatility in the stock market and are buying downside protection in options markets to stave off the pain of an impending correction.

The Chart of the Day below from today’s Early Look is a visual representation of precisely that. The S&P 500 implied volatility premium on a 30-day basis is 52.2%. That’s a fancy way of saying investors are fearful of downside risks as historical volatility continues to fall. Note: A premium this high in the stratosphere hasn’t been hit since before Election Day.
Where Do We Go From Here?

#Economy #RetailSales #Inflation

Investors must put this volatility measure in the context of where we’re at in the economic cycle. Unsurprisingly, U.S. economic growth and inflation drive financial market returns. We believe both growth and inflation are accelerating.

Retail sales and inflation reports last week were near or above 5-year highs.

With this positive backdrop, we think equity markets can head higher from here. In other words, investors betting on significant future downside will get squeezed out of those positions.

It might actually be more risky piling into sectors like Consumer Staples (XLP) and Utilities (XLU), which are typically equity exposures investors buy when future downside is expected. In these sectors, implied volatility premiums are infinitesimal, 0.3% for Consumer Staples and 4.8% for Utilities. Implied volatility premiums this low suggest investor complacency.

Bottom Line

The prevailing market trends say stick with U.S. equities here.

https://app.hedgeye.com/insights/57467-here-s-what-volatility-tells-us-about-this-expensive-u-s-stock-mark

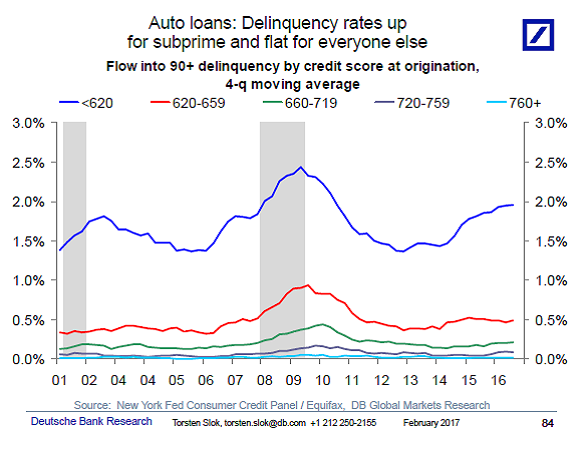
6.Auto Loan Delinquency Up But Not Big Enough to Move Macro Needle.

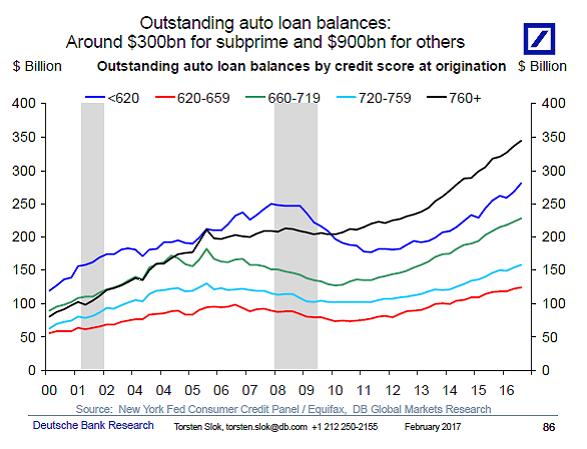
 I’m getting questions from clients asking if the recent increase in subprime auto loan delinquency rates is a problem. Delinquency rates for people with credit scores lower than 620 have moved higher but for households with credit scores above 620 delinquency rates are moving sideways, see the first chart below. Also, while subprime auto loan origination has increased to 2006 levels we have seen an even bigger increase in origination and amount outstanding for prime borrowers, see the second and third chart. Finally, it is important to remember that total household net worth currently stands at $90 trillion, and in that perspective, total outstanding subprime auto loans at less than $300bn seems very small. The 2006 subprime mortgage market was much bigger than today’s subprime auto loan market, and there was much more leverage in the financial system in 2006 compared with today. The bottom line is that the increase in delinquency rates for subprime auto loans may be a worry for those holding the debt, but it is not a problem for the macro economy.


Let us know if you would like to add a colleague to this distribution list.


Torsten Sløk, Ph.D.
Chief International Economist
Managing Director
Deutsche Bank Securities
60 Wall Street
New York, New York 10005
Tel: 212 250 2155

7.Rents Slowing Down…Banks Pulling Back on Apartment Lending.

 Banks Retreat From Apartment Market

A pullback in lending is forcing builders to scramble for financing to finish projects; ‘I  haven’t seen anything this seismically different since 2008’

New apartment construction is seen underway in St. Petersburg, Fla. Photo: Scott Keeler/Tampa Bay Times/Zuma Press

By

Laura Kusisto

The Wall Street JournalThe apartment sector, which contributes some $284 billion to the economy annually, has been a winning bet for investors since the housing crash, as the economy recovered and more renters sought out units. Since 2010, average U.S. apartment rents have increased by 26%, according to data tracker MPF Research, a division of RealPage.“Our business has radically changed,” said Toby Bozzuto, president and chief executive of the Bozzuto Group, which owns or manages 59,000 apartments in cities across the U.S. “I haven’t seen anything this seismically different since 2008, when credit dried up.”

Now banks are in retreat, forcing developers to look to nontraditional lenders and seek more expensive types of financing to complete projects, said apartment executives, industry analysts, mortgage brokers and bankers.

“We had fairly robust growth in our construction, real estate construction book, and that’s slowing now,” said P.W. Parker, chief risk officer of Minneapolis-based U.S. Bancorp, during an earnings call last month. “Multifamily is an area that, if you look at the forecasts, there are forecasts pretty broad-based of potential rent declines in a lot of the major cities. So we’re being more cautious there.

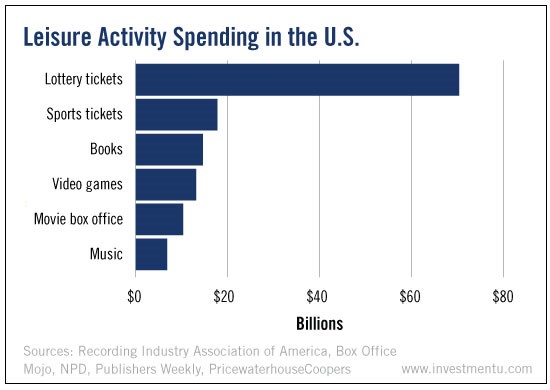
8.The amount Americans threw away on lottery tickets was $7.4 billion more than what was spent on all other forms of entertainment combined.
 

https://www.wsj.com/articles/banks-retreat-from-apartment-market-1487678401

9. Read of Day…How Higher Education Fueled Working-Class Anger

”Read Full Story   http://www.investmentu.com/article/detail/53531/lottery-tickets-70-billion-tax-killing-retirement#.WK3pmG8rJhE 

Published on February 21, 2017
Jeff Selingo

New York Times bestselling author, Washington Post columnist, higher education strategist, LinkedIn Top 10 Influencer

In the last few weeks I attended several higher education conferences where the talk among campus officials in the hallways and in sessions was usually centered around the same topic: President Trump. What’s clear in these conversations is that the much-discussed education divide that separated the electorate last fall between those with a college degree and those without has not dissipated since the election.

But the disdain academics exhibit for Trump these days ignores the role that their own colleges and universities played over the past two decades in fueling the working-class anger that led to his 2016 victory.

The story begins in the 1990s, when a college degree became increasingly necessary for economic success. The manufacturing sector, with its middle-class jobs requiring only a high-school diploma, had mostly collapsed the previous decade.

This shift in the economy coincided with a sea change in college admissions. The ease of travel and declining cost of communications meant that admissions was no longer a local game where even selective colleges with large endowments and strong brand names recruited mostly in surrounding states. When the U.S. News & World Report rankings became an annual publication in the late 1980s, colleges jockeyed to move up the rankings in order to gain prestige. To do that, they had to find better students outside their usual recruitment zone. And for schools a few rungs down the rankings ladder, it required luring top-notch students with boatloads of financial aid—even if their families didn’t need the money to send their kids to college.

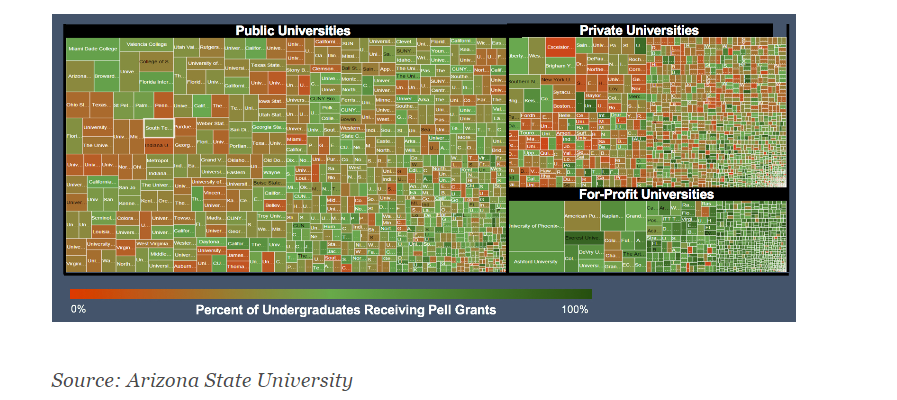
Access to higher education for students at all income levels, which had been prevailing policy since the signing of the Higher Education Act in 1965, was shoved aside. In the drive for prestige, selective colleges in particular became less economically diverse, full of wealthy students and a few smart kids lucky to get a Pell grant (which mostly go to students from families making less than $50,000 annually). In 2013-14, only 22 percent of students received Pell grants at top universities, compared to around 38 percent everywhere else. Students on Pell grants tend to be clustered at less-selective public and private colleges, and poor-performing for-profit colleges.

Pell Grants by undergraduate enrollment, 2014
Source: Arizona State University

This economic disparity is well known in higher education, but the extent of it became clear last month when researchers released the most comprehensive look to date at the financial background of students on college campuses. The results of the study—gleaned from analyzing the tax records of some 30 million students born between 1980 and 1991 and linked to nearly every college in the country—were startling.

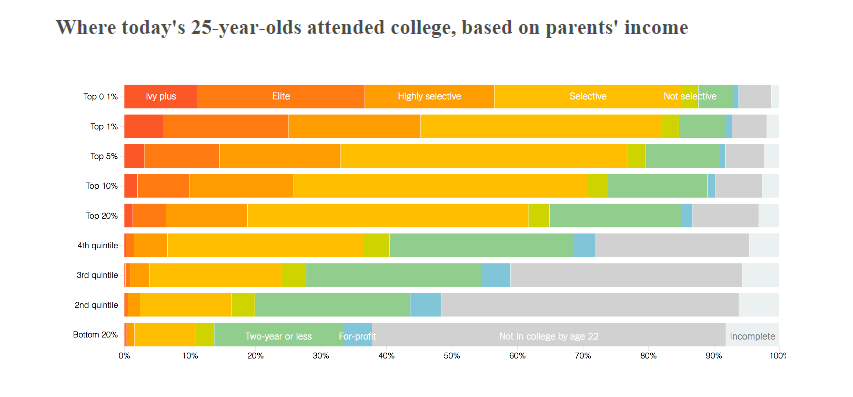
At 38 colleges, including five in the Ivy League, there are more students from families in the top 1 percent in income than the bottom 60 percent. What’s more, about 25 percent of the richest students attend a selective, elite college. By comparison, less than one-half of 1 percent of children from the bottom fifth of U.S. families by income attend an elite college.

Where today’s 25-year-olds attended college, based on parents’ income
Source: New York Times

As the economic divide grew ever wider among students on campuses over the last two decades, countless students graduated from college without the benefit of ever really knowing classmates from working-class families. Some of them then came to Washington to work on Capitol Hill, in the White House and in federal agencies to develop policies that would impact people without a college degree. They had little idea what it was like to lack a credential that carried so much weight in the job market.

Instead of being shocked by Trump’s win, higher education leaders should look internally at their own strategies that focused on gaining prestige and often exacerbated the growing economic divide by favoring students from wealthy and middle-class families.

College leaders are beginning to take notice. In December, a handful of selective colleges and universities announced an effort to identify, recruit, and support highly qualified low-income students. The American Talent Initiative aims to boost the number of Pell grant recipients at the 270 colleges with the highest graduation rates by 50,000 within 10 years (an increase of more than 10 percent).

This effort is a good start to reverse the trends of the last two decades, but it might be too little, too late. Higher education lost an entire generation of students who will become leaders in the future and missed out on an opportunity to have an undergraduate experience full of students from different economic backgrounds.

Jeffrey Selingo is author of There Is Life After College: What Parents and Students Should Know About Navigating School to Prepare for the Jobs of Tomorrow. You can follow his writing here, on Twitter @jselingo, on Facebook, and sign up for free newsletters about the future of higher education at jeffselingo.com.

He is a regular contributor to the Washington Post’s Grade Point blog, a professor of practice at Arizona State University, and a visiting scholar at Georgia Tech’s Center for 21st Century Universities.

Cross-posted from The Washington Post

https://www.linkedin.com/pulse/how-higher-education-fueled-working-class-anger-jeff-selingo?trk=v-feed&lipi=urn%3Ali%3Apage%3Ad_flagship3_feed%3Bd1oo65IXTmKQ3XFbVRdWxA%3D%3D

10.Self-Leadership Secrets of an Extreme Athlete

What could the sport of running teach us about the secrets of self-leadership and reaching our business finish lines?

I’ve been a fan of Dean Karnazes ever since I read his book Ultramarathon Man several years ago, so I eagerly devoured his newest, The Road to Sparta, which tells the story of history’s first-ever marathon.

Some of us know the popular version of the story, where after the Athenians defeated Persian invaders at the battle of Marathon 490 B.C., a messenger ran 26 miles to share the exciting news.

But Karnazes shares the real story, where the runner, whose name was Pheidippides, actually ran more than 150 miles all the way from Athens to Sparta, then back again, before the battle.

That’s 300 miles.

Why would a person willingly go through something like that?

“Western culture has things a little backwards right now,” Karnazes said. “We equate comfort with happiness. And now we’re so comfortable we’re miserable. There’s no struggle in our lives.”

That observation doesn’t just apply to running. That applies to all of life, including leading our organizations. When it comes to work, comfort equals boredom.

Engagement and even happiness come when we’re gunning toward major goals. I’m talking about the kind of achievements that push us outside our comfort zone.

Maybe it’s launching a new product line, starting a new career, or growing a sales channel by double digits. If staring down the goal makes you feel uneasy, you’re on the right track.

This ‘Discomfort Advantage’ is only one of the lessons running can teach us. Here are three leadership takeaways I discovered when I read The Road to Sparta:

  1. Leverage your unique abilities.

When Karnazes was a child, he went to a basketball camp coached by the legendary John Wooden. A small kid, Karnazes struggled to get rebounds like the bigger children. But Wooden could see his spirit and gave him some advice: “Do what you can.” Instead of going for rebounds, he started playing the backcourt. And he dominated.

When we compete head-to-head as if our abilities are the same as others, we sometimes miss playing to our strengths. It’s like we tilt the playing field against ourselves. Instead, we need to focus on what makes us unique. Steve Jobs is one of the best examples of this in recent years. Apple played its own game and rose to dominance.

  1. Let passion outrun balance.

We have to be careful that our jobs don’t dominate our lives, but there’s a natural tension in play if we really love what we do. “People speak of finding balance,” says Karnazes. “To me, that’s a misplaced ambition. If you have balance, you do everything okay. … Balance doesn’t lead to happiness—impassioned dedication to one’s life purpose does.”

What else could lead a person to run 153 miles through Greece? What else could lead an entrepreneur to do what the market believes is impossible? Balance is desirable, but it’s not the endgame. Finding and achieving your life’s purpose is.

  1. Celebrate your wins.

When we reach our goals, we need to take the appropriate time to celebrate. That’s a critical way to honor our work. But it’s also a key component of living a full life.

Hosting another run in Greece called the Navarino Challenge, Karnazes was surprised at how the townspeople came out to celebrate the winners. “These people were all willing to put aside what they were doing and join together,” he remembered, “rejoicing in the moment.”

“If we always made decisions with our heads instead of our hearts, we’d probably live much more orderly lives,” he says, “but they would much less joyous. … How many people spend their entire lives striving for something with their nose to the grindstone, only to wake up one day and realize they haven’t really lived at all?”

Trade on your unique abilities, stay fueled by passion for your work, and take time to celebrate your accomplishments.

Those three takeaways might serve an athlete. But I’m confident they’ll serve leaders even more.

Originally published by Michael Hyatt on December 16, 2016

http://www.earlytorise.com/self-leadership-secrets-extreme-athlete/

Daily Top Ten – February 21, 2017

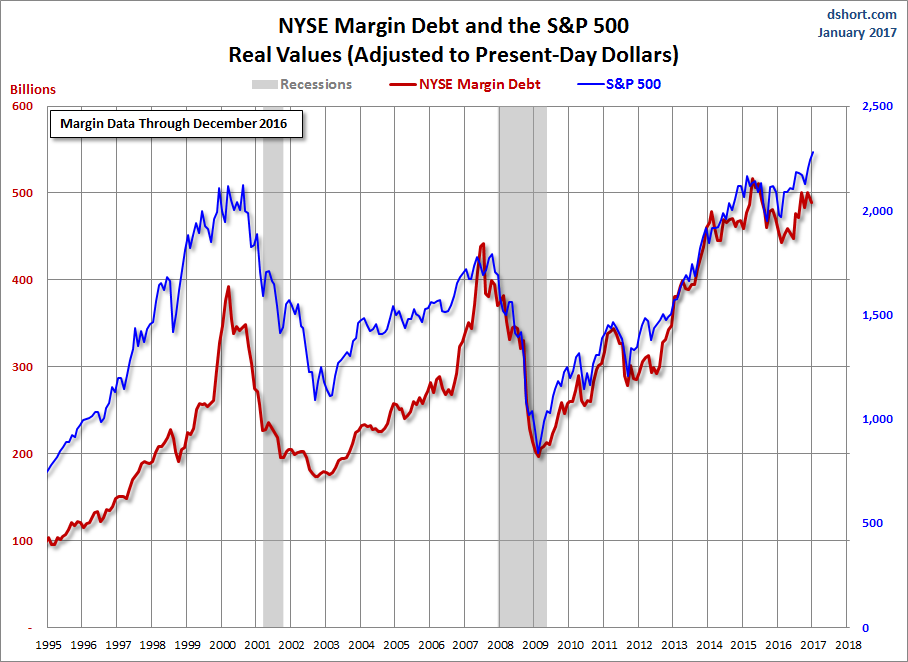
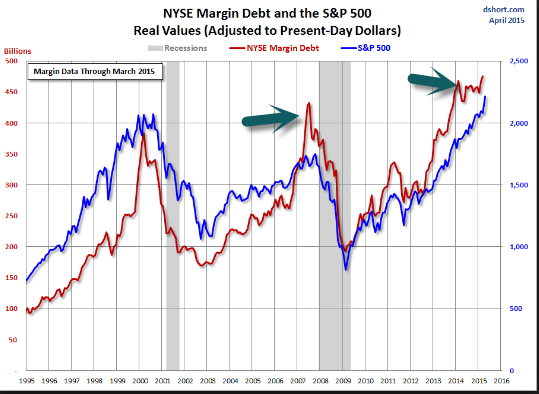
1. Margin debt has increased 193% since the bull market began—the same as the rise from 2002 to 2007.

Michael Belkin called the 2000 market top. Now the publisher of the Belkin Report, an institutional newsletter on asset allocation, and the Belkin Gold Stock Report is waving a warning flag about the level of margin debt on the New York Stock Exchange.

Margin debt is the loans banks and brokerages make to investors, using their stock- and bond-holdings as collateral. In November, it neared an all-time high of $507 billion and has hovered close to that level since. “It’s something that’s hanging over the market,” he says. “The market is addicted to debt.”

There’s precedent for a high level of margin debt foreshadowing a market collapse. It peaked in March 2000, congruent with the market’s March 24 top and subsequent 49% decline. And it peaked again in July 2007, a few months before the market top in October. Another disturbing factor: The percentage rise in margin debt over the latest bull market is 193%, exactly the increase from 2002 to 2007, when the financial crisis began and the Standard & Poor’s 500 index later fell 57%.

The problem with margin debt is that it causes a cascade effect. As the market falls, investors get margin calls on their loans and have to sell stocks to maintain their margin-debt minimum.

Ed Yardeni, president of Yardeni Research, says, “As long as the market is going up, margin debt tends to go up as well.” And margin debt exacerbates a bear market. But Yardeni doesn’t know of any time when margin debt triggered a bear market. That’s a relief.

http://www.barrons.com/articles/is-margin-debt-a-bear-market-indicator-1487394796

The NYSE has released new data for margin debt, now available through December. The latest debt level is down 2.2% month-over-month. The current level is 3.5% below its record high set in April 2015. The December data gives us an additional sense of investor behavior during the election rally.

https://www.advisorperspectives.com/dshort/updates/2017/02/01/a-new-look-at-nyse-margin-debt-and-the-market

Continue reading →

Daily Top Ten – February 14, 2017

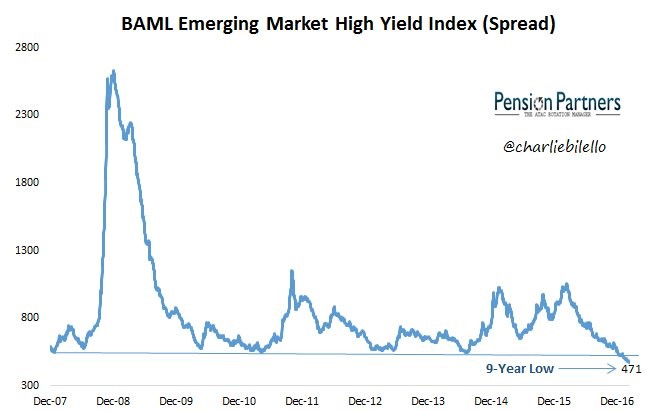
1. 9-year low in emerging market high yield credit spreads.

Yield Spread and Risk
Typically, the higher risk a bond or asset class carries, the higher its yield spread. When an investment is viewed as low-risk, investors do not require a large yield for tying up their cash. However, if an investment is viewed as higher risk, investors demand adequate compensation through a higher yield spread in exchange for taking on the risk of their principal declining. For example, a bond issued by a large, financially healthy company typically trades at a relatively low spread in relation to U.S. Treasuries. In contrast, a bond issued by a smaller company with weaker financial strength typically trades at a higher spread relative to Treasuries. For this reason, bonds in emerging markets and developed markets, as well as similar securities with different maturities, typically trade at significantly different yields.
Read more: Yield Spread Definition | Investopedia http://www.investopedia.com/terms/y/yieldspread.asp#ixzz4YeksCSSR

Am I the Only One Nervous?


Found on abnormal returns hot links

Monday links: bold predictions
Continue reading →

Daily Top Ten – February 9, 2017

1.Emerging Markets +7.68% vs. S&P +2.55% YTD

Emerging Markets Took Lead Over U.S. as Dollar Weakened.

Emerging Markets Ex-China

EGAI Emerging Markets ex-China Index – ETF Tracker

The index measures the stock performance of up to 700 emerging market companies, excluding companies domiciled in China and Hong Kong. Companies are selected and weighted according to free-float market capitalization.

http://etfdb.com/index/egai-emerging-markets-ex-china-index/

Charts from Yahoo
http://finance.yahoo.com/quote/EEM/?p=EEM
Continue reading →

Daily Top Ten – February 8, 2017

1.The Nasdaq Leads Markets.

Chart of the Day
For some perspective on a key US stock market index, today’s chart illustrates the overall trend of the tech-laden Nasdaq Composite since 2000. As today’s chart illustrates, the Nasdaq’s seven-year post-financial crisis rally is still very much intact. While other major indices have pulled back slightly (though still trade near historic highs — the Dow just closed above 20,000 and the S&P 500 is closing in on 2,300) the Nasdaq continues to post all-time record highs and, today, did so once again.

Continue reading →

Daily Top Ten – February 7, 2017

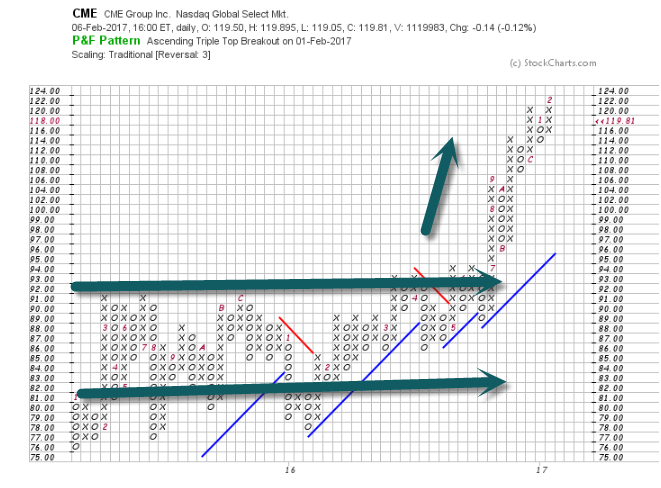
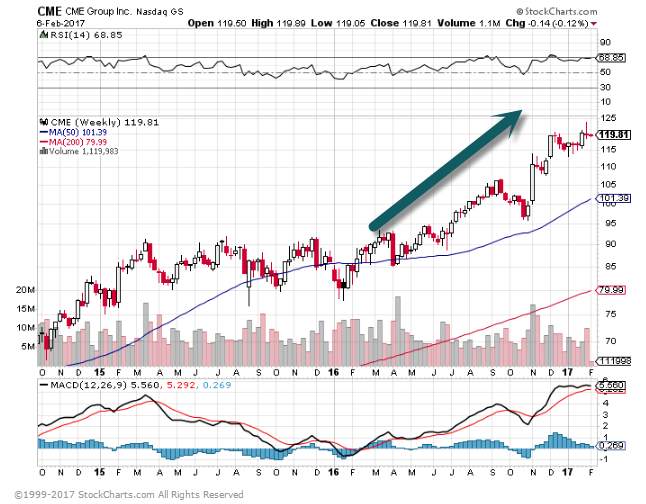
1.CME Group Daily Volume +25%….Energy Trading +27% and Metals Trading +49%

CME Group
Driving Global Growth and Commerce

CME Group is the world’s leading and most diverse derivatives marketplace, handling 3 billion contracts worth approximately $1 quadrillion annually (on average). The company provides a marketplace for buyers and sellers, bringing together individuals, companies and institutions that need to manage risk or that want to profit by accepting risk.
Our exchanges – CME, CBOT, NYMEX and COMEX – offer the widest range of global benchmark products across all major asset classes, including futures and options based on interest rates, equity indexes, foreign exchange, energy, agricultural commodities, metals, weather and real estate. As part of our commitment to providing innovative risk-management solutions to the marketplace, CME Group also offers a growing slate of cleared OTC products and services.
Through our CME Globex electronic trading platform, users worldwide are able to access the broadest array of the most liquid financial derivatives markets available anywhere. Additionally, CME Group operates CME Clearing, one of the world’s leading central counterparty clearing providers. By serving as the counterparty to every trade that happens in our markets, we protect the integrity of our markets, virtually eliminating third-party credit risk.
For the global economy, this unparalleled access translates into opportunity.
http://www.cmegroup.com/company/history/

CME Group Breaks Out of a Long Sideways Channel.

CME 20% Move After Election…Trump Inflationary Policies Positive for Commodities Trading?

www.stockcharts.com

Continue reading →

Daily Top Ten – February 3, 2017

Global Growth and Inflation Accelerating Before Any Trump Policies in Play.

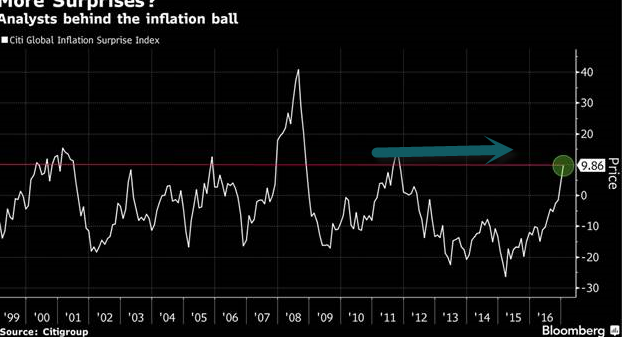
1.Inflation…Global Citigroup Inflation Surprise Index is Highest in 5 Years.

Inflation across the world is beating analysts’ forecasts even before the potential effect from Donald Trump’s economic policies. The global Citi Inflation Surprise Index, which measures price surprises relative to market expectations, is at the highest in more than five years. The reading turned positive in December — meaning inflation data were higher than expected — for the first time since 2012.

Thanks to Dave Lutz at Jones for Chart.

Continue reading →

Daily Top Ten – January 31, 2017

1.Longest Streak in 11 Years without a 1% Pullback

Days without a 1% pullback

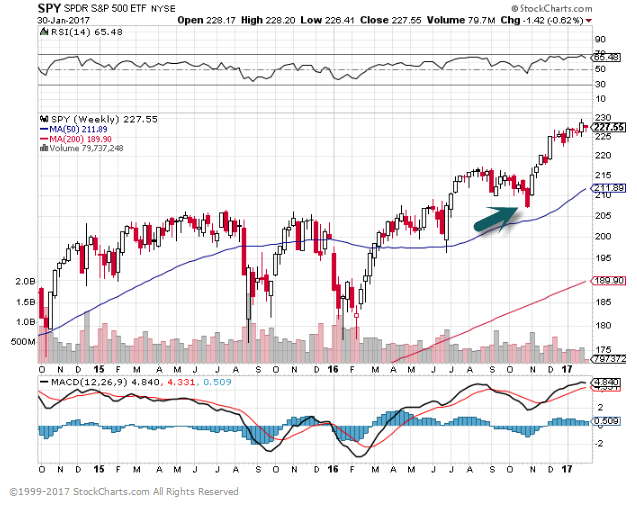
There have been 75 sessions (including Monday) without a 1% drop in the S&P, which marks the longest such streak in about 11 years, according to Krinsky. A period of sideways trading tends to suggest that the market has pent up momentum. And if history is any gauge, momentum may be leaning toward a downturn, given the market’s tendencies in February.

http://www.marketwatch.com/story/a-big-stock-market-selloff-in-february-looks-increasingly-likely-2017-01-30

Continue reading →