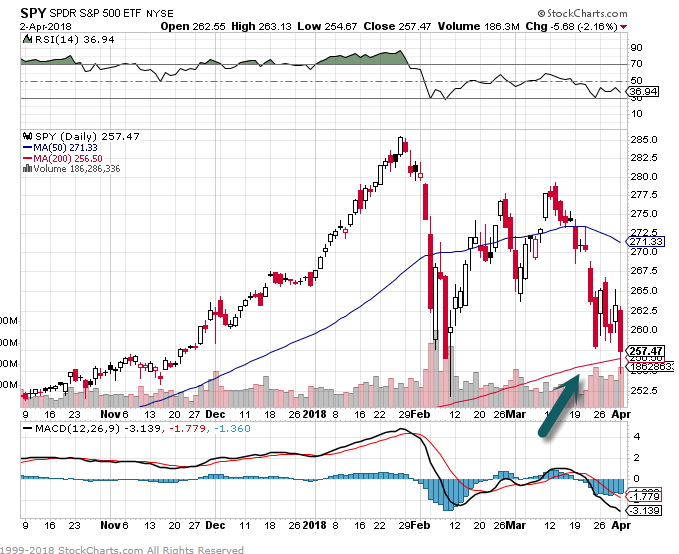
1.Multiple Headlines Saying S&P Closed Below 200day…I See it Holding….See #2
S&P holding 200day?
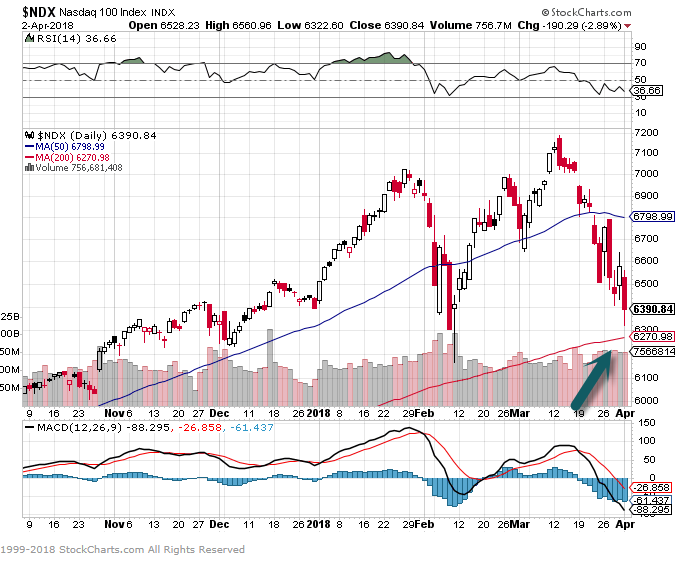
Nasdaq 100 Holding 200day
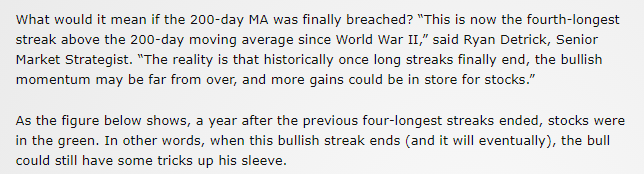
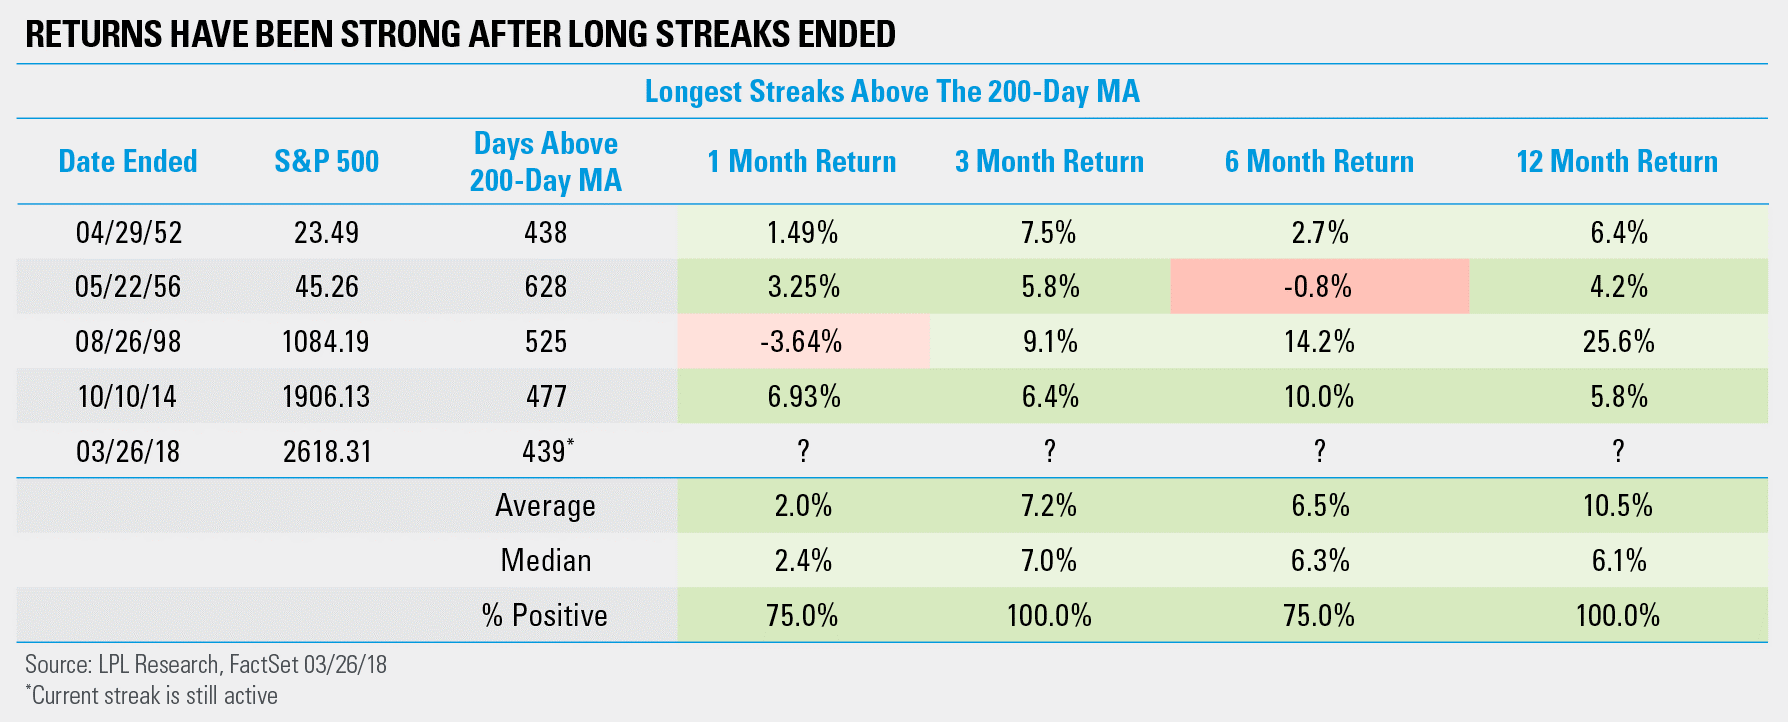
2.S&P–Fourth Longest Streak Since WWII Above 200Day Moving Average.
https://lplresearch.com/2018/03/27/stocks-bounced-as-expected/#more-9555
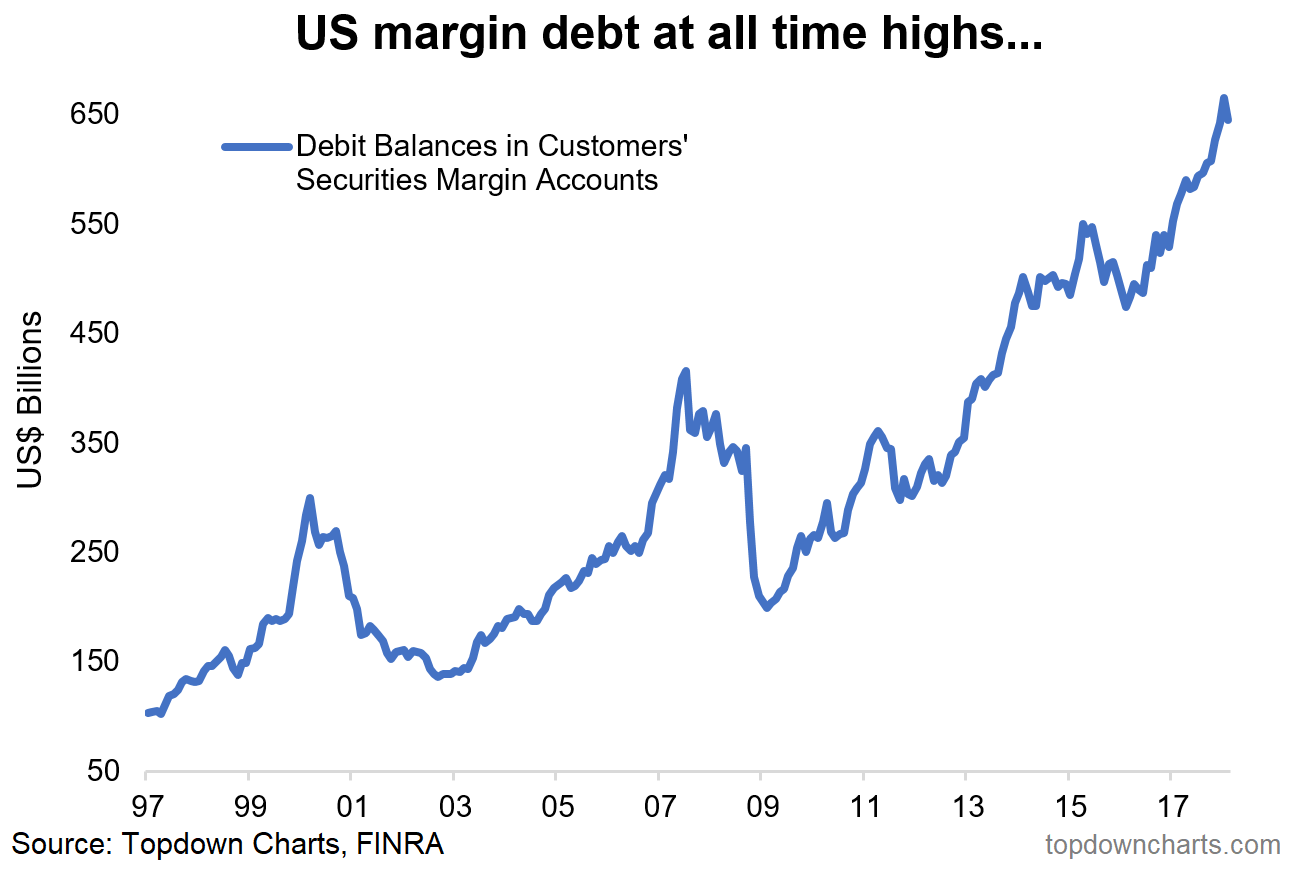
3.U.S. Margin Debt at All Time Highs.
Top Down Charts
US Margin Debt: Well first of all just a PSA for those who follow NYSE Margin Debt… that report is no more, it has ceased to be, it is an ex-datasource. In its place is the new and improved FINRA Margin Debt report which actually takes a more comprehensive view of the market, so that is a positive step. Anyway, the main point on the data is that US margin debt has pulled back slightly in February (latest data, just out, is only available up to Feb – data still gets released with a lag) vs an all time high in January.
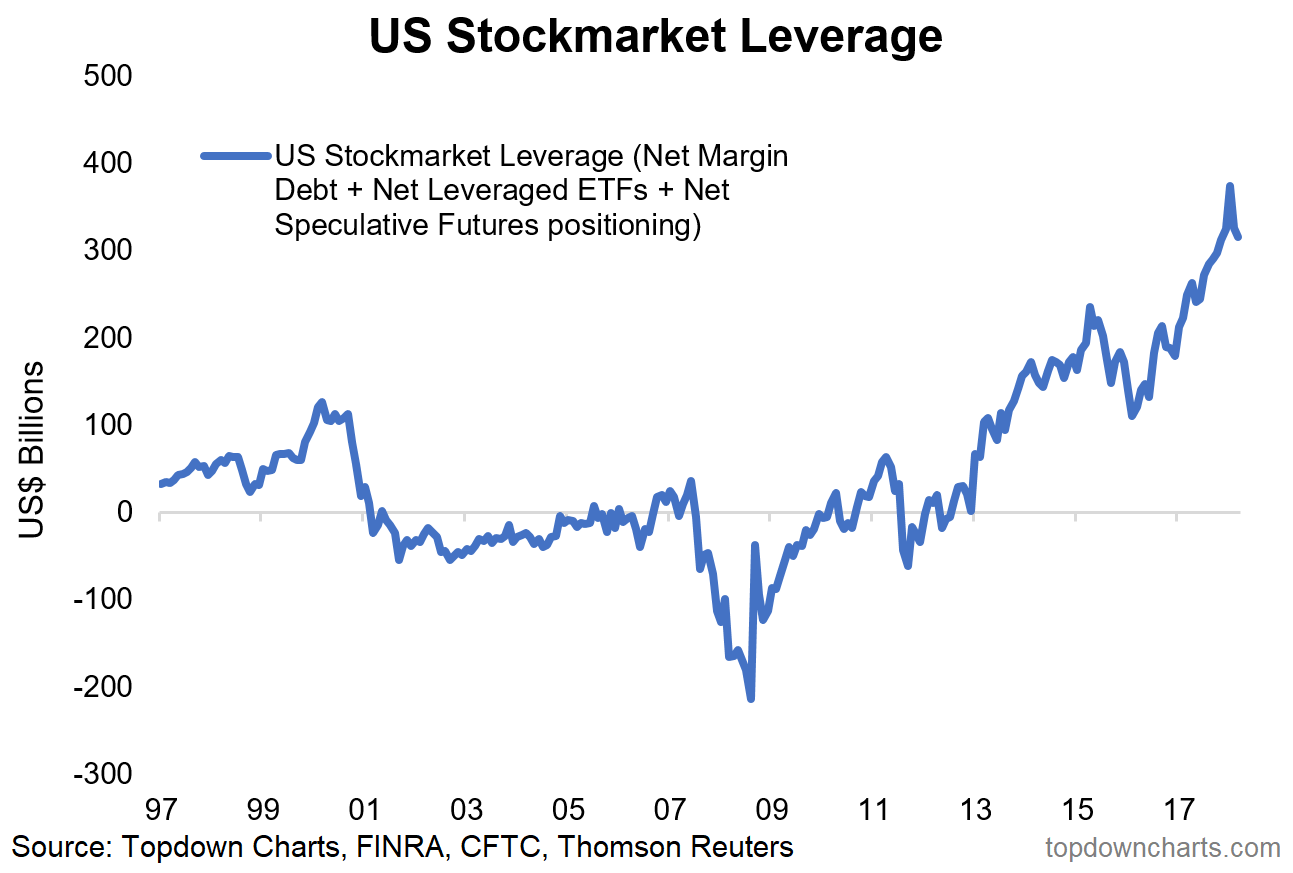
US Stock Market Leverage: Taking the data a step further, this time U.S.looking at net-margin debt and also bringing in net-leveraged ETF positioning (i.e. leveraged long minus short ETF assets under management), and speculative futures positioning, we get what I call US stockmarket leverage. Now there are of course other means of obtaining leverage to bet on stocks such as options and other derivatives, not to mention the trusty old credit card or mortgage draw-down, but even just looking at this indicator it is remarkable how it went from basically zero in 2013 to almost $400 billion in January. Much like in the sentiment snapshot, it shows another view of extreme bullishness making an as yet only minor pullback.
4.Vanguard……Demographics and equity returns: A far-fetched horror story
Joe DavisMarch 5, 2018 19 Comments
During a recent webcast, a question was submitted that I wanted to be sure we addressed. Ernest, from Connecticut, asked, “Will the baby boomers’ reduced equity exposure be offset by the millennials’ equity investing?” Let’s take a look.
If you wanted to write a stock market horror story, the plot might look something like this: As baby boomers retire, they will begin selling stocks. The millennial generation, burdened by student loans and traumatized by the dot-com bubble and global financial crisis, will avoid investing in stocks. The result: “Stockmageddon!”
Boomers’ market footprint is not a systemic risk
Now that the percentage of the U.S. population aged 65 and older has reached an all-time high of 15% and continues growing, this potential scenario has garnered quite a following. When Vanguard looks at the plot, however, holes begin to emerge. Here are a few:
- According to a 2006 analysis of Standard & Poor’s 500 Index returns from 1948 through 2004 conducted by the U.S. Government Accountability Office, demographic variables accounted for less than 6% of stock market return variability. This finding indicates that macroeconomic and financial variables far outweigh the impact of demographics.
- The baby boomer generation spans almost 20 years; therefore, any asset rotation out of equities will be gradual.*
- According to the Federal Reserve Board’s Survey of Consumer Finances, the 45- to 64-year-old age group owned 50% of all U.S. equities in 2016. This was almost identical to the 51% average held by the same cohort over the previous 27 years. During that time, the number of 45- to 64-year-olds increased from 19% to 26% of the overall population. In other words, even as the proportion of pre-retirees increased, their stock market footprint did not.
- Foreign holdings of U.S. equities as a percentage of total U.S. equity market capitalization rose from 7.2% in 1988 to 22.6% by 2016. Even if there werea connection between U.S. demographics and domestic stock market returns, international investors would dampen the impact.**
No significant relationship exists between the changing proportion of U.S. retirees and long-term stock market return variability
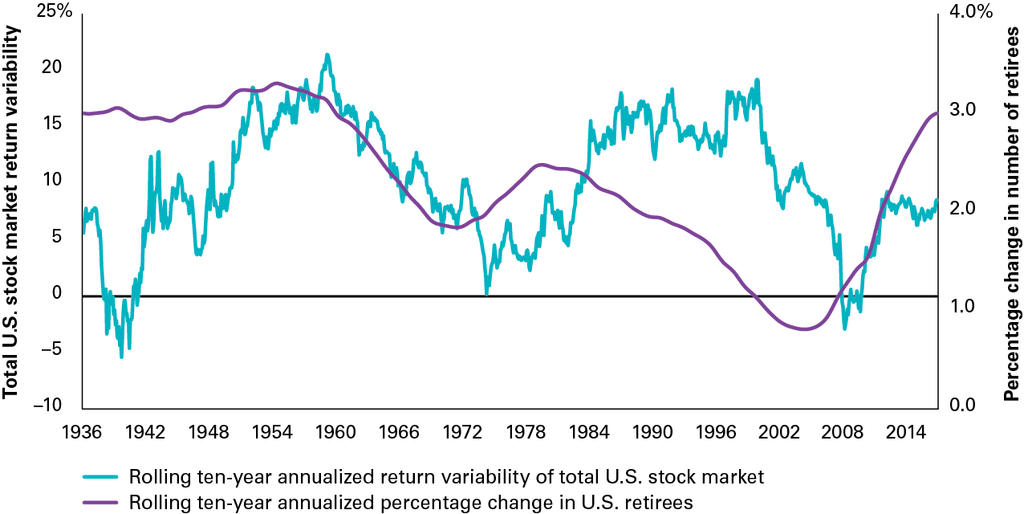
Notes: The U.S. total stock market is represented by a spliced benchmark composed of the following indexes: Standard & Poor’s 90 Index (January 1926 through March 1957), S&P 500 Index (April 1957 through December 1974), Wilshire 5000 Index (January 1975 through April 2005), MSCI U.S. Broad Market Index (May 2005 through June 2013), and CRSP U.S. Total Market Index (thereafter). The historical data for the U.S. total resident population ages 65 and older (January 1926 through July 2017) were derived from Moody’s Analytics database, available at DataBuffet.com.
Source: Vanguard calculations, using data from U.S. Census Bureau and Moody’s Analytics.
https://vanguardblog.com/2018/03/05/demographics-and-equity-returns-a-far-fetched-horror-story/
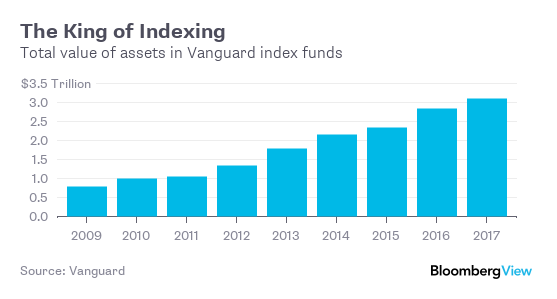
5.$10 Trillion Invested in Index Funds…They Represent Less Than 20% of Global Assets.
Swedroe: Indexing Fuss Unwarranted
Latest Research
A recent study by Vanguard found that, as of October 2017, about $10 trillion was invested in index funds. While a large figure, it represents less than 20% of the global equity market. Is there anyone who thinks the other 80% of assets are handicapped in their price discovery efforts? Even more important is that, while indexing makes up about 20% of invested assets, Vanguard estimated it actually accounts for only about 5% of trading volume. Is passive investing’s 5% share of trading volume setting prices, or is it active management’s 95% share doing so? Once you know the data, you can see how absurd the claims being made are.
While it’s certainly possible that, at some point, passive investing could reach such a dominant share that price discovery would be limited, clearly, we are nowhere near that level, and almost certainly won’t be there for a very long time.
Another Important Point
It wasn’t until 1950 when the number of mutual funds topped 100. That number was still only at about 150 in 1960. And hedge funds were a nascent industry. Today we have about 9,000 mutual funds and 10,000 hedge funds. Twenty years ago, hedge funds controlled about $300 billion. Today that figure is 10 times as large. Essentially, Wall Street wants you to believe that, while 60 years ago the markets were operating efficiently with only about 100 actively managed funds, the markets are no longer functioning well when we have close to 20,000 active funds.
ETF.com
http://www.etf.com/sections/features-and-news/swedroe-indexing-fuss-unwarranted
https://www.bloomberg.com/view/articles/2017-04-25/index-funds-are-finally-sexy-what-a-shame
6.Debt as a Percentage of Income in Good Shape….People now feeling flush-savings rate dropping and cash out refis back to highs.
Financial Obligations
The Financial Obligation Ratio compares the amount of debt to the amount of disposable income. How much of your income goes toward loans from mortgages to credit cards and lease payments? That’s what this looks at, and I found it because someone recently showed me how credit card debt in America is at all-time highs. At first glance, that sounds dangerous. Here we go again… But what if people were making two times the amount of money now with credit card debt at all-time highs than in prior years? Debt only matters relative to income or cash on hand. So this chart shows debt as a percent of income:
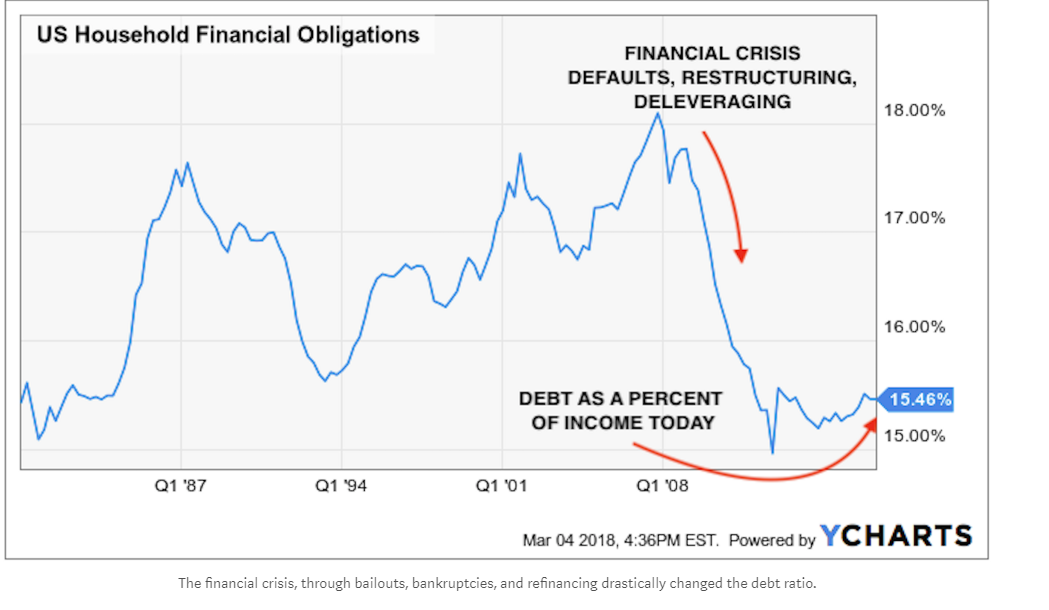
From Abnormal Returns www.abnormalreturns.com
7.Cash Out Refis Hit Pre-Crisis Levels.
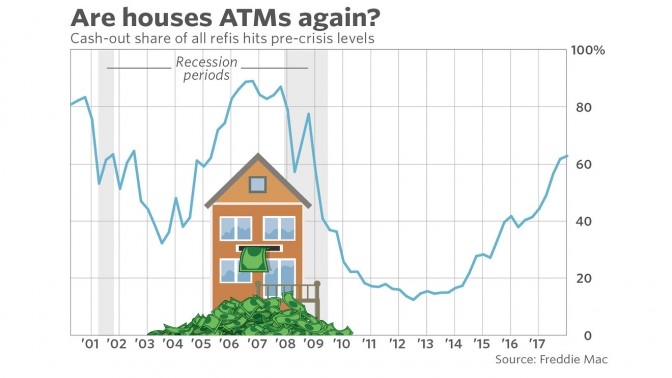
As interest rates rise, fewer households refinance their mortgages. And the refinances that do get done are often very different than those initiated during low-rate periods.
“When rates are low, the primary goal of refinancing is to reduce the monthly payment,” wrote researchers for the Urban Institute in a recent report. “But when rates are high, borrowers have no incentive to refinance for rate reasons. Those who still refinance tend to be driven more by their desire to cash out.”
“Cashing out” is shorthand for taking out a new mortgage that’s bigger than the remaining balance on the old one and using the money that makes up the difference for discretionary purchases.
As of the fourth quarter of last year, the share of all refinances that were cash-outs rose to the highest since 2008, according to Freddie Mac data. Rates have churned higher since the presidential election in late 2016, though they spent much of 2017 reversing the immediate post-election surge.
It’s not clear whether the overall volume of cash-out refinances is rising. Right now they’re making up a bigger share of the pie because traditional lower-monthly-payment refis are plunging.
Cash-out mortgage refis are back — will homes become ATMs again?
Sunday, 01 April 2018 11:03Written by MarketWatch
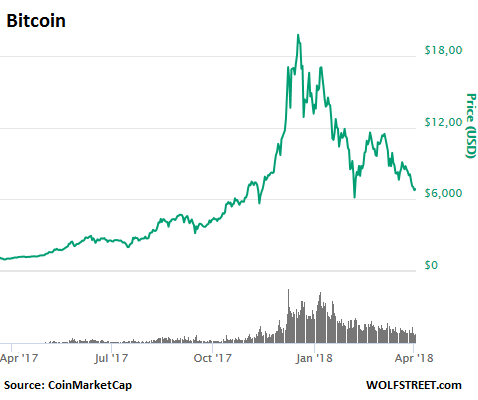
8.Summary of Crypto Crash.
Wolf Street
Here’s how the top five cryptos did over the past few months. Together they account for 76% of the total market cap of the space:
Bitcoin plunged 67% from its peak of $19,982 on December 17, to $6,573 at the moment. In just over three months, its market cap collapsed by $225 billion, from $336 billion to $111 billion. But as this chart shows, nothing goes to heck in a straight line (chart via CoinMarketCap):
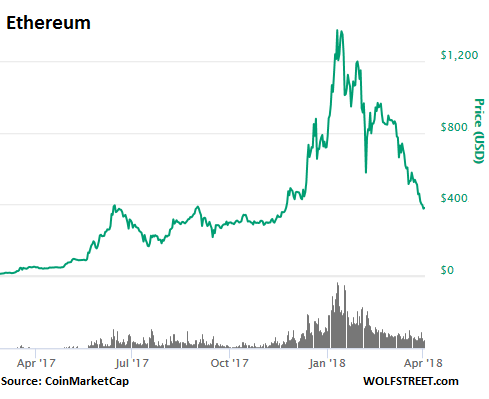
Ethereum plunged 74% from its peak of $1,426 on January 13, to $367 at the moment. Market cap collapsed by $102 billion, from $138 billion to $36 billion (chart via CoinMarketCap):
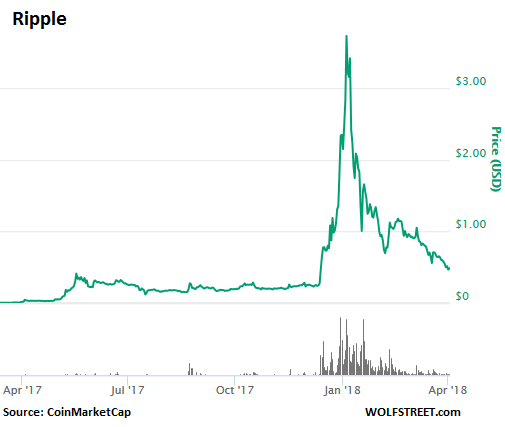
Ripple plunged 88% from its peak of $3.84 on January 4 to $0.47. Over the period, its market cap went from $148 billion to $18 billion. On March 28, when I last wrote about the collapse of Ripple, it was at $0.57, but has since plunged another 18% (chart via CoinMarketCap):
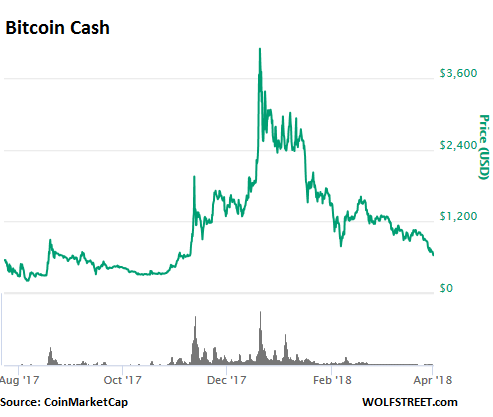
Bitcoin Cash plunged 85% from its peak of $4,138 on December 20 to $632 at the moment. Market cap dropped from $70 billion to $10.8 billion. It was split from Bitcoin last August. On November 12, I featured Bitcoin Cash, in an article subtitled “Peak Crypto Craziness?” I was observing, practically in real time, how it quadrupled in two days to $2,448. It is now back where that quadrupling had started out:
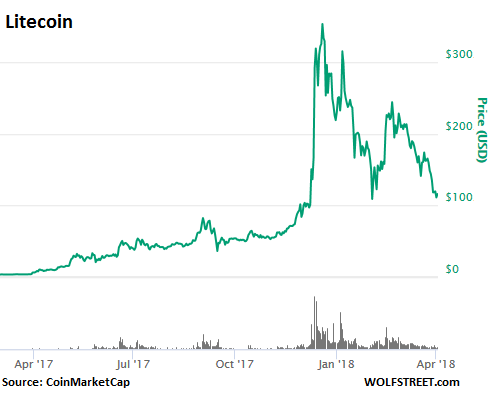
Litecoin plunged 70% from its peak of $363 on December 19, to $110 at the moment. Curiously, its founder admitted on December 20 that he’d wisely cashed out at or near the peak by selling his entire stake. The true believers who bought the tokens have been eating losses ever since. Market cap went from $19.7 billion to $6.2 billion.
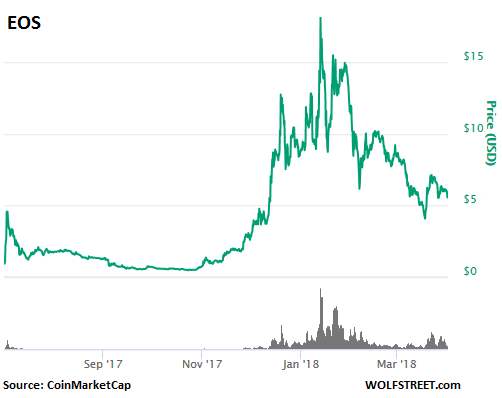
EOS plunged 71% from its peak of $18.16 on January 12, to $5.30. Market cap went from $11 billion to $4.1 billion: I pooh-poohed it on December 18 with “The Hottest, Largest-Ever Cryptocurrency ICO Mindblower.” The purchase agreement that buyers in the ICO had to sign – the ICO was not offered in the US due to legality issues – stated explicitly that holders of EOS have no rights to anything related to the EOS platform, and that they get nothing other than the digital token. Here is what the chart of this scam looks like:
And the blockchain technology (the distributed ledger technology) has nothing to do with cryptos. Cryptos merely use it. There have been a number of efforts underway for years to find large-scale commercial use for blockchain, outside of the crypto space. Those efforts have yet to bear fruit, though they may someday. All we have for now are small-scale experiments. Even if blockchain finds large-scale use, it will do nothing for these collapsing cryptos.
But the ancient theory that nothing goes to heck in a straight line still holds true, borne out by the charts above, and we can expect sharp volatility and a good amount of whiplash on the way there.
And here is an update on the hated “fiat” currency, the US dollar that cryptos were supposed to annihilate or at least obviate. Read… What Could Dethrone the Dollar as Top Reserve Currency?
9.Read of thd Day…3-D Home Finished in One Day, Cost Less Than $10,000.

By Danny Paez
Filed Under Robots
In the near future, suburbs might be built using a combination of high tech wood and volcanic ash. But a recent demo revealed that building new houses could maybe be as easy printing out a movie ticket.
New Story, an international housing non-profit, and ICON, a Texas-based robotics startup, presented the first ready-to-live-in 3D printed home in the United States at the South by Southwest festival in Austin, Texas on March 12, materials for the 650-square-foot, single story, structure cost around $10,000. It was fully constructed in less than a day using ICON’s Vulcan 3D printer.
The house seen at SXSW is the first step in a plan to providing affordable housing to communities in countries like Haiti, El Salvador, and Bolivia. The two organizations are planning on bringing the price of printing these homes down to around $4,000 to make them as affordable as possible.
Article continues below
The process is familiar to anybody who’s seen this sort of 3D-printed magic before: The Vulcan printer squirts out a custom blend of concrete — which is what you’ve seen before — but then it solidifies as it’s printed, in a processes that looks a lot like squeezing toothpaste out of its tube. The walls of the home are build out of multiple snake-like strands of concrete the printer spits out.
Where it’s different from 3D printing is when group of New Story employees then step in and add everything else a 3D printer can’t, like the roof, windows, plumbing, and electrical wiring, on the clock. A New Story representative told Quartz that their goal is to cut down the time it takes to print a house to about six hours.
Dispatching a crew to put the finishing touches to every 3D printed household around the world would take a lot of resources. That is why ICON wants to develop a fleet of robots and drones that could install the windows and paint the exterior autonomously.
This collaborative effort isn’t the first 3D printed house to be created, but it is the first project attempting to make this technology widely available. In a few years’ time there could be neighborhoods of 3D printed homes across the globe.
https://www.inverse.com/article/42474-sxsw-2018-cheap-fast-3d-printed-house
10.The Four Types of Relationships and the Reputational Cue Ball
Reading Time: 3 minutes
There are four types of relationships with people.
- Win Win
- Win Lose
- Lose Win
- Lose Lose
Seneca says “Time discovers truth.”
Only one of those relationships is sustainable over the long-term. And longevity is the key to so many things.
Yet so many of us operate in the short term. Today. This week. This Month. This Quarter. We want to WIN even if that means the other person LOSES.
We rationalize this behavior, arguing that, while it might not be fair today, we’ll make it right in the future. But do you really think that someone who takes advantage of you today with a lopsided deal will make it up to you?
Only this ignores all we know about game theory, biology (survival/evolution), physics (compounding), and psychology (reciprocation).
Reciprocation
The most common strategy in life when you feel like someone is taking advantage of you is tit-for-tat. That is, return what you get. (Newton figured this out long ago.)
The person on the LOSING side of any relationship tends to coil like a spring, the latent energy building with time, frequency, and magnitude of slight. The more they perceive you taking advantage of them, the higher the odds they negatively become spring-loaded. This creates a negative leaping emergent effect. That’s human nature. Given the chance to punish someone that we feel wronged us, even at personal cost, we will often take it.
These outcomes are avoidable.
Biology has taught us that the key to evolving is to be sustainable over a long period of time. We must reproduce. A one-and-done species is not even a footnote in history.
“While others attempt to win every lap around the track, it is crucial to remember that to succeed at investing, you have to be around at the finish.”
— Seth Klarman
And yet so few of us design systems that incorporate duration as an element. We make them short term. Designed to maximize the short run while ensuring we never get on a path of sustainability.
- When you treat people badly they will respond (eventually) in kind.
- When you rip your customers off they will (eventually) go elsewhere.
- When you rip off your suppliers they will (eventually) stop doing business with you or return your behavior in kind.
Anyone can come into an organization and start throwing their title around to get things done. We’ve all met this person. This works for a while but eventually fails. And who is interested in a tactic that only works for a short time?
Ideally, we want something that works for a long time because most of the value in relationships that matter (whether customers, partners, friends) accumulates after the initial period of time.
If you’re offering a lopsided deal to someone, you’re signaling that you’re not in it for the long term. Similarly, if someone is offering you a lopsided deal, they’re signaling they’re not in it for the long term.
While taking advantage of another person or relationship may achieve the desired initial results, it comes at a high cost as it removes you from any path that involves time. And time is the key because most value comes in long-term relationships.
The best results in the world are a function of time. The key component to compounding, which Einstein claimed was the most powerful force in the world, is time.
Peter Kaufman, who published Poor Charlie’s Almanack, describes this as the the Reputational Cue Ball
Non-Win/Win tactics are akin to playing a billiards tournament with a focus on sinking only the first shot or two. Billiards—or life—is a multi-shot game. When we fail to consider the future consequences of mistreating our counter-parties in a current “deal”‘ or first phase, it can wind up leaving our “reputational cue ball” ill-positioned for the next shot—the next deal or phase to come down the pike.