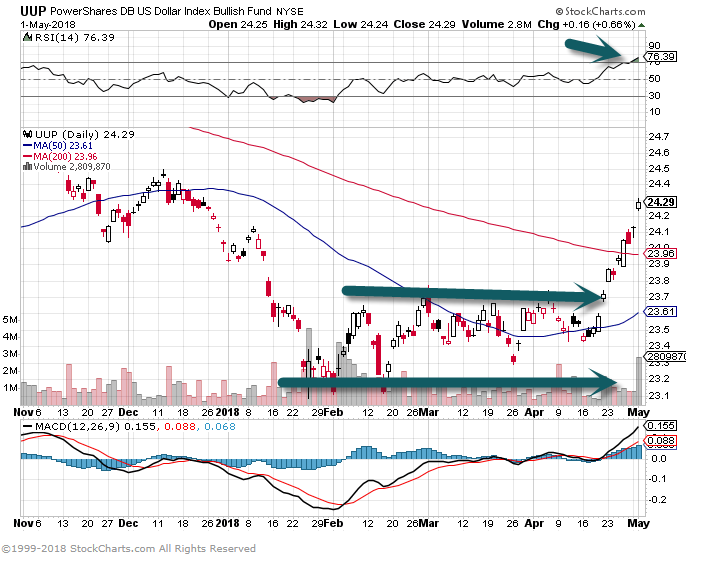
1.U.S. Dollar Rallies Out of 2018 Sideways Move.
U.S. Dollar Bull ETF Pops Out of Range…Big Macro Funds Bet on Dollar Staying Weak.
2.Dollar Strength….Money Poured into Fixed Income During April.
April Huge For Fixed-Income ETFs
International equity ETFs may be the most popular ETFs for 2018 as a whole, but the month of April belonged to fixed-income ETFs. That segment pulled in a cool $15.2 billion during the month, equal to 60% of its year-to-date haul.
Though interest rate risk remains a worry, with multiple Fed rate hikes likely on the way this year and next, rates may have reached an attractive level for some long-term investors.
In the past week, the U.S. 10-year Treasury yield hit a four-year high of 3.04%, while the two-year Treasury yield hit a 10-year high of 2.5%. If interest rates continue creeping up, bond prices will fall further, but for investors content to sit on their positions until maturity, that may not matter.
The iShares Short Treasury Bond ETF (SHV)was the big winner in the fixed-income space during April, with inflows of $2.5 billion. The fund, which holds Treasuries with less than a year to maturity, has a 30-day SEC yield of 1.7%, which suddenly looks attractive after years of near-zero interest rates.
The iShares 20+ Year Treasury Bond ETF (TLT), the iShares Core U.S. Aggregate Bond ETF (AGG) and the iShares Floating Rate Bond ETF (FLOT) were a few other fixed-income winners during the month of April.
For a full list of the ETFs with the largest inflows and outflows for April and 2018 as a whole, see the tables below:
Top Gainers (April 2018)
| Ticker | Name | Issuer | Net Flows ($,mm) | AUM ($M) | % of AUM | YTD 2018 Net Flows($,M) |
| SHV | iShares Short Treasury Bond ETF | BlackRock | 2,525.25 | 13,846.05 | 22.31% | 5,844.42 |
| IVV | iShares Core S&P 500 ETF | BlackRock | 1,844.76 | 143,811.94 | 1.30% | 2,718.82 |
| IEMG | iShares Core MSCI Emerging Markets ETF | BlackRock | 1,836.16 | 50,557.84 | 3.77% | 7,968.17 |
| IEFA | iShares Core MSCI EAFE ETF | BlackRock | 1,813.46 | 58,805.38 | 3.18% | 16,385.59 |
| TLT | iShares 20+ Year Treasury Bond ETF | BlackRock | 1,700.50 | 7,806.94 | 27.85% | 1,116.45 |
| AGG | iShares Core U.S. Aggregate Bond ETF | BlackRock | 1,628.95 | 55,776.76 | 3.01% | 4,390.44 |
| FLOT | iShares Floating Rate Bond ETF | BlackRock | 1,220.95 | 9,110.99 | 15.47% | 2,493.52 |
| GLD | SPDR Gold Trust | State Street Global Advisors | 1,086.24 | 37,004.17 | 3.02% | 1,485.10 |
| LQD | iShares iBoxx $ Investment Grade Corporate Bond ETF | BlackRock | 960.41 | 32,459.27 | 3.05% | -4,788.92 |
| SHY | iShares 1-3 Year Treasury Bond ETF | BlackRock | 942.30 | 12,431.75 | 8.20% | 1,192.10 |
http://www.etf.com/sections/monthly-etf-flows/etf-monthly-fund-flows-april-2018
3.Apple $100B Buyback and 16% Increase in Dividend.
Apple’s Humongous Buybacks Went Into High Gear Last Quarter
By Tiernan Ray
Apple(AAPL) shares this afternoon are up $6.30, or almost 4%, at $175.40, in late trading, as the company’s fiscal Q2 earnings beat, and its forecast was also better for this quarter’s revenue.
Apple’s capital returns, however, will be the focus tonight, as they always are at this time of year when Apple increase the program. Apple said its board of directors authorized anew $100 billion share-repurchase program, and a 16% increase to the dividend.
Those numbers were about as expected on both counts, which is likely helping sentiment on the stock tonight.
The company’s been hard at work spending money on buybacks, too: just this last two quarters, the company repurchased $33.6 billion of its stock, more than the entire $33 billion it bought back in fiscal 2017.
After that rapid buying in the first two quarters, Apple is closer to a stated goal of bringing its net cash to zero, or “near zero.” Its cash at the end of the quarter was $267 billion, against $122 billion of debt, for a net cash position of $145 billion, down from $163 billion in the prior quarter.
By way of some context, the company has to date repurchased $199.6 billion worth of its shares since first instituting buybacks, in May 2012, the year after co-founder and then-Chief Executive Steve Jobspassed away.
That first program was a $10 billion repurchase authorization that was expected to be a three-year pace of purchases. The company increased the plan from $10 billion to $60 billion in 2013, then to $90 billion in 2014, to $140 billion in 2015, to $175 billion in 2016, and then to $210 billion last August. That $210 billion will be exhausted this quarter, the company said today.
As for dividends, Apple lifted its per-share quarterly payout to 73 cents per quarter, with the first increased dividend payable on May 17 to holders of record as of May 14.
That 16% dividend percentage increase is more than the company’s ever done. Last year’s increase, for example, was a 10.5% lift; going three years before that, the dividend was raised 10%, 10.6% and 8%, respectively. The first-ever dividend increase, in 2013, was a 15% boost.
At the current payout rate, Apple’s stock has a 1.7% current yield.
All of these details can be viewed in the capital-returns summary document posted on Apple’s IR site, and its dividend history document.
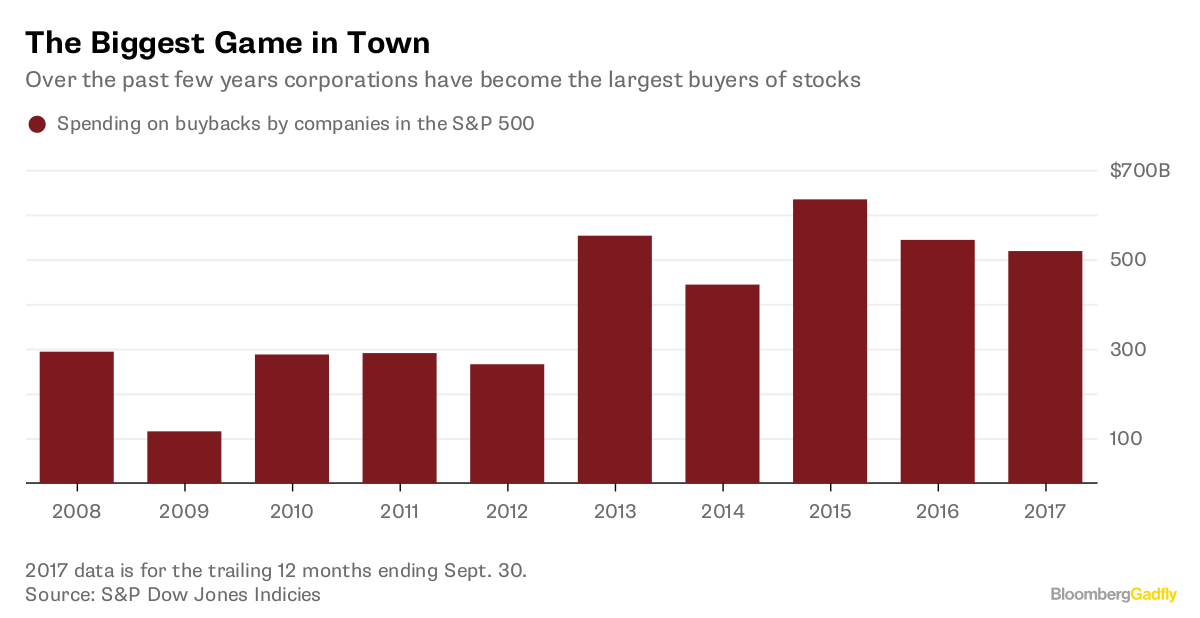
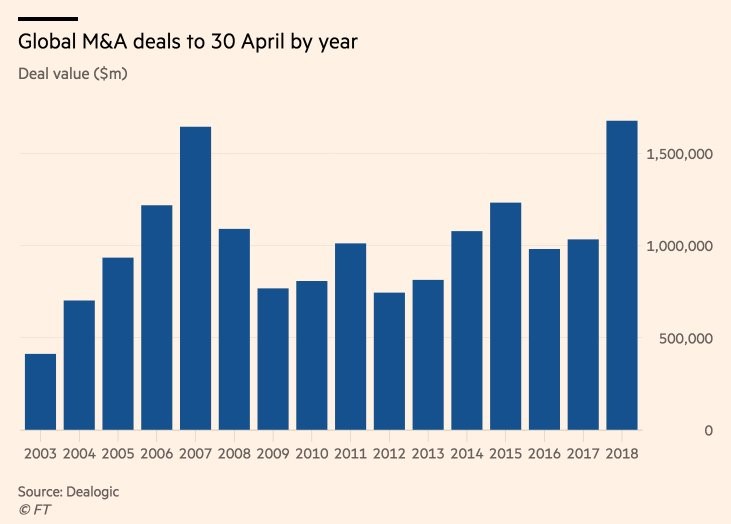
4.Tax Cuts=Buybacks, Dividends and Mergers….2018 $1.7 Trillion in Deals Already…
Merger mania whips up $120bn of tie-ups in just one day
Monday’s flurry of dealmaking takes value of 2018’s global transactions to $1.7tn
https://www.ft.com/content/60a04474-4c97-11e8-8a8e-22951a2d8493
5.Rates Rising ….Watch Stocks with Heavy Debt Loads.
Safety Stocks: Mind the Debt
APRIL 16, 2018
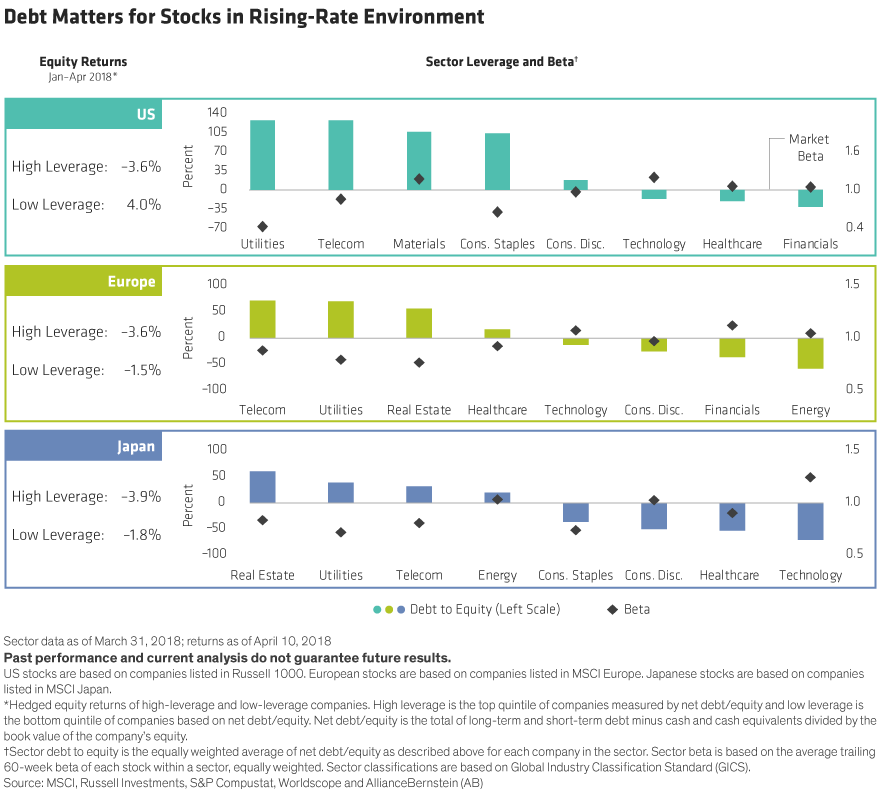
Rising rates are adding new risks to equity markets. Stocks of companies that are saddled with debt have underperformed recently. And leverage is especially high in sectors widely seen as safe havens.
Historically low interest rates have been the norm for more than a decade. When borrowing was so cheap, investors paid relatively little attention to company debt levels. But things are changing.
Our research shows that stocks of companies with high debt ratios underperformed low-leverage stocks in the US, Europe and Japan during the first quarter (Display). Some heavily indebted sectors such as utilities, real estate and consumer staples actually have the lowest beta, meaning they tend to fall less when markets decline and are perceived as relatively safe. In contrast, riskier sectors with beta above the market (greater than 1.0), such as technology and financials, have negative debt positions because they are well capitalized and flush with cash.
Maybe it’s time for investors to abandon the old safety playbook and rethink what defines a risky stock. Beta alone tells a partial story. Investors who seek protection from market volatility in “safety” sectors may find themselves exposed to new risks from rising rates.
The views expressed herein do not constitute research, investment advice or trade recommendations and do not necessarily represent the views of all AB portfolio-management teams.
Bernstein Blog
https://blog.alliancebernstein.com/library/safety-stocks-mind-the-debt
6.Factories Seeing Bottlenecks….Record Waits for Materials.
Together, these forces could restrain manufacturing, which accounts for about 12 percent of the U.S. economy, after solid job gains and global growth spurred a wave of optimism and filled order books over the past year. The constraints — which threaten profit margins — may also blunt the effects of the $1.5 trillion tax cut for corporations and individuals, which was signed by President Donald Trump in December and was aimed partly at revving up factory investment even faster.
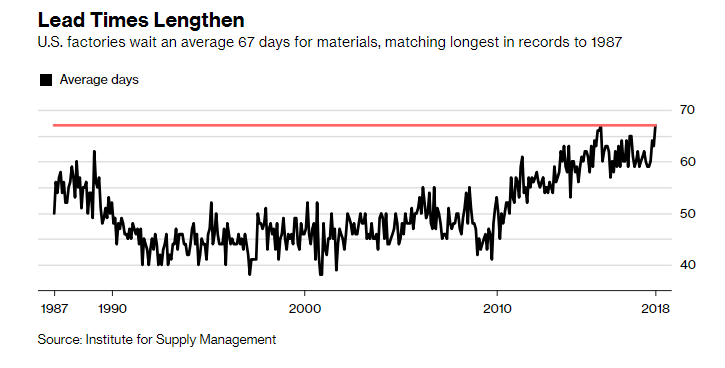
“Overall conditions are solid in the manufacturing sector right now — there’s no doubt about that. But all of this good news could be laying the foundation for a slowdown later on,” Societe Generale senior U.S. economist Omair Sharif said. The added costs to companies for freight transportation and materials, along with higher tariffs, will contribute to a slowdown or even recession in late 2019, he said.
U.S. Factories Are Showing Signs of Buckling From Demand Surge
https://www.bloomberg.com/news/articles/2018-05-02/u-s-factories-are-showing-signs-of-buckling-from-demand-surge
7.Breaking Down the ETF Universe-Alpha Arcitects
The National ETF League (NETFL)(3)(4)
The “Oligarchy, but we all want to be Monarchy” Division
- BlackRock – $1.38 Trillion
- Vanguard – $870 Billion
- State Street – $609 Billion
- Invesco Powershares + Guggenheim – $177 Billion
- Charles Schwab – $107 Billion
The “Strong, Independent, We Don’t Need No Help” Division
- First Trust – $63 Billion
- WisdomTree – $44 Billion
- Van Eck – $36 Billion
- Pacer Financial – $2.1 Billion
- ARK – $1.5 Billion
The “Owned by a Bigger Firm” Division(5)
- PIMCO – $16 Billion (Allianz)
- Global X – $10 Billion (Mirae Asset)
- IndexIQ – $4.2 Billion (New York Life)
- Oppenheimer Funds – $2.5 Billion (Mass Mutual)
The “Ice Cube” Division (For Old School Firms Reinventing For the New School)
- Northern Trust – $17 Billion
- Fidelity – $10 Billion
- Goldman Sachs – $7 Billion
- JPMorgan – $7 Billion
- The Principal Financial Group – $3 Billion
- Victory Capital Management – $2.6 Billion
- Franklin Templeton – $1.2 Billion
- John Hancock – $1.1 Billion
- Virtus – $1 Billion
The “Las Vegas” Division (for firms that are mainly built on leveraged products)
- Proshares – $30 Billion
- Direxion -$13 Billion
The Concentrated “I’m Not Fat, I’m Top Heavy” Division (for firms that have more than 50% of assets in one ETF)(6)
- ALPS – $14 Billion (69% in AMLP)
- Deutsche Bank – $13 Billion (52% in DBEF)
- US Commodity Funds – $3.4 Billion (60% in USO)
- KraneShares – $2.1 Billion (78% in KWEB)
- Columbia – $1.2 Billion (68% in ECON)
- Virtus – $1 Billion (56% in AMZA)(7)
The Mean Girls “You Can’t Sit With Us” ETNs Division (Because, you can’t sit with us, ETNs)
- UBS – $7 Billion
- Barclays Bank – $7 Billion
- Credit Suisse – $4 Billion
The Exemptive Relief Division (For firms who are mainly based on being a white label issuer)
- Exchange Traded Concepts -$5 Billion
- ETF Manager’s Group – $2.5 Billion
- AdvisorShares – $1.1 Billion
The “WisdomTree bought all our assets and now we don’t know what we are doing” Division
- ETF Securities (US) – $2.8 Billion (Under contract according to Eric Balchunas)
Going down the divisions this year, there are two divisions that seem to make the most sense as merger or acquisition targets:
- The Concentrated “I’m Not Fat, I’m Top Heavy” Division: for firms that have more than 50% of assets in one ETF
- These names are interesting for two reasons. The first reason is it makes sense for them to look to merge with a similarly sized firm to reduce the concentration of their assets. Second, due to their concentrated assets, they can be a clean add-on to another asset manager looking to expand into whatever asset class/ETF type their assets are concentrated in. I give some more concrete examples below.
- The “Strong, Independent, We Don’t Need No Help” Division
- These independent firms are clean acquisitions and range in size from small to large asset managers, making them very interesting acquisition targets for all sorts of asset managers.
With that qualitative look, let’s turn to a more quantitative look to see if that tells us anything additional.
Read Wes Gray’s Full Breakdown of ETFs Below
8.Malta and Belize Trade the Most Crypto.
MORGAN STANLEY: Here’s where cryptocurrencies are traded around the globe
Oscar Williams-Grut
3m
5,884
FACEBOOKLINKEDINTWITTER
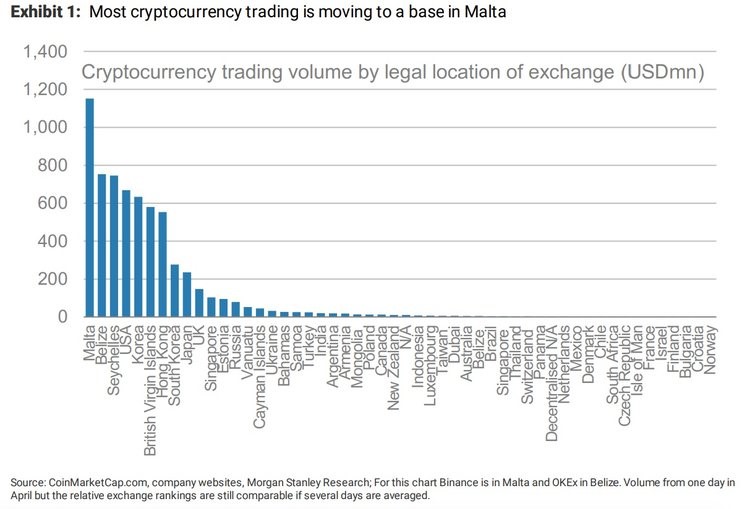
Morgan Stanley’s chart showing cryptocurrency trading volume around the world.Morgan Stanley
- Morgan Stanley has done research into online cryptocurrency exchanges.
- The research shows that the majority of trading volume flows through exchanges registered in Malta.
- The United Kingdom has the highest number of legally registered exchanges but accounts for just 1% of trading volumes.
_________________________________________________________________________________________________________
LONDON — The majority of cryptocurrency exchanges are based in the UK, but the vast amount of volume flows through the small island of Malta, new research shows.
Morgan Stanley analyst Sheena Shah and her team sent a note to clients this week examining cryptocurrency exchanges around the world. Exchanges are the venues on which cryptocurrencies trade and the biggest can see daily trading volumes in the billions.
The investment bank’s research shows that the majority of volumes flow, at least nominally, through Malta. This is largely down to Binance, one of the biggest exchanges in the world, recently announcing plans to shift its legal headquarters to the small European island.
“The largest exchange called Binance announced intentions to set up headquarters there, so if we take that company out, Malta would be much further down the list,” Shah and her team wrote.
“Binance said that it was moving away from Asia (currently registered in Hong Kong) due to more stringent regulation, especially from Japan. The third-largest exchange, OKEx, also recently announced that it was opening an office in Malta as the government markets itself as “Blockchain Island”.”
While Malta dominates when it comes to volumes, the United Kingdom is actually the location of the largest number of exchanges — although the UK accounts for just 1% of global trading volumes, Morgan Stanley notes.
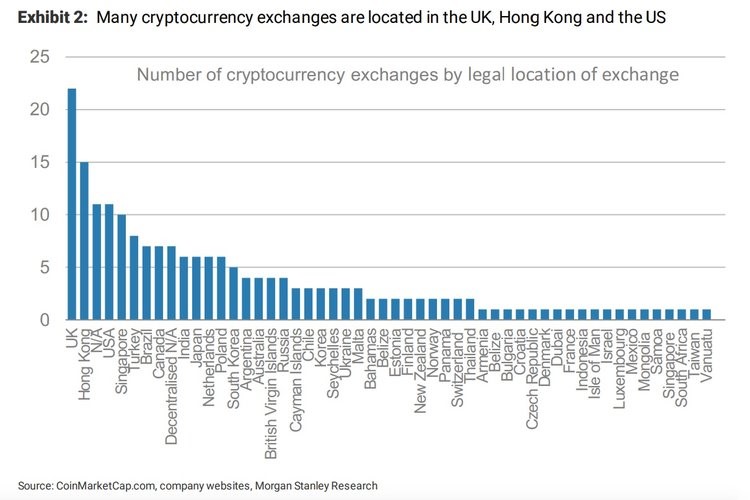 Morgan Stanley
“Most are in the UK, Hong Kong and the US,” Shah and her team note. “The three countries have relatively large financial centres and the US has a technology focus in Silicon Valley.
“There are six exchanges located in India but many are likely to have to shut down or relocate as this month the central bank ordered commercial banks to close accounts with exchanges.”
Cryptocurrency exchanges have come under increasing scrutiny from regulators worldwide as more and more money as flowed into the sector over the last year. While some countries such as India and the US have sought to crackdown on the activity, countries and territories such as Switzerland, Gibraltar, and Malta have sought to attract the nascent industry to their shores.
“The blockchain and cryptocurrency industry is growing rapidly and can have economic benefits for a particular country through the creation of start-ups (good for jobs), research and development and financial transactions,” Shah and team write. “Governments are having to consider their regulatory stance quickly.”
“Defined but also attractive regulation makes an exchange decide to choose one country over another – a set of laws for companies to follow when handling digital tokens, customer assets, AML policies, taxes, etc. Regulatory certainty is part of the attractiveness for the companies so they can plan for the future as they know what to expect. Low taxes are a benefit.”
Get the latest Bitcoin price here.>>
http://www.businessinsider.com/cryptocurrency-exchanges-trading-locations-volumes-2018-4
9.Read of the Day…The Cost of Waiting.
The Cost of Waiting
Posted May 1, 2018 by Michael Batnick
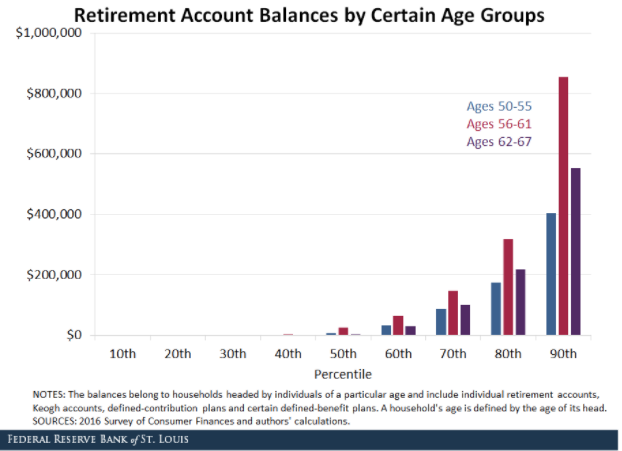
Baby Boomers did not do a great job preparing for their future. The median retirement account balance for people ages 56-61 is just $25,000. This could have been accomplished by contributing just $6 a month into a 60/40 portfolio (since 1980).
Ask somebody whether they would prefer $100 today or $500 in twenty years, most people would choose the former. But if you would ask somebody how they would like to grow their money at 8.4% for twenty years, turning $1 into $5, they would likely say “where do I sign?” This is a framing issue, but it’s deeper than just the way the question is asked. It’s in our nature to seek instant gratification.
We have no relationship with our future self. We’re loyal to ourselves today.
In a 2011 study, increasing saving behavior through age-progressed renderings of the future self, participants were shown computer-generated representations of what they might look like in retirement and were then asked to make decisions whether to consume today or save for the future. Seeing these images had a big influence on behavior because “saving is like a choice between spending money today or giving it to a stranger years from now.”
In the first of four studies, participants who were exposed to their future selves allocated more than twice as much money toward the retirement account than did participants who were exposed to their current selves. The other three showed similar findings. Seeing what they’ll look like in the future established a relationship with themselves that made them more likely to save.
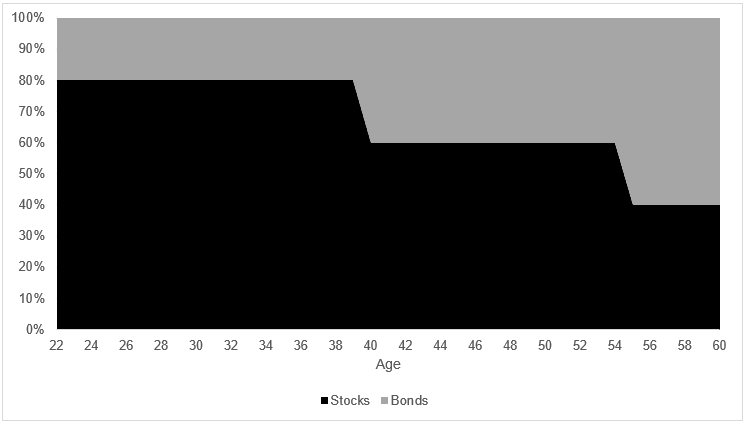
Getting back to where we are today, the 90th percentile of retirement accounts is $855,000. Let’s use this as a jumping off point to show the cost that delaying saving has on our future. In this exercise, I’m making the ridiculous assumption that a sixty-year old person came into the work force at 22 years old in 1980 followed this allocation: 80% stocks 20% bonds from 22 through 39, 60% stocks 40% bonds from 40 through 54, and 40% stocks 60% bonds from 55 through today, at age 60.
The table below shows the actual cost of waiting. In order to arrive at $855k today, the 90th percentile, you would have needed to save $159 a month, and increase that amount each month commensurate with inflation. Using a 10% pre-tax savings rate, you would have had to be making $61,200 in 1980, using today’s dollars.
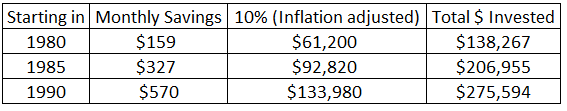
If you waited just five years, using the same 10% rule, you would have needed to save $327 a month, again increasing it each month commensurate with inflation. The $206,955 invested is $68,688 more than had this person started five years earlier. Finally, had you waited ten years to get started, you would need to begin saving $570, which meant that your pre-tax income had to be $134k to stay with the 10% rule. Delaying retirement savings from age 22 to 32 means that you would have had to save $137,000 more to keep up with the person who started ten years earlier. Starting early is more important than earning higher returns. You’re better off earning 6% for thirty years than 9% for twenty years.
Too many people can’t afford to save money, but if you’re reading this post, you’re probably not one of them. Don’t delay. Think about your self today. That’s who you’ll be tomorrow.
Source:
http://theirrelevantinvestor.com/2018/05/01/the-cost-of-waiting/
10.7 Absolutely Certain Ways to Grow as a Leader
You can change your future, by changing your habits today.
By Lolly DaskalPresident and CEO, Lead From Within@LollyDaskal
Are you interested in growing as a leader, or just in getting ahead? In my job as a leadership coach, I see lots of people who want to advance. But my work is much easier–and the odds of moving ahead are much better–when the person I’m coaching wants to be coached and is focused on their own growth instead of an outcome they can’t fully control.
Here are seven opportunities to grow as a leader, the more closely you follow them, the better your chances of success.
- Identify your motivation.
How you feel about yourself starts with how motivated you are. It takes self-motivation to remove the obstacles that keep you from developing and growing–and ultimately all motivation is self-motivation. Before you can grow as a leader, you must know the “why” behind your drive. Once you do, you will know the way.
- Unmask your flaws.
To conquer your flaws, you must first accept them. Once you know your weaknesses, no one else can use them against you, and you’re better prepared to grow as a leader. Everyone has flaws, but when you understand your own you can embrace all of who you are.
- Learn from your failures.
Growing as a leader means developing the ability and willingness to have your failures shape you. Failure is instructive–it allows you as a leader to learn. We all fall down, but failure means we refuse to get back up and deal with our issues.
- Appreciate feedback.
No one likes hearing that they’ve done something wrong, but try to view all feedback as a gift, an opportunity to develop. The best leaders realize feedback helps them improve so they can do better. We all need people in our lives who can give us feedback; seek it with sincerity and receive it with grace.
- Listen to those with more experience.
Listen to the experienced people in your life–not because they’re always right, but because they have a better understanding of being wrong. To grow in wisdom you need to pay attention to those who have experience. They can teach you to listen when you want to speak, to stop and think when you want to react, to keep trying when you want to quit. And each of those little steps will help you grow into a great leader.
- Refuse to settle for mediocrity.
Don’t allow your fears to limit you to mediocrity. If you want to pursue excellence, it takes hard work. If you want to go beyond what’s expected, you have to evolve and grow to advance and make progress. The best leaders–the ones who really want to grow–never settle for mediocrity. They understand that good enough is not good enough.
- Invest in yourself.
If you’re truly interested in growth, create an environment in which you can invest in yourself so you can be at your best. Make time to read; surround yourself with clever people and experts. Investing in yourself pays high dividends, because when you feel good about yourself you are more motivated to work hard and succeed and grow.
At the end of the day, you’ll take one of two paths as a leader: either you’ll step forward into growth or backward into safety. The choice is yours.
https://www.inc.com/lolly-daskal/7-opportunities-you-have-every-day-to-grow-as-a-leader.html