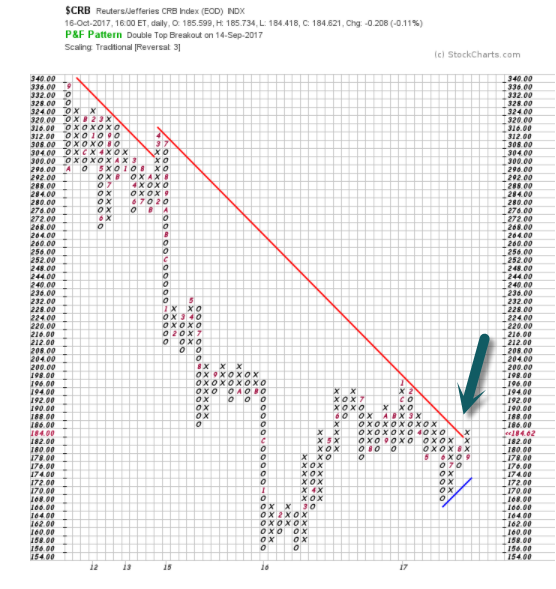
1.Inflation? Commodity Index …One Thing that Continues to Perplex the FED is Lack of Inflation so Watching Commodities.
CRB Commodity Index about to make new high for the year.
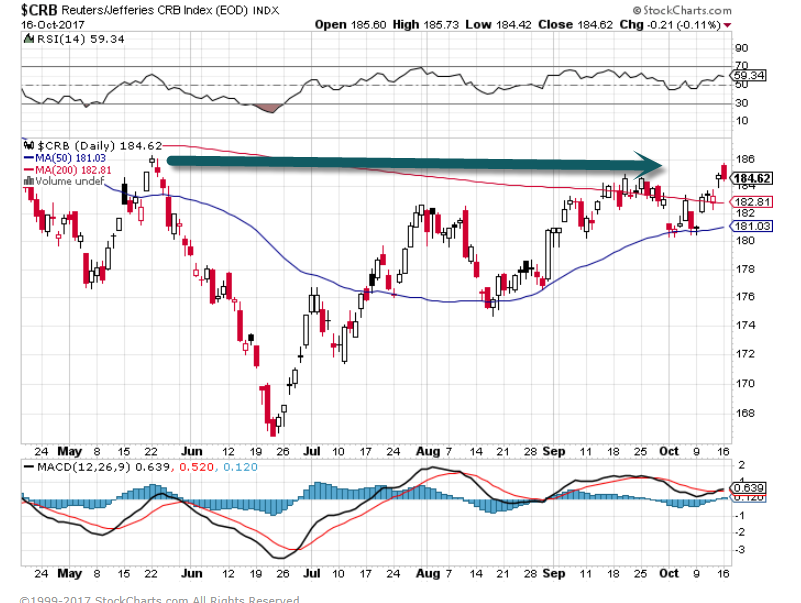
Commodity index ticks above RED downtrend line going back to 2010
 Torsten Slok
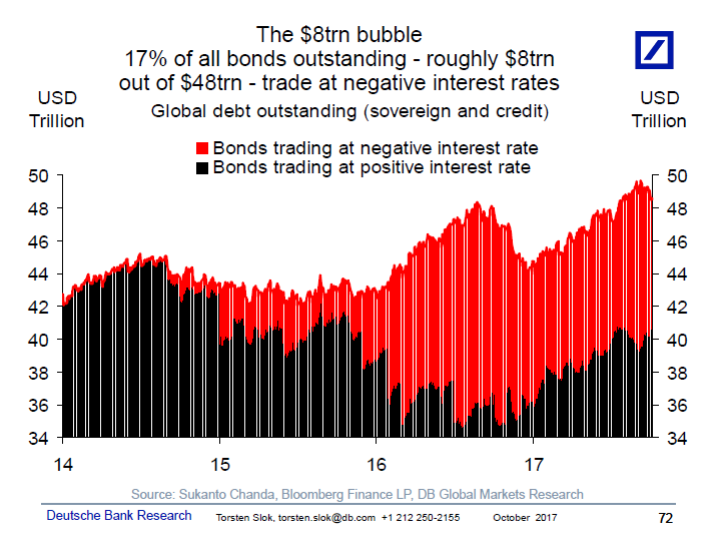
Sometimes clients ask me “Where is the bubble in financial markets?”. I think the answer to that question is easy: It is the red area in the chart below. $8trn in global debt is trading at negative interest rates. Think about it; almost a decade after the financial crisis we still have $8trn in bonds which yield negative returns.
It is the unattractiveness of these bonds for investors which is the biggest bubble in markets today. These $8trn in negative yielding assets have forced investors around the world into all kinds of other asset classes such as IG credit, loans, mortgages, HY bonds, equities, and even emerging markets fixed income and equities.
The Fed running down their balance sheet by a 50 billion here and $50 billion there is not going to make a difference to this chart. The real test will be when the red area in the chart below turns black. When these $8trn suddenly begin to yield a positive return how are global investors going to react? The fear is that when the risk-free interest rate goes higher then credit spreads will widen and equities underperform as investors leave risky assets and come home to higher-yielding government bonds. In finance terms, if the risk-free rate goes higher why should I then be buying risky assets?
When will this bubble burst? It will happen the day we begin to see inflation in the US. Because higher US inflation will mean more and faster rate hikes from the Fed, which will mean higher rates globally, including in Europe and also Japan. The good news is that consensus doesn’t expect US core inflation to move higher until 2018Q2. The bad news is that the $8trn in the chart below shows that investors don’t believe we will ever see inflation again. The bottom line is that the central bank exit has barely started and once inflation does start to move higher then checking out from Hotel Easy Money will be a lot more difficult than checking in.
Torsten Sløk, Ph.D.
Tel: 212 250 2155
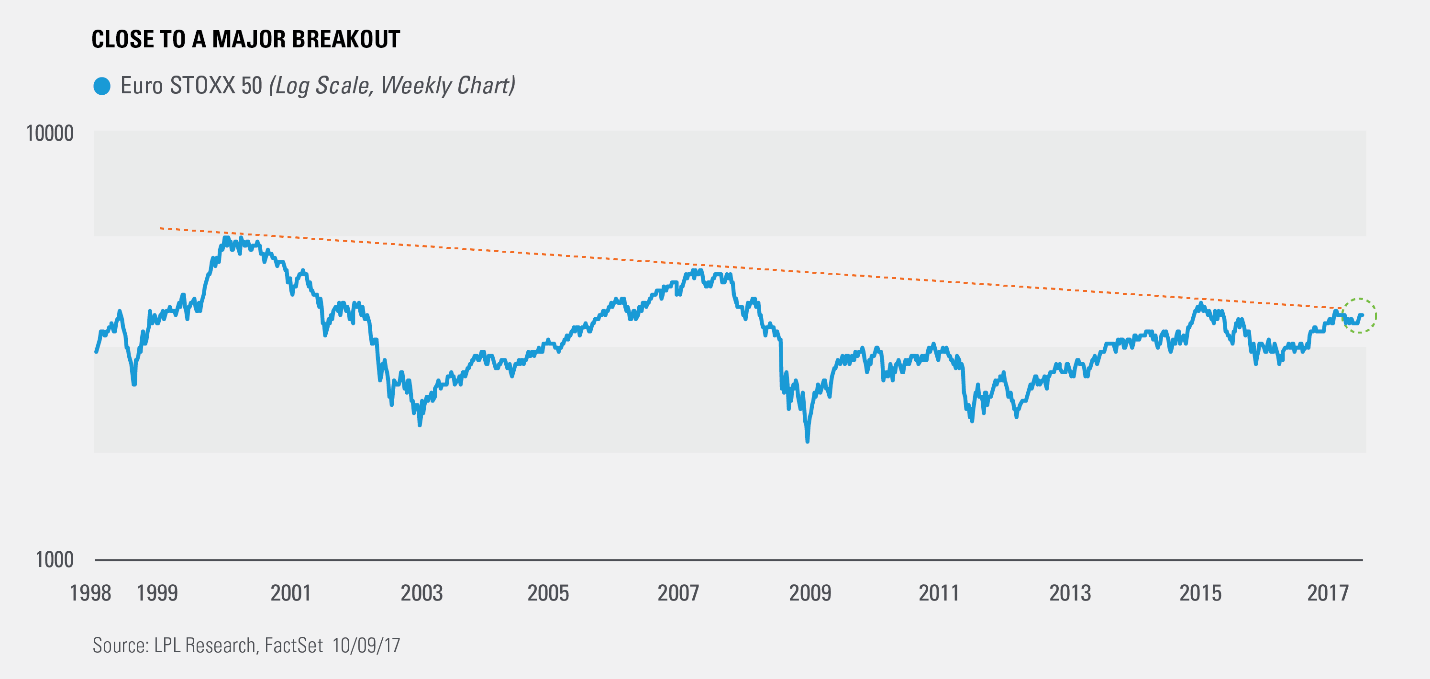
Here’s where things get interesting. The monthly chart above shows the Euro STOXX 50 has broken above its long-term trend, but the weekly chart below shows us that the breakout hasn’t happened yet. This is why it is important to look at varying timeframes.
Given various global markets are already breaking out, it is likely only a matter of time until the Euro STOXX 50 breaks out above this trendline. Per Ryan Detrick, Senior Market Strategist, “Though when looking out into 2018 we continue to see better opportunities domestically and in emerging markets, Europe is finally pulling its own weight. This is yet another sign that we are amid a global bull market and it should continue into 2018, if not further.”
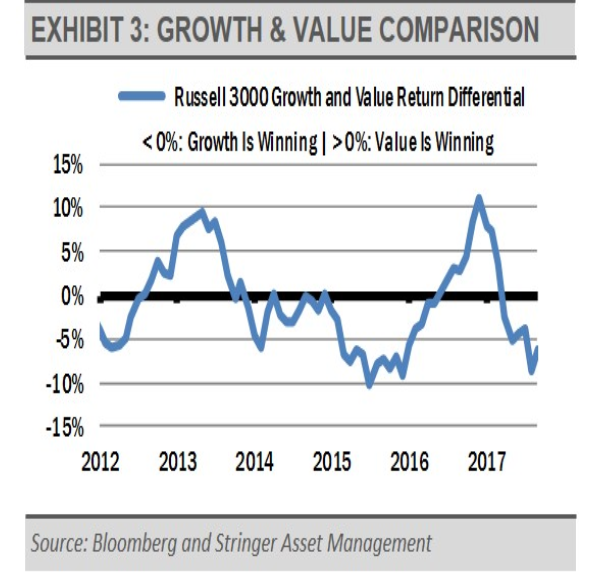
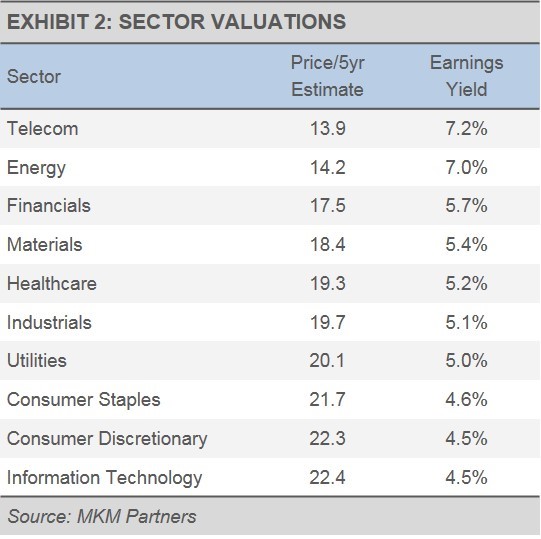
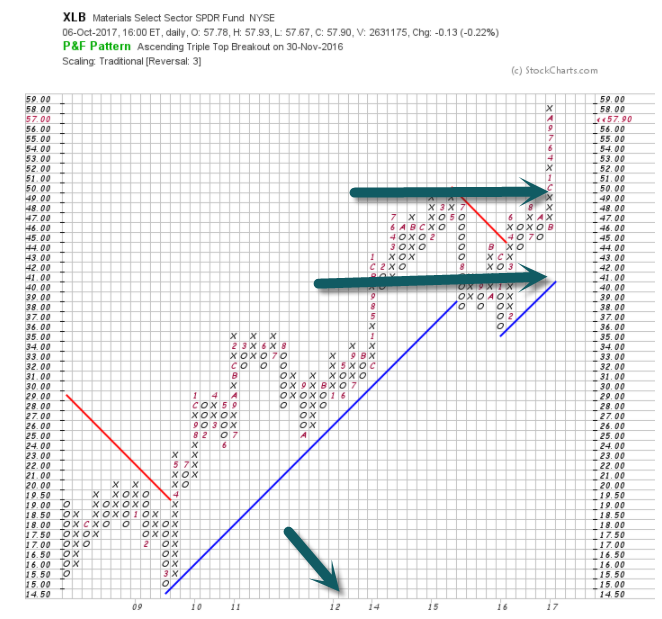
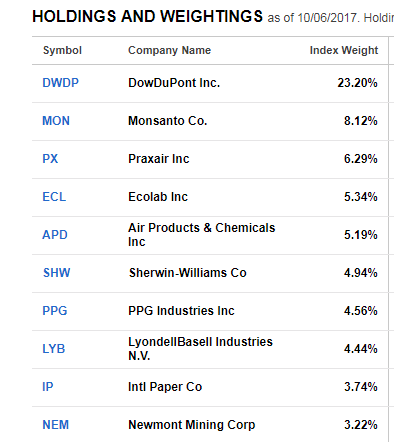
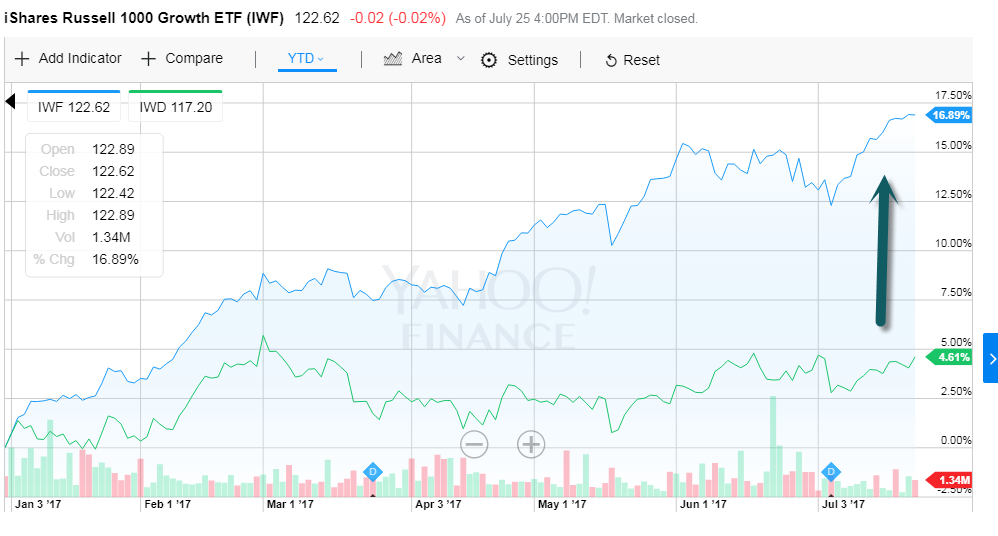
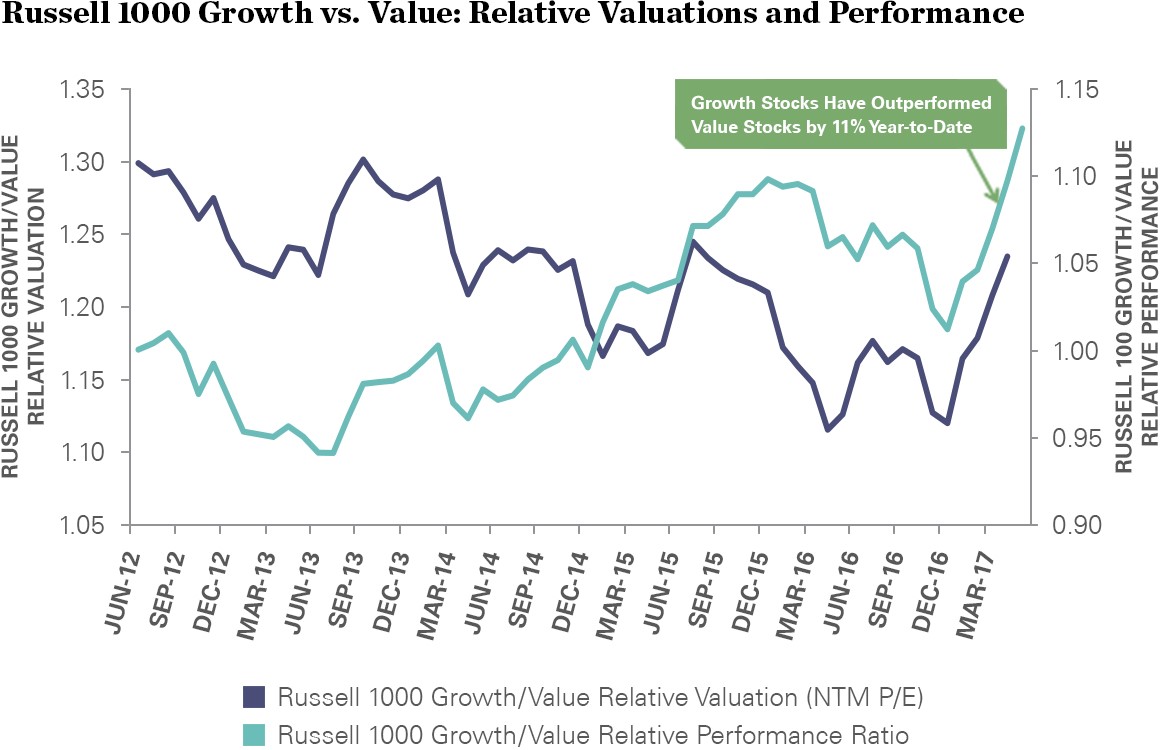
As the domestic equity market has appreciated this year, performance has been led by companies in the traditional growth style sectors, such as information technology. The value style has lagged, which results in interesting price dispersions that can create opportunities for investors.
http://www.etf.com/sections/etf-strategist-corner/value-about-outperform-growth/page/0/1
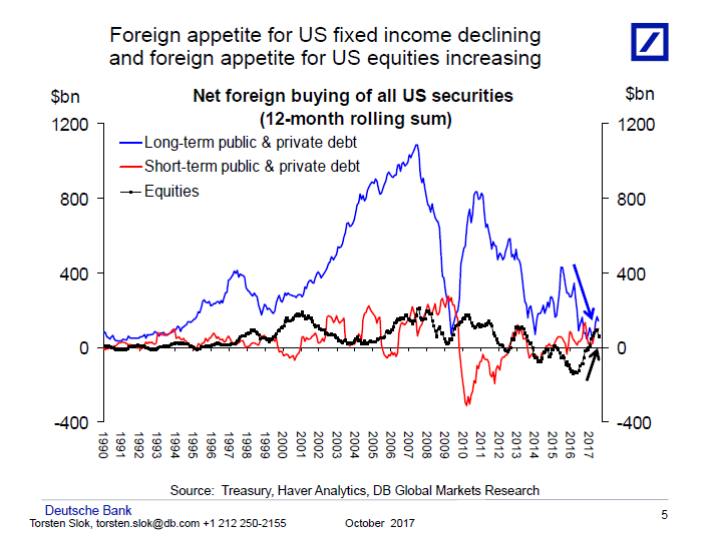
This chart book looks at who is buying and selling US assets and a striking recent trend is the decline in foreign appetite for US fixed income and increase in foreign appetite for US equities, see chart below and chart book here: http://pull.db-gmresearch.com/cgi-bin/pull/DocPull/11626-F2BF/269784806/f77e8642-a92e-11e7-a585-056cc5e4a602_604.pdf
Torsten Sløk, Ph.D.
Chief International Economist
Managing Director
Deutsche Bank Securities
60 Wall Street
New York, New York 10005
Tel: 212 250 2155
Source: Danske Bank, @joshdigga
Sep 25, 2017
The S&P 500 is currently up more than 1% during the month of September, and if it can simply finish the month in the green, it will be considered a big win given that September has historically been the worst month of the year for stocks.
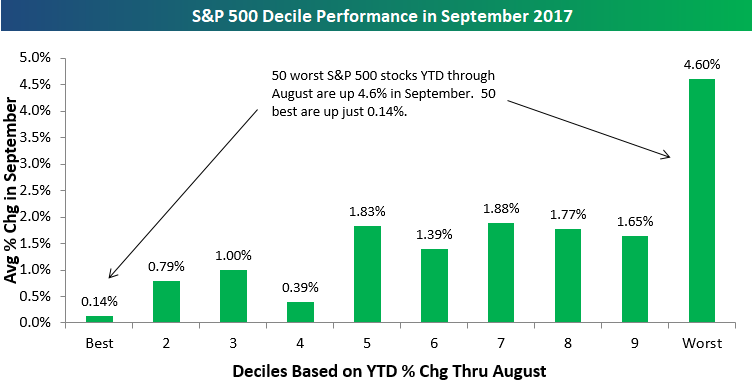
What’s interesting about the market’s performance this month is the underlying stocks that are driving major indices higher. We broke the S&P 500 into deciles (10 groups of 50 stocks each) based on year-to-date performance through August to see how the year’s biggest winners and losers heading into September are doing this month.
As shown below, it’s 2017’s biggest losers that have posted the biggest gains in September, while the year’s biggest winners have taken a breather. The 50 S&P 500 stocks that were performing the worst on a YTD basis through August are up 4.6% in September, while the 50 best-performing stocks YTD through August are up just 0.14%.
These stats show that momentum traders are likely under-performing in September. If you stuck your neck out and bought the most beaten down names, you’re likely having a banner month.
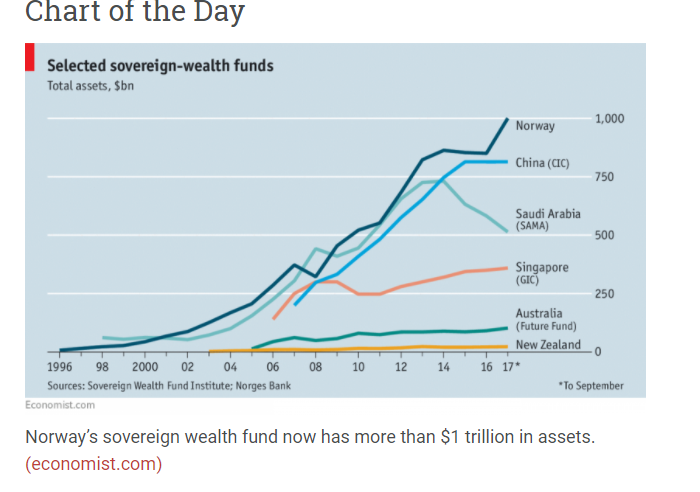
When I posted the map of Norway a few days ago, Annie made a comment saying that she didn’t really know the scale of the country and that it was interesting to compare it with its neighbors. When reading that, my very technologically advanced boyfriend said he could make a graphic superimposing Norway atop a map of the US, to see the size in comparison. And here it is! As you can see, it is a long and narrow country, almost as long as the US East Coast. On the West Coast, it would cover the distance from San Diego to Seattle. Enjoy:

Graphic: JY
A few facts:
http://www.slowtrav.com/blog/chiocciola/2009/02/map_of_norway_in_relation_to_t.html
http://www.barrons.com/articles/big-ipo-gain-dont-bet-on-it-1505529036
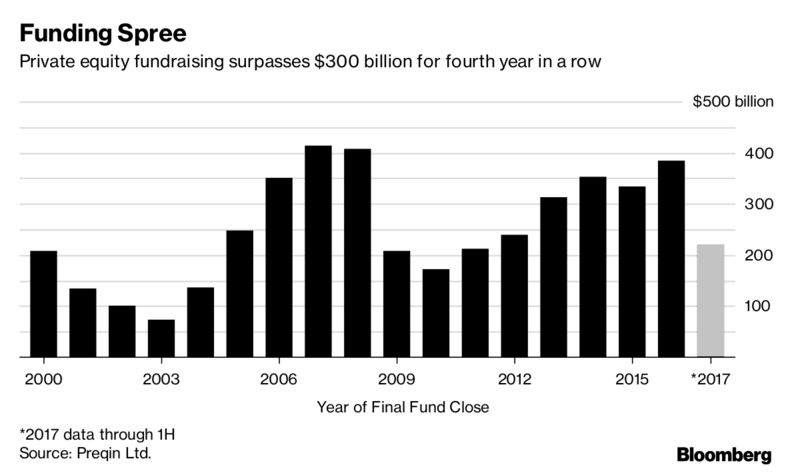
https://www.bloomberg.com/news/articles/2017-08-08/why-private-equity-is-betting-on-your-online-shopping-addiction
Sep 11, 2017
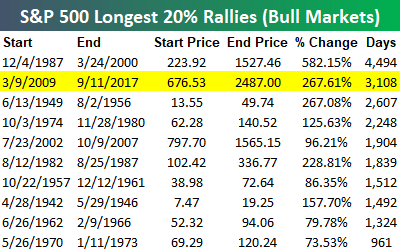
Back in late July we published a Chart of the Day looking at the current rally and how it ranks in terms of length without a significant pullback of any kind. With the S&P 500 closing at a new all-time high today, it has now been 3,108 calendar days since the last 20% decline (the standard bull/bear market distinction). As shown in the table below of the longest bull markets on record, the current bull is the second longest behind the 4,494 days that passed between December 1987 and March 2000 without a 20%+ pullback.
Today’s close was also a big deal in terms of gains for the current bull market. As shown, the S&P’s gain of 267.61% makes this the second strongest bull market on record as well.
It has also been a long time since the S&P 500 had a 10% correction. As shown, the current streak of 578 days since the last 10%+ correction is the 11th longest on record going back to 1928.
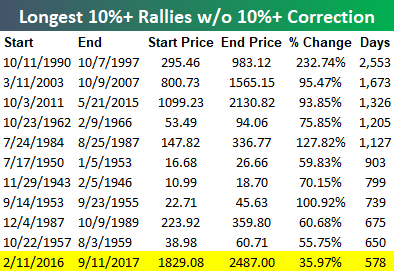
Not only have we not had a 10% correction in more than 18 months, but we also haven’t even had a 5%+ correction since last June. The 441-day streak without a 5%+ correction is the sixth longest on record for the S&P 500.
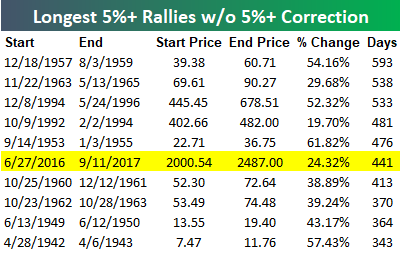
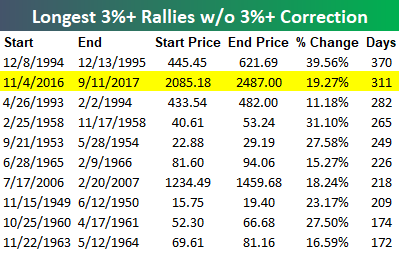
And finally, it has now been 311 days since the S&P 500 last experienced just a 3% pullback. As shown below, this is the 2nd longest streak of all-time without a 3%+ pullback.
To break this record, we’ll need to go another 59 days without declining 3% from today’s close.
Pay just $1 to access any of Bespoke’s premium membership levels for the next month!
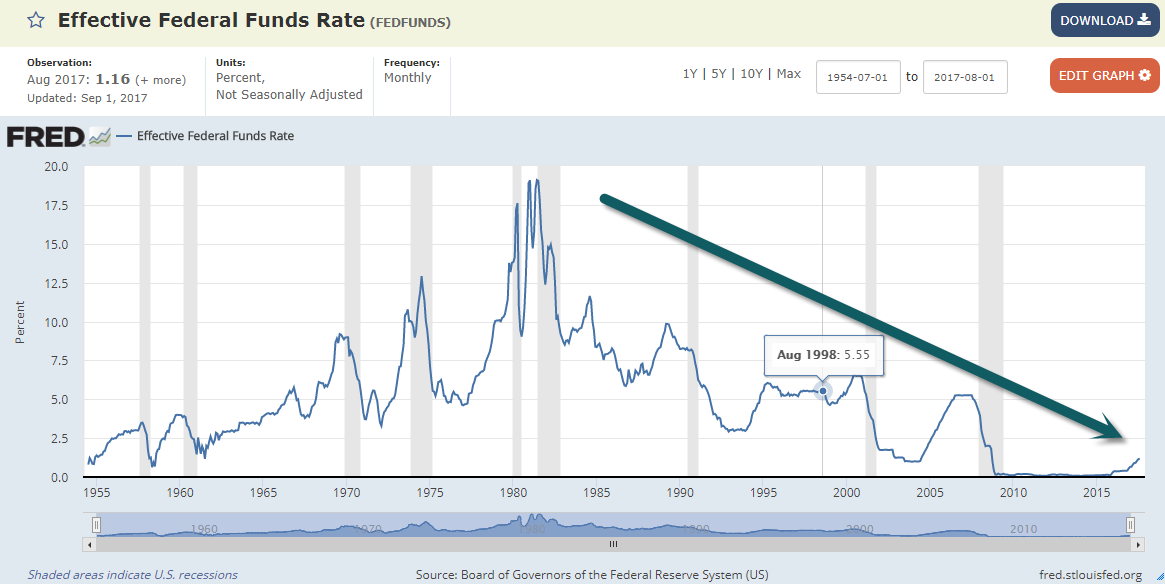
Looking back over six decades, the Wells Fargo team found that the tipping point came when the fed-funds rate exceeded the 10-year Treasury yield’s cyclical low. This has predicted every recession since 1955, with an average lead time of 17 months—producing a significantly earlier warning signal than waiting for the yield curve actually to invert.
What about the current cycle? The 10-year Treasury’s low yield was 1.36%, touched on July 5, 2016. An increase in the fed-funds rate to 1.5%, which the Wells Fargo economists expect at the December FOMC meeting, would trigger the recession early-warning signal. Specifically, their research puts a 69.2% probability of a downturn within 17 months after that.
http://www.barrons.com/articles/trump-and-the-art-of-the-deficit-1504932418
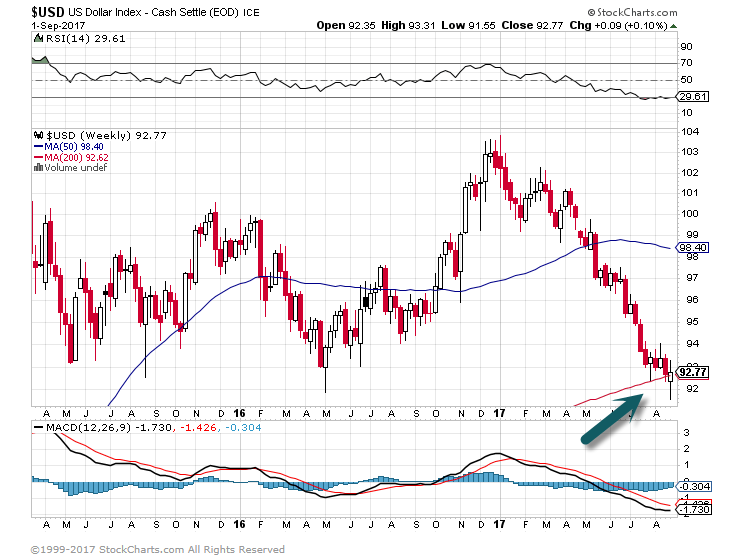
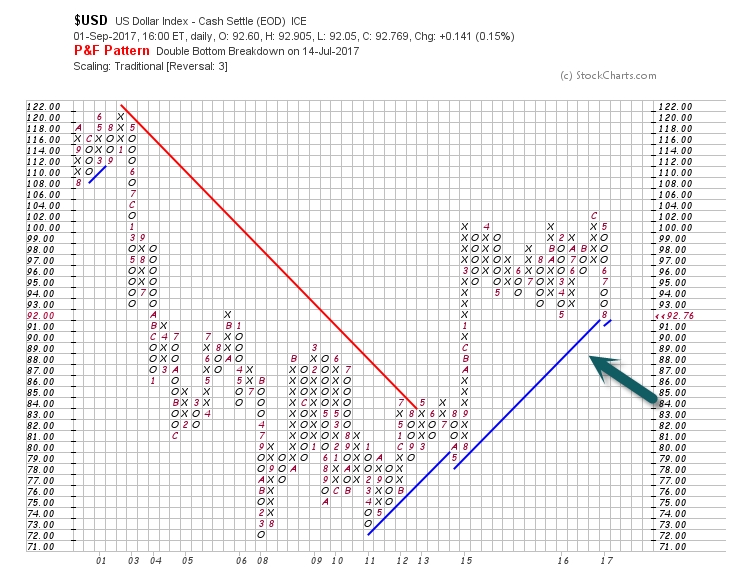
 IAT-breaks 200day back to June lows.
WSJ-
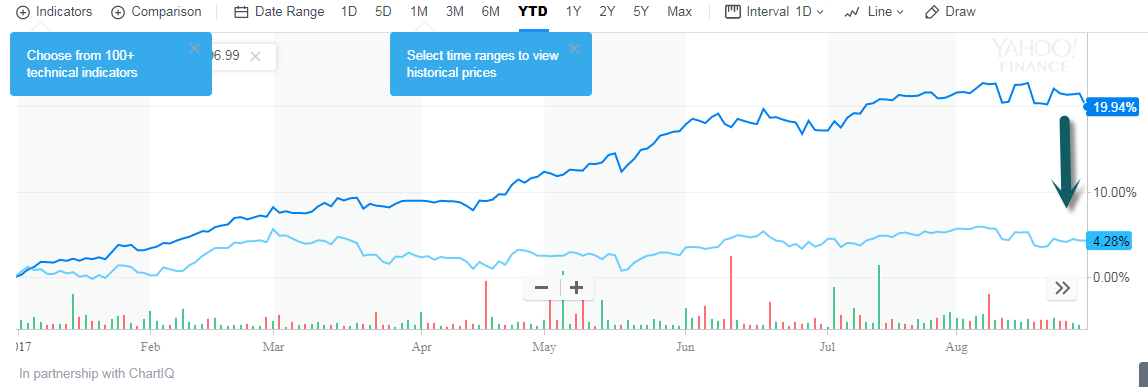
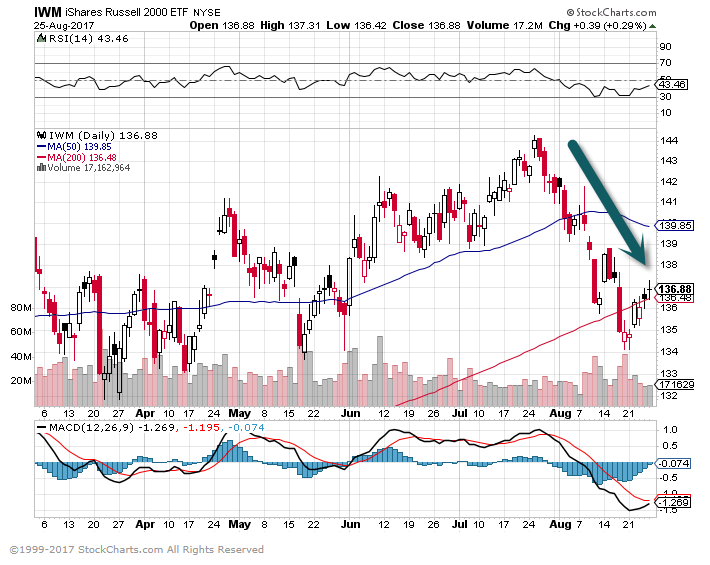
Shares in U.S. companies with more than half their revenue from outside the country rose by an average of 13%, identical to the gain on MSCI’s (dollar-denominated) index of developed markets excluding the U.S. S&P stocks with less than half their income from abroad gained only 5.9%, according to analysis of FactSet data.
The pattern is even clearer when the market is sliced into five segments from those most exposed to foreign revenues to those least exposed. The most-international fifth of stocks have gained 15% on average this year, while the least-international are up just 2%
https://www.wsj.com/articles/watch-out-the-weak-dollar-gives-shareholders-money-illusion-1504195376
Ed Yardeni
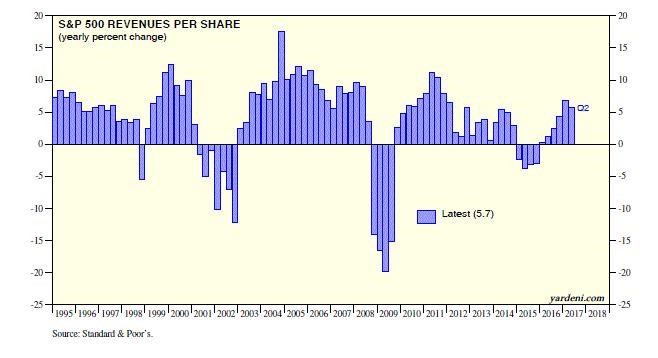
Some sectors shone more brightly than others during Q2. Here is the y/y performance derby for the S&P 500 revenues growth: Energy (14.3%), Tech (9.7), Industrials (7.8), S&P 500 (5.7), Utilities (5.3), Consumer Staples (4.8), Financials ex-Real Estate (4.4), Consumer Discretionary (3.5), Health Care (2.4), Real Estate (0.8), Materials (-1.4), and Telecom (-3.9).
Here is the same for earnings growth: Energy (returned to a profit), Telecom (45.8%), Tech (34.3), S&P 500 (19.6), Utilities (14.2), Financials ex-Real Estate (13.0), Industrials (12.5), Health Care (8.6), Consumer Staples (6.7), Consumer Discretionary (1.9), Materials (-0.4), and Real Estate (-14.6).
https://www.linkedin.com/pulse/sp-500-earnings-shining-edward-yardeni
An index tracking business conditions for U.S. private companies surged 44 percent from a year earlier.
By
Isabel Gottlieb
August 11, 2017, 8:00 AM EDT
There’s rarely been a better time for American technology startups.
The Bloomberg U.S. Startups Barometer, which tracks the business conditions for U.S.-based private technology companies, reached a record high. A 44 percent increase from a year earlier was driven by a surge in the number of businesses that raised money for the first time, reflecting investors’ appetite to back the riskiest companies. The index, which goes back to 2007, doesn’t account for the frenetic days of the dot-com bubble.
“If you’re leaving Google or Facebook to go do your startup, this is probably the best time ever to do so,” said Wesley Chan, managing director at the venture capital firm Felicis Ventures. “There’s a lot of frothiness in early stage and seed investing.”
https://www.guggenheimpartners.com/cmspages/getfile.aspx?guid=8db18c30-ea6a-4b35-9e5f-cc00f7bba3df
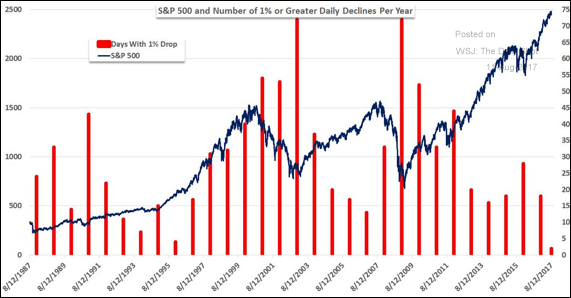
Source: @JohnKicklighter
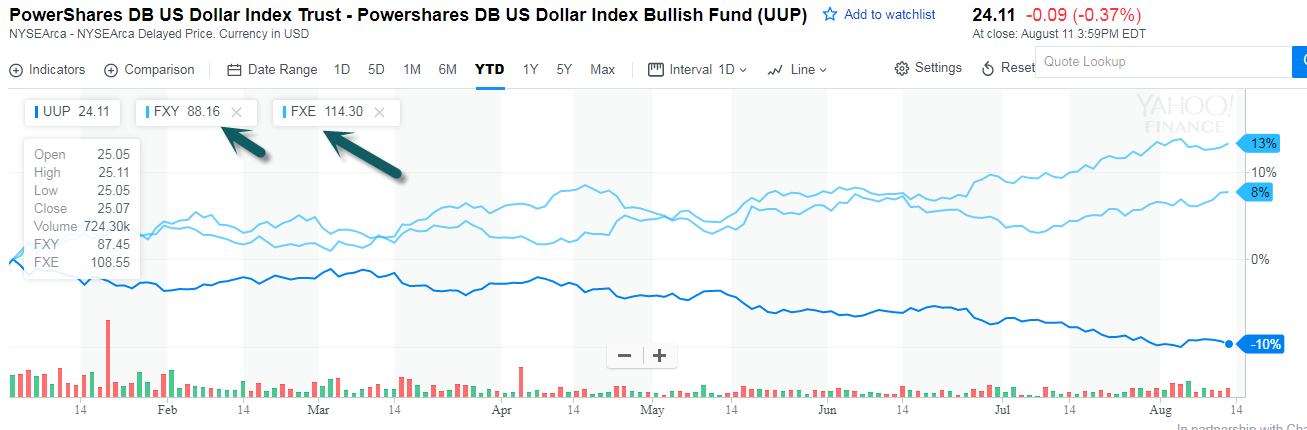
Barrons Story
The Bad News Buck
The dollar has declined against every major currency in 2017, and is down 11% against the euro, 6% against the yen and 5% against the pound sterling.
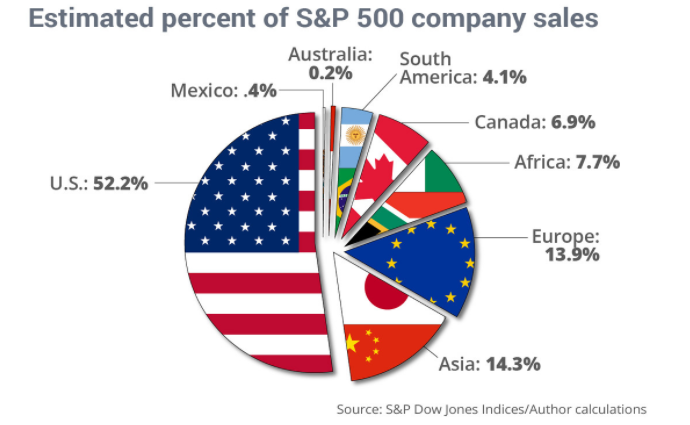
The buck has declined against every major currency in 2017; it’s down 11% against the euro, 7% against the yen, and 5% against the pound sterling. This boosts U.S. exports, pads the buying power of visitors, and has widespread impact in the stock market: Technology companies’ strong sales, nearly 60% of which are earned abroad, look even stronger when translated back into dollars. The 50 stocks in the Standard & Poor’s 500 index with the most overseas revenues surged 13.8% in the first half, versus 1.3% for the 50 with the most domestic sales, notes Bespoke Investment Group.
http://www.barrons.com/articles/the-bad-news-buck-1502505659
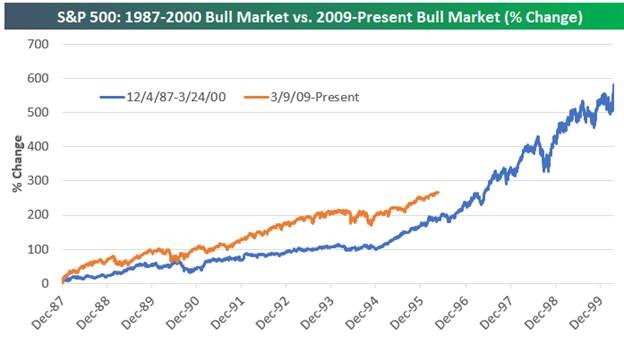
https://www.bespokepremium.com/think-big-blog/
See my blog post on comparisons to 1999

This long-running hot streak in the tech sector has led to forecasts of another 1999 bubble. It has sparked future doom from a host of soothsayers, who have been waiting for their gloomy predictions to come true since the global financial crisis ended in 2009. Since the crisis, today’s Wall Street Masters of the Universe are not the traders popularized in Michael Lewis’s original book “Liars Poker.” Nor are they the superstar investment bankers of the Internet boom. Instead, they’re a bunch of unknown hedge fund managers that predicted a crash in 2008 and made a fortune in its aftermath. Since that event, headline grabbers on Wall Street have shifted from tireless cheerleaders of the rising bull market to pessimists predicting the next crash.
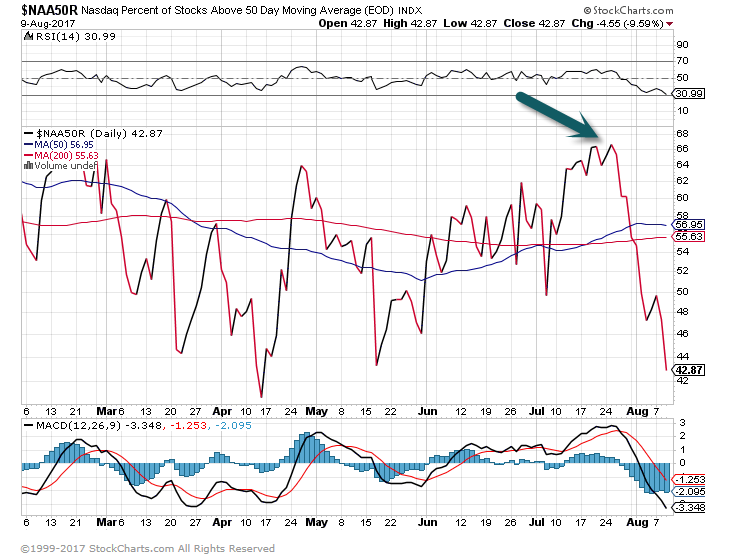
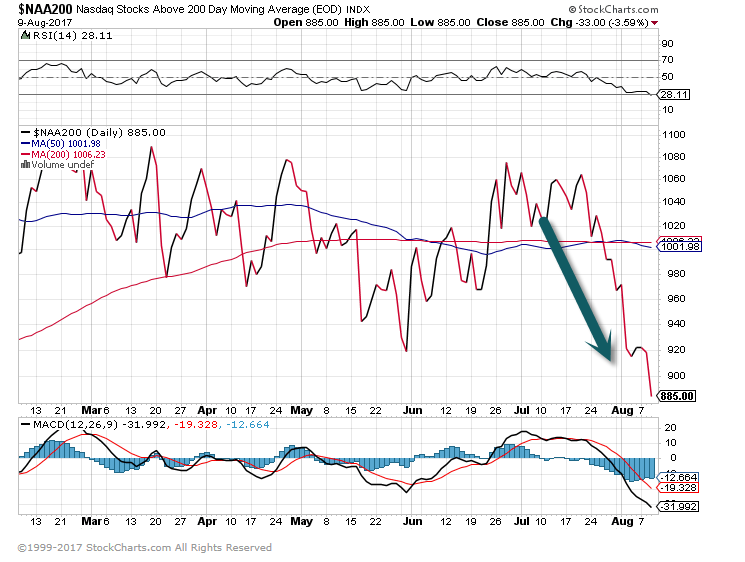

https://www.whartonhillia.com/viewpoints/2017/8/4/under-the-hood-august-2017


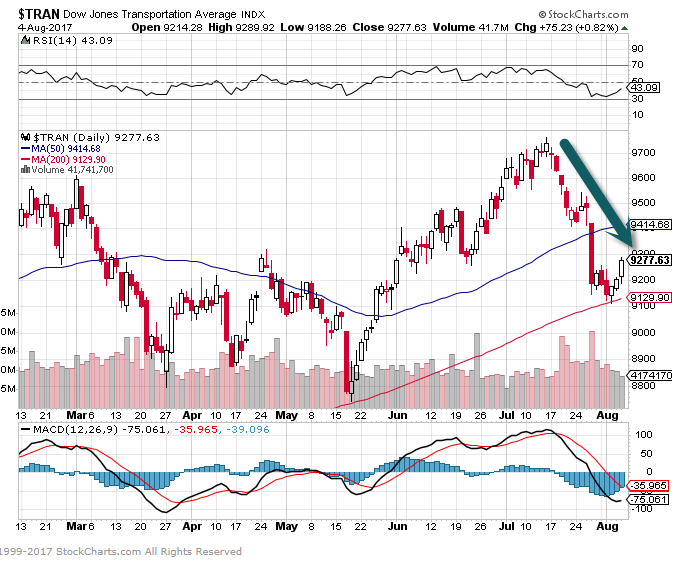
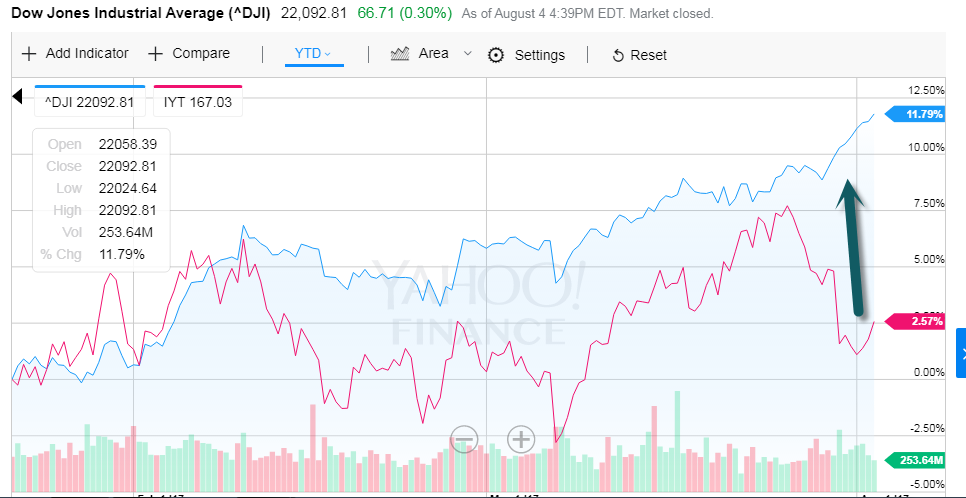
Aug 3, 2017
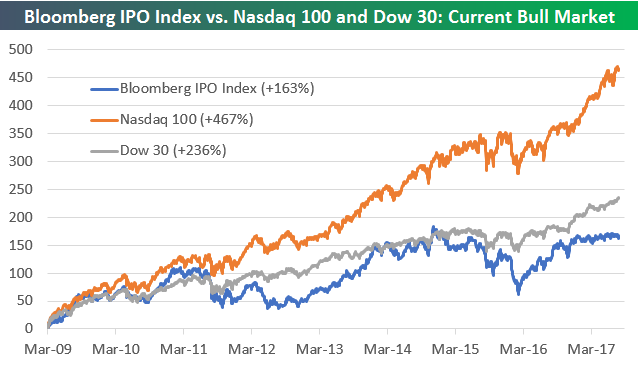
One index that hasn’t been participating in the market’s rally this year is the Bloomberg IPO Index, which is made up of companies that have IPOd within the past year. We just wanted to show you a quick chart to highlight the weakness for IPO stock performance.
Below is a chart comparing the performance of the Bloomberg IPO Index to the Nasdaq 100 and the Dow Jones Industrial Average since the bull market began back in March 2009. As shown, the Tech-heavy Nasdaq 100 is up by far the most at +467%, which might make you assume that IPOs would also be doing pretty well. But even the Dow 30 has outperformed the IPO Index and by quite a bit at that! Since the bull market began, the Dow is up 236% on a simple price return basis, while the IPO index brings up the rear in this group with a gain of just 163%. Over the past year, the IPO index has basically traded completely sideways.
https://www.bespokepremium.com/think-big-blog/bloomberg-ipo-index-remains-sluggish/
First the important stuff…Who the Hell is Dead and Who is Alive in Thrones?
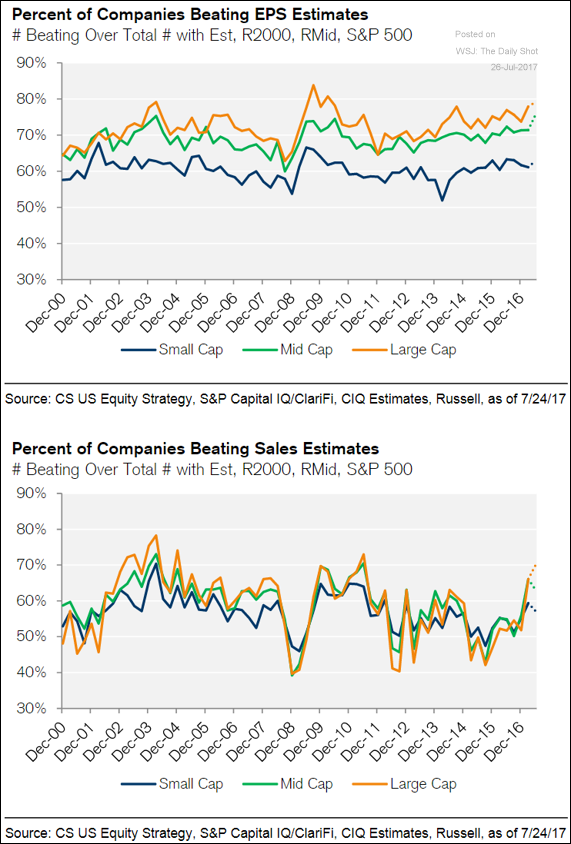
Equity Markets: The charts below show the percentage of companies beating earnings and sales estimates, broken out by company size.
Source: Credit Suisse
Tech sector stocks: Growth at a reasonable price
The tech sector posted double-digit earnings growth in the last two quarters, and it boasts the highest percentage of firms exceeding earnings expectations in the past four quarters among the 11 Global Industry Classification Standard (GICS) sectors.2
Such strong earnings growth momentum is expected to continue through 2017, evidenced by the rising earnings estimates shown in the chart below. The global economic environment is driving the sector’s growth prospects, as some of the headwinds the sector faced last year have turned into tailwinds. Since the tech sector has more foreign sales exposure than other sectors, it is more likely to benefit from the weaker US dollar and improving global growth we have seen this year.3
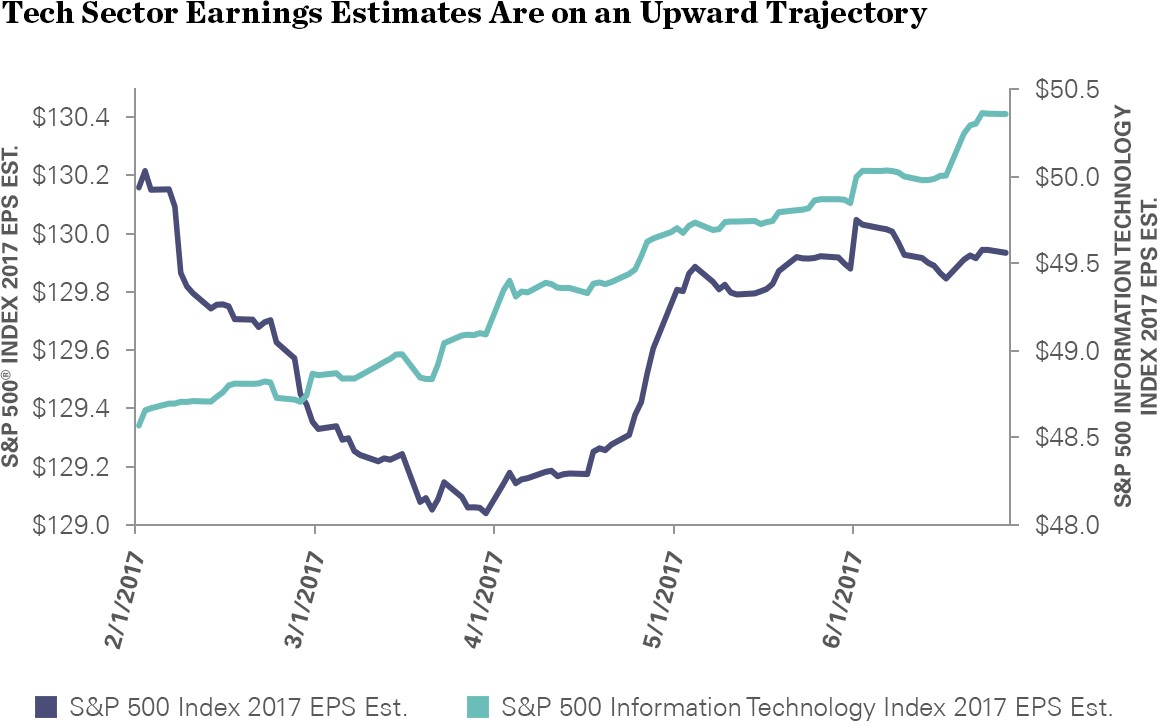
Source: Bloomberg Finance L.P., as of 6/27/2017. EPS estimates are based on consensus analyst estimates compiled by FactSet.
Equity Markets: Based on seasonal patterns, this is the time of the summer when the S&P 500 should peak.
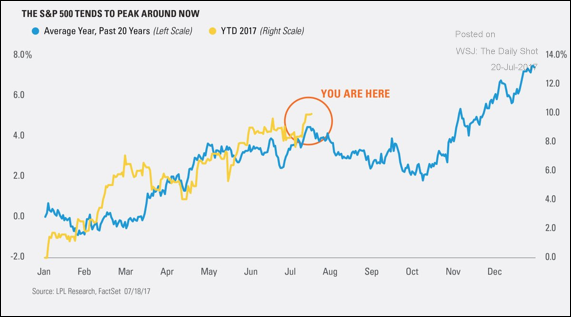 Source: @RyanDetrick; Read full article
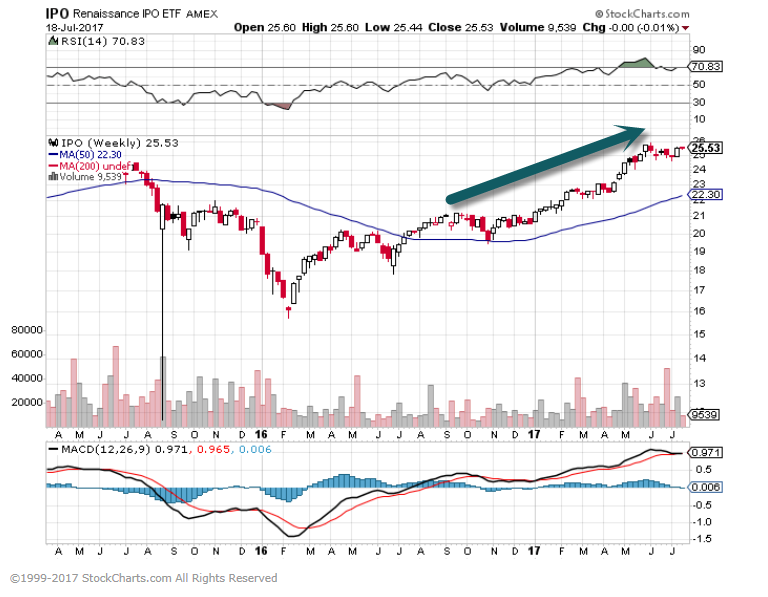
 IPOs Outperforming Market in 2017
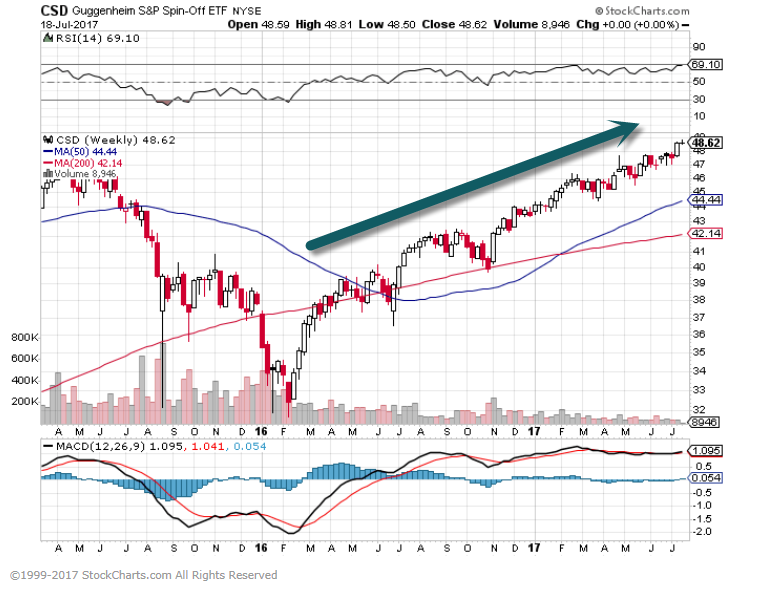
 Spin-Offs New Highs.

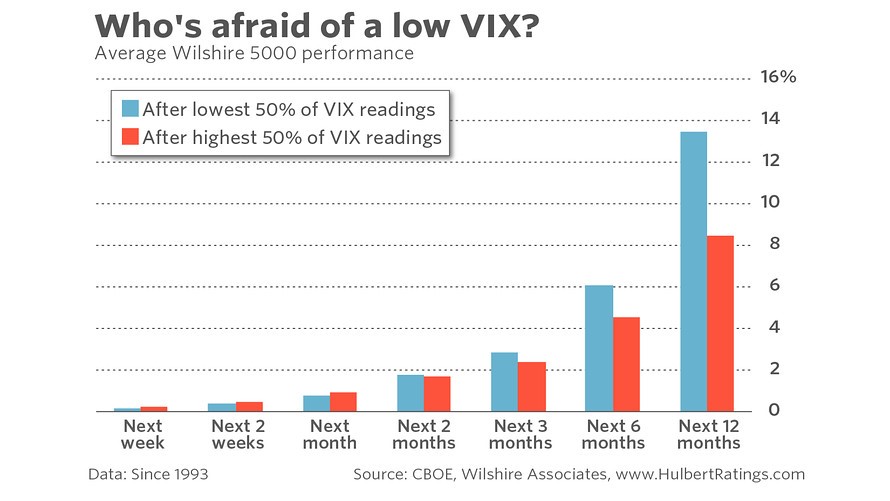
This happy result is not an accident. Over the last three decades, the way to have made money from the VIX was to interpret it opposite to how a contrarian would—to be a contrarian’s contrarian, if you will. That at least is the conclusion of an academic study that is forthcoming in the prestigious Journal of Finance and written by two Yale finance professors, Alan Moreira and Tyler Muir. If the future is like the past, they convincingly show, you can safely invest in equities so long as the VIX remains low. You would reduce your equity exposure only when volatility spikes.
Mark Hulbert.
Read full story
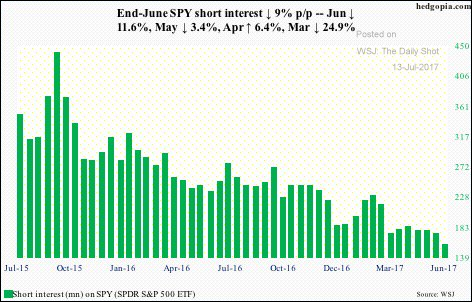
Source: @hedgopia, @jessefelder
www.thedailyshot.com
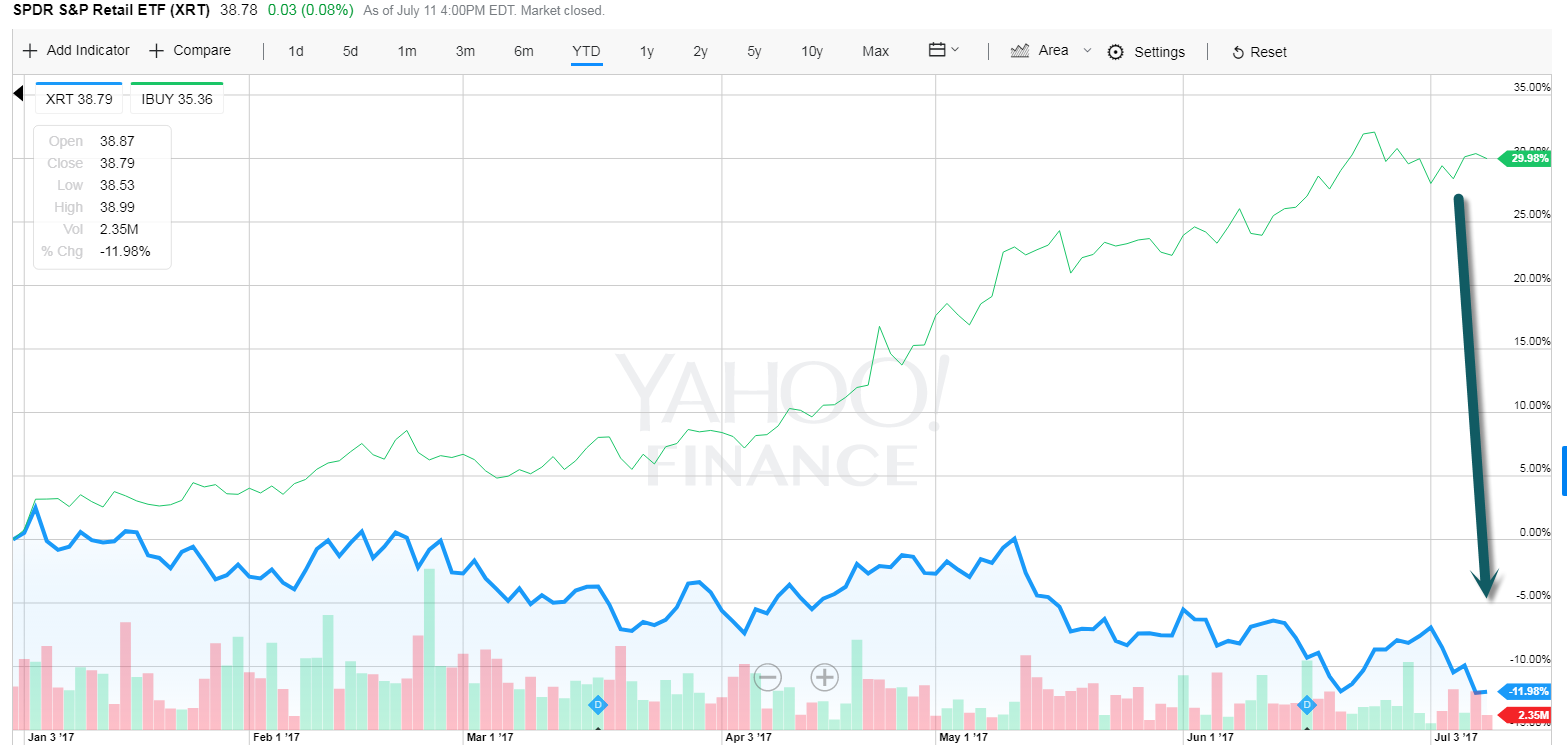
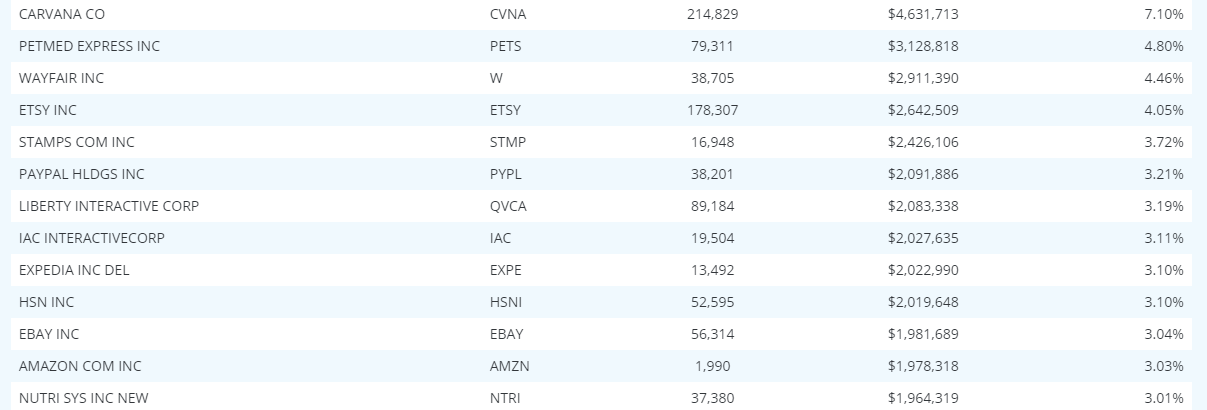
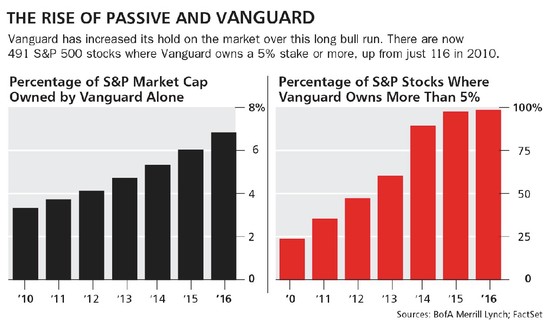 Read Full Barrons Story on the Rise of Indexing.
http://www.barrons.com/articles/man-vs-machine-how-has-indexing-changed-the-market-1499491233?mod=BOL_twm_ls&tesla=y
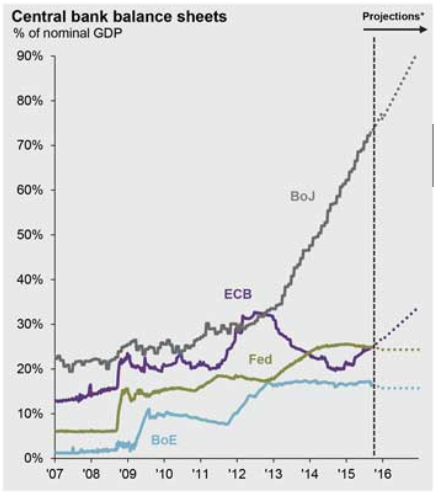
http://globaleconomicanalysis.blogspot.com/2015/10/central-bank-balance-sheets-what-will.html
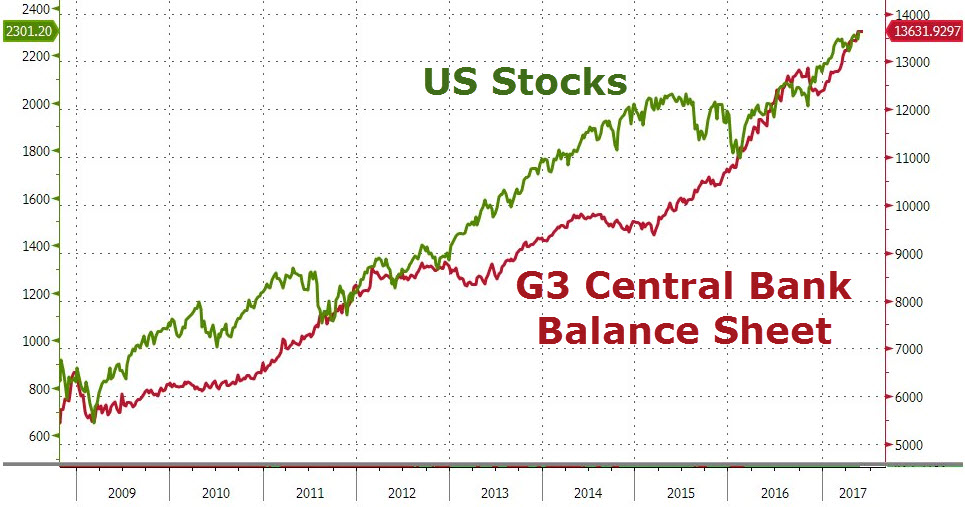

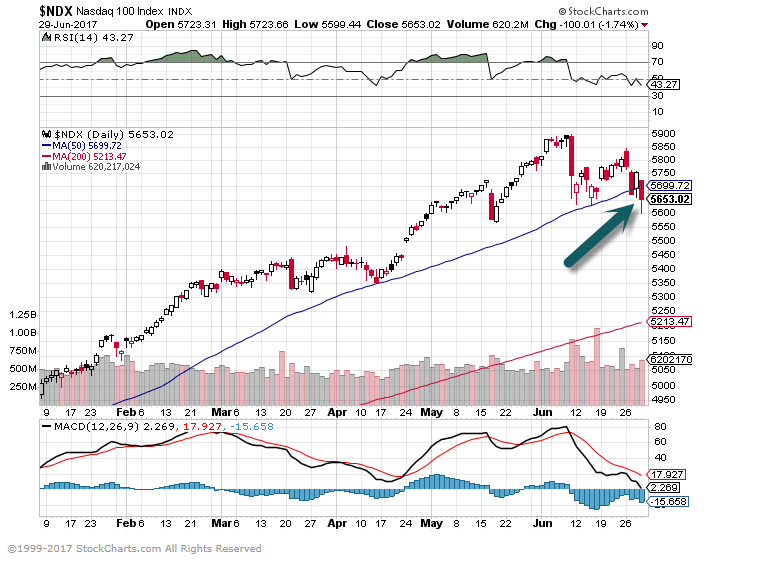
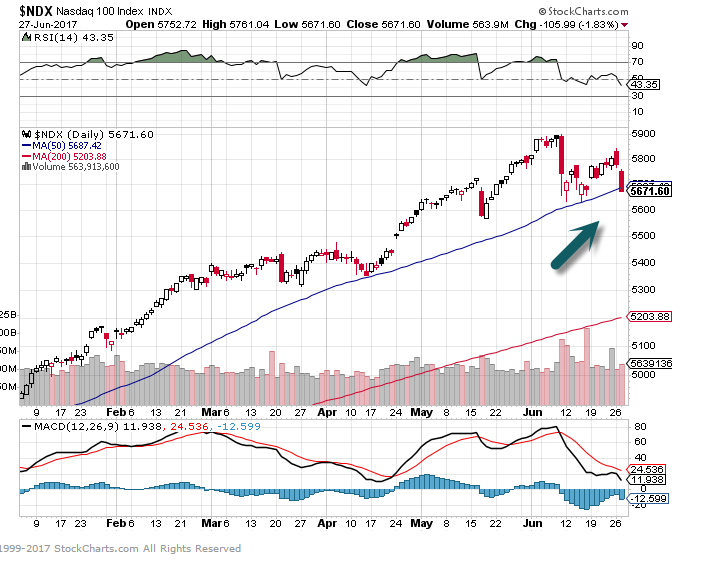
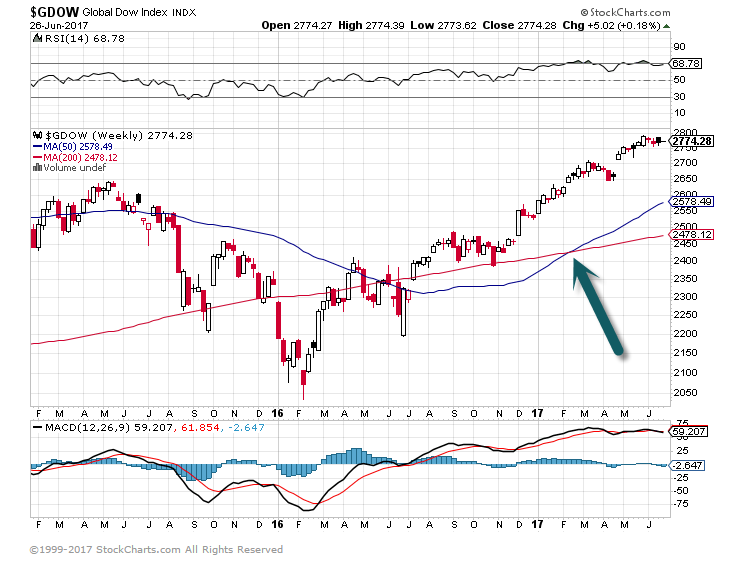
 NDX closes below 50day
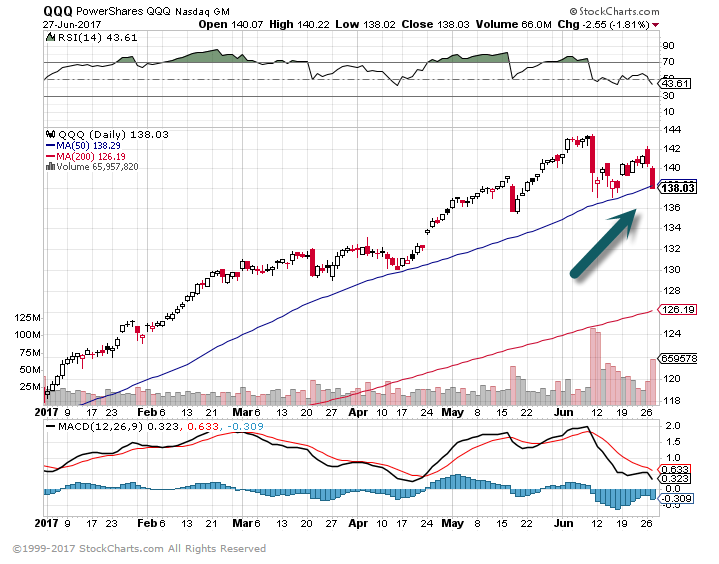

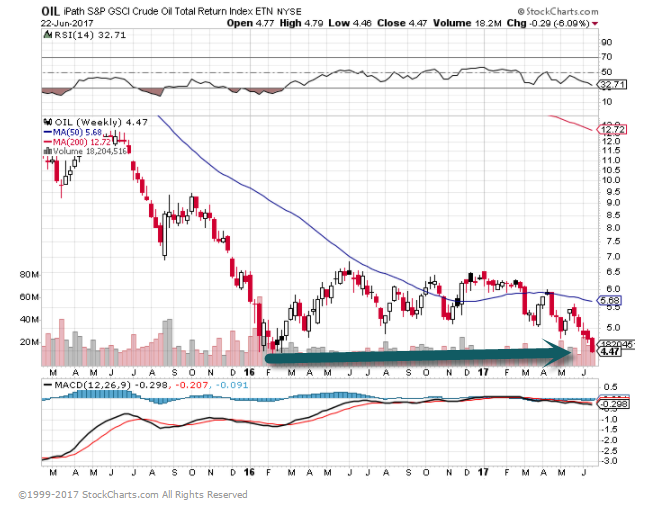
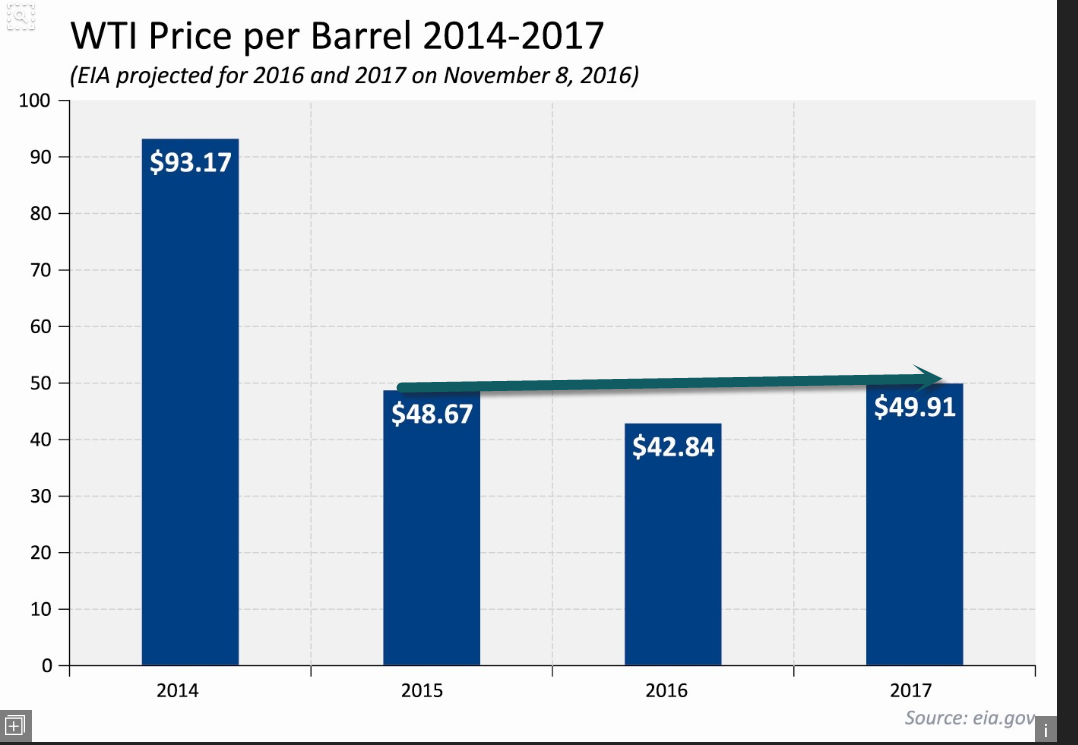
So far this year, oil has lost 20 percent in value, its weakest performance for the first six months of the year since 1997.
Compliance with an agreement by the Organization of the Petroleum Exporting Countries and other producers to cut output by 1.8 million barrels per day from January reached its highest in May since the curbs were agreed last year.
Yet global inventories of both crude and refined products remain well above their long-term averages.
When market gains are being driven by a few stocks, it means the market’s breadth—the number of stocks moving higher in tandem—is narrowing. This not only indicates that a rally may be somewhat unsustainable, but it may also indicate a challenging time for active managers. When only a few securities lead the charge, it limits the power of individual stock pickers.
As shown above, the market keeps setting new highs while the number of stocks surging ahead (measured by the number of S&P 500 stocks trading above their 200-day moving average) is falling. This could signal rocky days ahead for a stock market looking to move higher
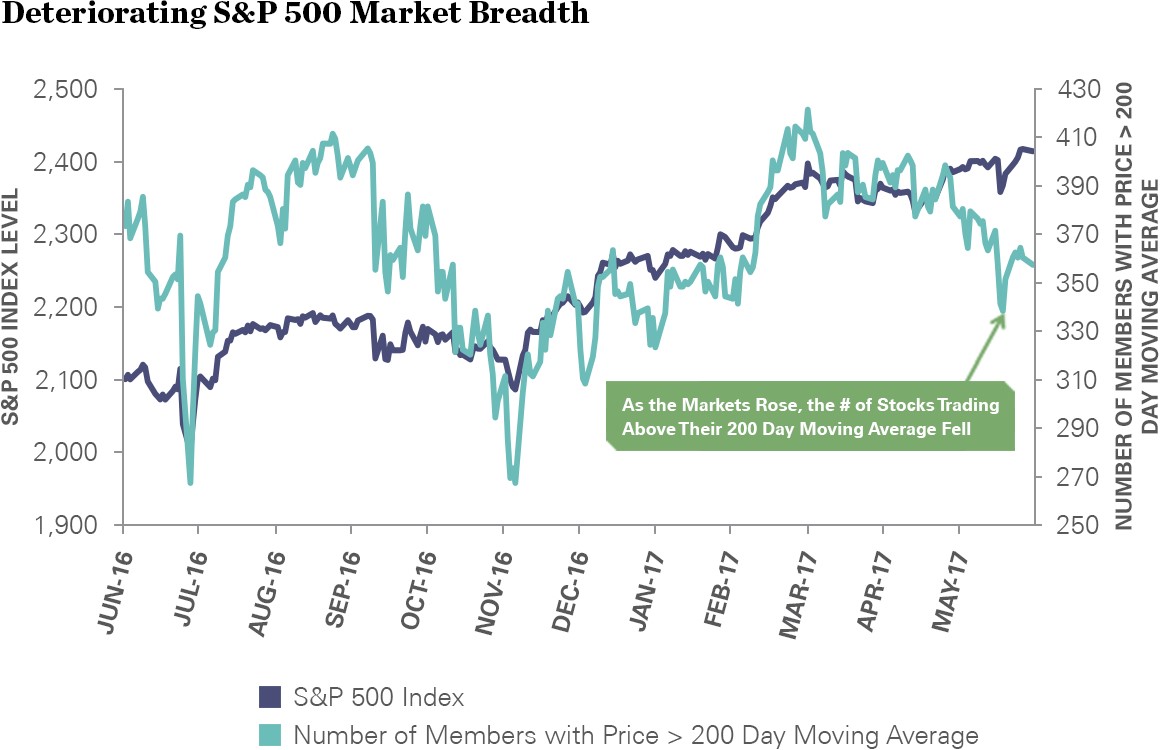
Source: Bloomberg Finance L.P., as of 5/31/2017.
Past performance is not a guarantee of future results. Index returns are unmanaged and do not reflect the deduction of any fees or expenses.
http://www.barrons.com/articles/rise-of-the-robot-stocks-1497675257
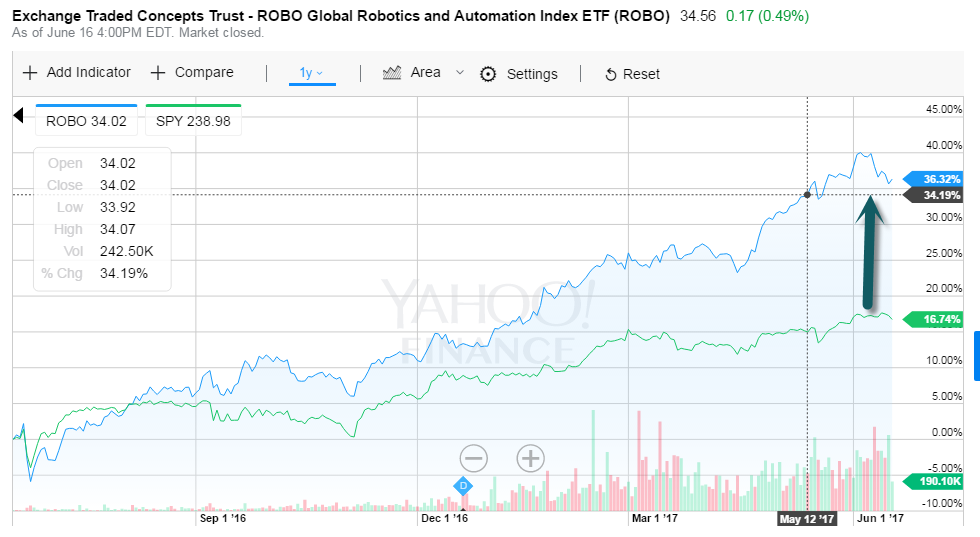

The SPDR Tech Select Sector ETF, which tracks tech companies in the S&P 500, saw a $560 million outflow on Friday, the biggest single-day removal since January 30, according to Bloomberg data. The trailing five-day outflow amounted to $737 million, which was the biggest weekly figure since the early 2016.
http://www.businessinsider.com/the-tech-stock-fairy-tale-is-heading-for-a-bad-ending-2017-6
 Continue reading

 Continue reading
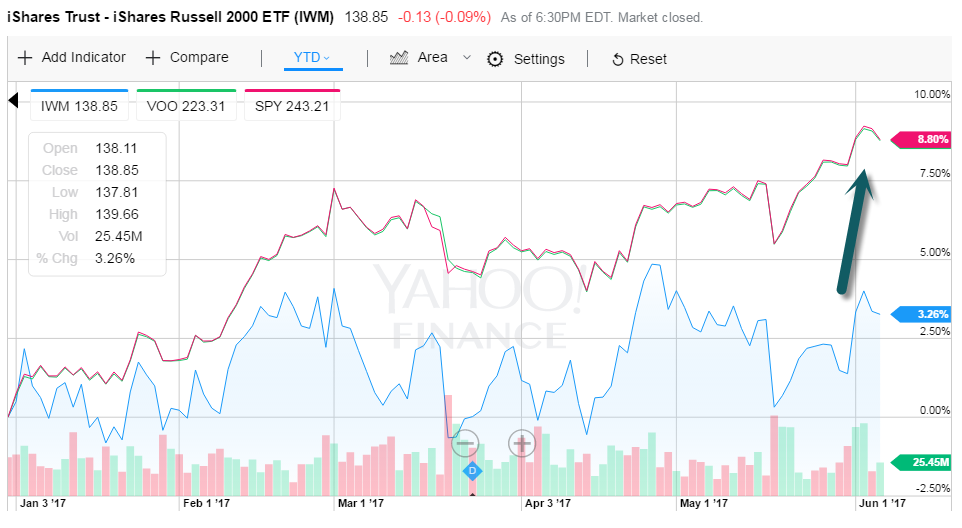
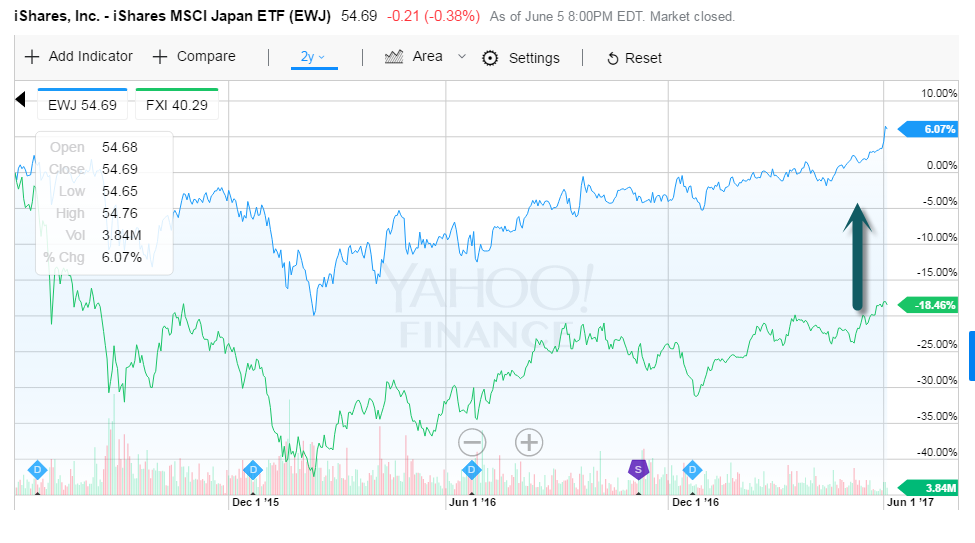
Since I started in finance almost 20 years ago, debt and demographics were going to implode Japan, now the two D’s are predicted to end China. Japan just broke out to 15 year highs, my crystal ball is a little cloudy as usual……

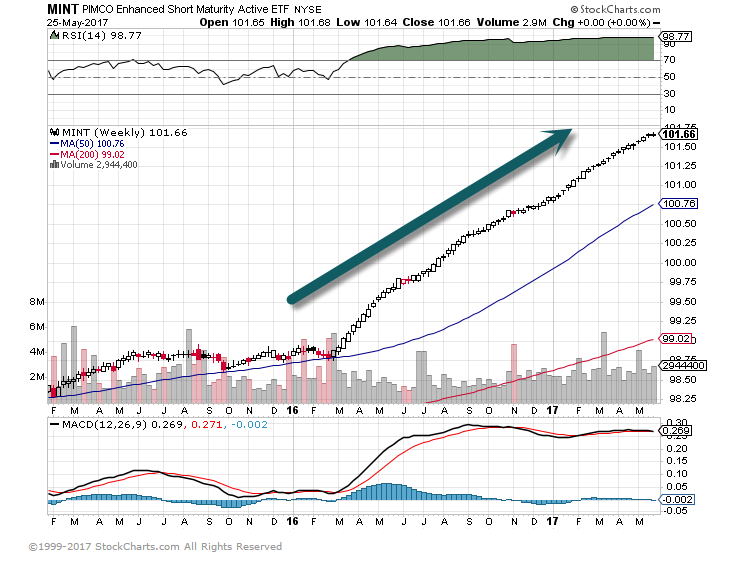
In recent months, this “use for cash” story has been playing out strongly in the ETF space, as retail and institutional investors pour assets into ultra-short-dated bond funds.
These ETFs are considered alternative cash management tools because they typically deliver higher income than money market mutual funds. They are also good risk management tools for investors worried about interest rate risk.
And they can even be a type of defensive play if you want to have cash at hand in the event of a market sell-off—these ETFs offer strong daily liquidity, as in quick access to that cash.
MINT Has Doubled In Size
The most popular of these strategies, the PIMCO Enhanced Short Maturity Active ETF (MINT), is almost twice as big today as it was a year ago, with almost $7 billion in total assets. It has seen tremendous growth.
So far this year, MINT has attracted more than $1.3 billion in net creations, making it the largest actively managed ETF.
Other ETFs in this segment benefiting from this demand include the iShares Short Maturity Bond ETF (NEAR), gathering some $255 million year-to-date, and growing to become a $2.5 billion fund—now the market’s third-largest actively managed ETF.
http://www.etf.com/sections/features-and-news/etf-investors-looking-park-cash
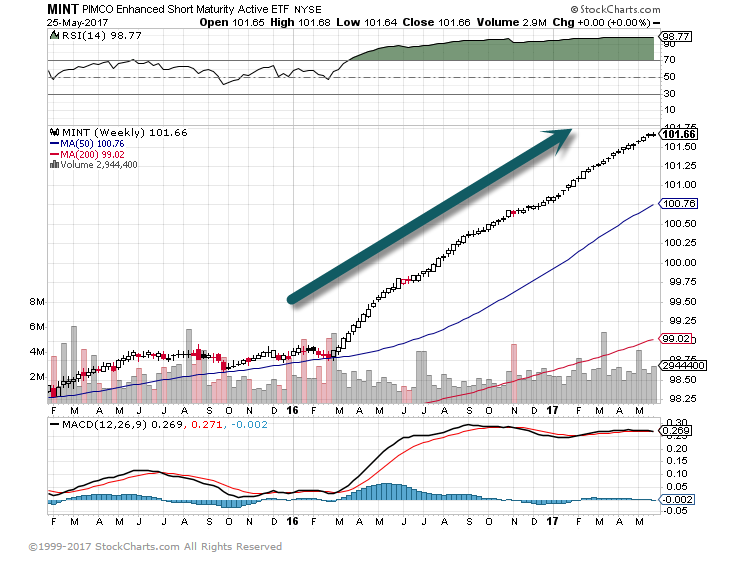
In recent months, this “use for cash” story has been playing out strongly in the ETF space, as retail and institutional investors pour assets into ultra-short-dated bond funds.
These ETFs are considered alternative cash management tools because they typically deliver higher income than money market mutual funds. They are also good risk management tools for investors worried about interest rate risk.
And they can even be a type of defensive play if you want to have cash at hand in the event of a market sell-off—these ETFs offer strong daily liquidity, as in quick access to that cash.
The most popular of these strategies, the PIMCO Enhanced Short Maturity Active ETF (MINT), is almost twice as big today as it was a year ago, with almost $7 billion in total assets. It has seen tremendous growth.
So far this year, MINT has attracted more than $1.3 billion in net creations, making it the largest actively managed ETF.
Other ETFs in this segment benefiting from this demand include the iShares Short Maturity Bond ETF (NEAR), gathering some $255 million year-to-date, and growing to become a $2.5 billion fund—now the market’s third-largest actively managed ETF.
http://www.etf.com/sections/features-and-news/etf-investors-looking-park-cash

www.yahoofinance.com

http://blog.spdrs.com/
For the first time since January 2009, sales of cars declined year-over-year in all three of the world’s largest auto markets of Western Europe (-6.8%), China (-1.8%) and the United States (-3.7%). Combined, these three markets account for roughly 70% of the world’s auto sales


www.zerohedge.com
From Dave Lutz at Jones
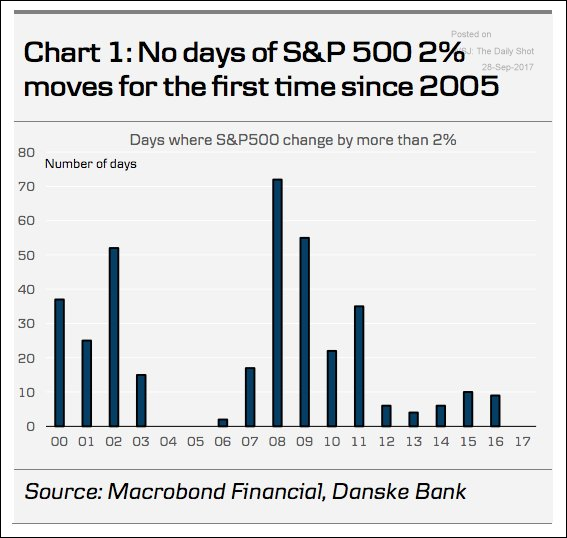
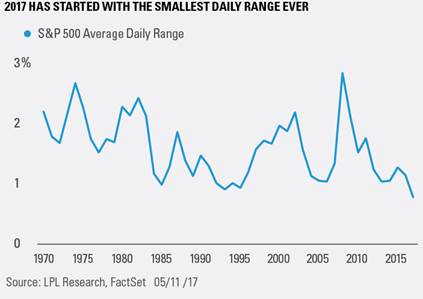
“The average daily range for the S&P 500 Index so far this year is 0.57%, which is the lowest range going back to 1970” says LPL

He attended Merrillville High School and graduated in 1970 from the United States Air Force Academy. He played basketball for four seasons at the Academy and in his senior year was the team captain and the leading scorer.[5] He graduated with a bachelor’s degree in Soviet Studies, and he underwent Air Force intelligence gathering and processing training.[6] At one point, Popovich considered a career with the Central Intelligence Agency.[7]
Popovich served five years of required active duty in the United States Air Force, during which he toured Eastern Europe and the Soviet Union with the U.S. Armed Forces Basketball Team. In 1972, he was selected as captain of the Armed Forces Team, which won the Amateur Athletic Union (AAU) championship. This earned him an invitation to the 1972 U.S. Olympic Basketball Team trials.
https://en.wikipedia.org/wiki/Gregg_Popovich
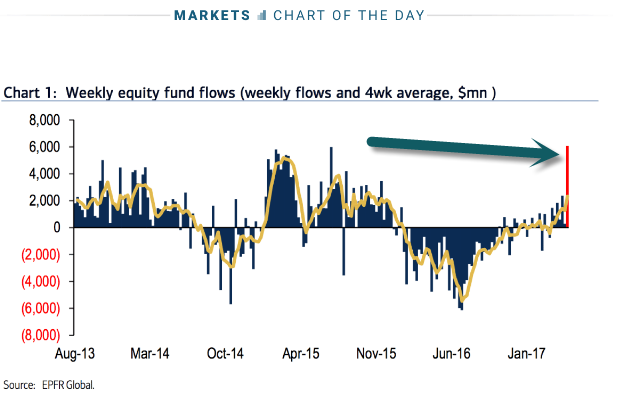
http://www.businessinsider.com/money-pouring-into-european-stocks-at-record-pace-2017-5
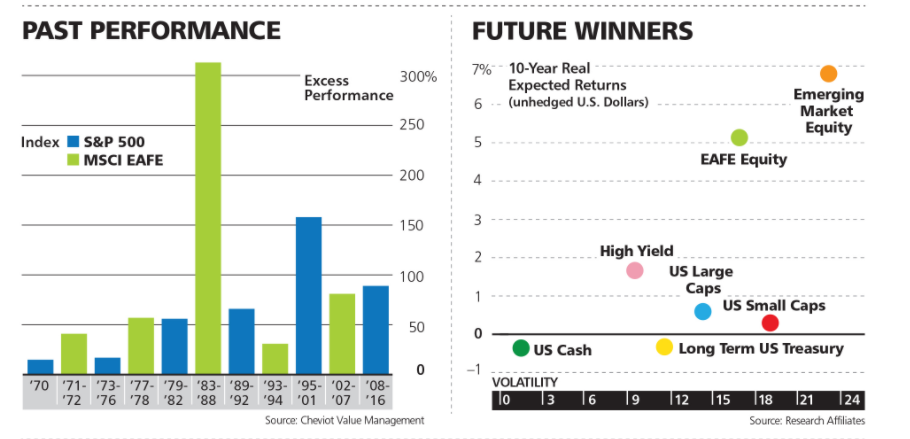
Industry analysts look for EAFE earnings to increase by 18% to 19% this year, compared with an estimated gain of 10% in U.S. profits. While this rise comes off a low base for overseas stocks, it’s the direction and momentum that count most for investors. “We are in a normalization period” in which EAFE earnings will catch up with the U.S., says Savita Subramanian, head of U.S. equity and quantitative strategy at Bank of America Merrill Lynch. Subramanian recommends underweighting the S&P 500 relative to other markets, and notes that positive earnings revisions have been more numerous lately in Europe and Japan than the U.S.
Sorry…Missed last couple days due to travel.
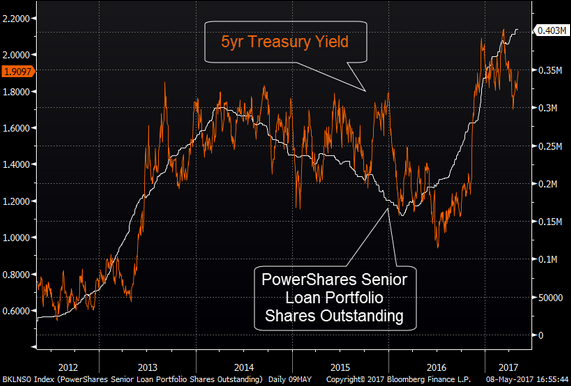
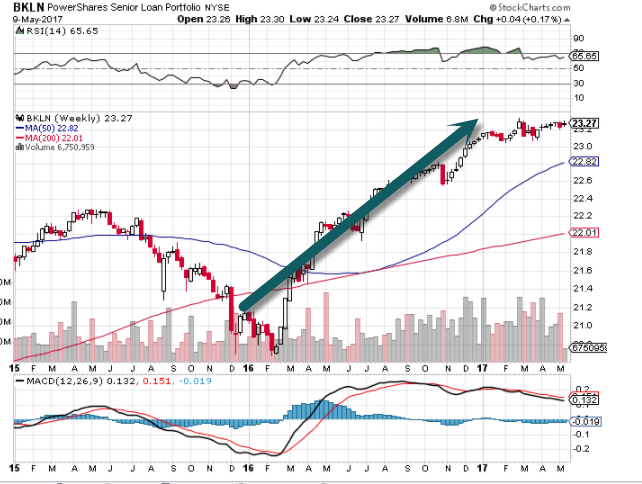
Bank Loan ETF…Fixed Income Allocators Rushing to Plays on Rising Rates.
Larry Swedroe Weighs In…
The table below shows three value metrics—price-to-earnings (P/E), price-to-book value (P/B) and price-to-cash flow (P/CF)—for two of the market’s most popular dividend strategies: the SPDR S&P Dividend ETF (SDY), with more than $14 billion in assets under management (AUM), and the Vanguard Dividend Appreciation ETF (VIG), with more than $22 billion in AUM. Data is as of July 13, 2016. VIG buys the stocks of companies with rapid growth in their dividends.
The table also shows the two large-cap value ETFs with the most AUM, the iShares Russell 1000 Value ETF (IWD) and the Vanguard Value ETF (VTV). Finally, I’ll compare the value metrics of these funds with that of the SPDR S&P 500 ETF (SPY). As you review the data, remember that the lower the price metric, the higher the expected return. Data is from Morningstar.
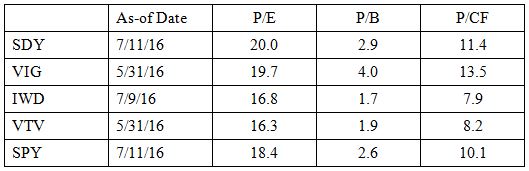
The above data makes clear that the popularity of the two dividend strategies (SDY and VIG) has led to a rise in the prices of these stocks and reduced their expected returns. No matter which value metric we look at, the expected returns for both SDY and VIG are now well below the expected returns of the two large value strategies, and also below that of the S&P 500 ETF. It’s an example of the curse of popularity, and what happens when a trade gets “crowded.” Forewarned is forearmed.
Larry Swedroe on Dividends
http://www.etf.com/sections/index-investor-corner/swedroe-irrelevance-dividends?nopaging=1
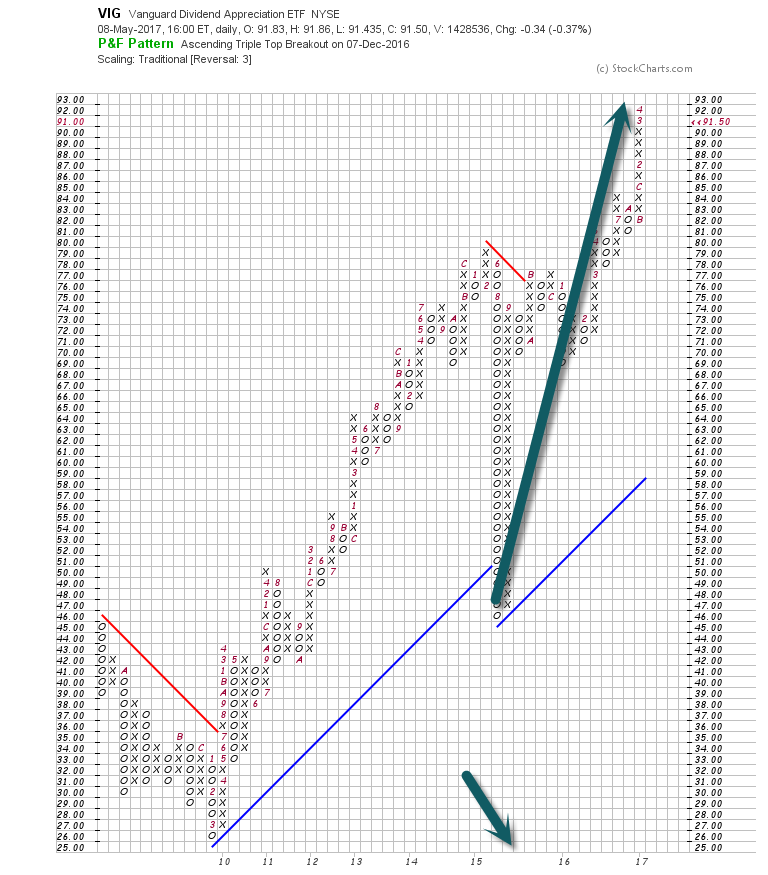
www.stockcharts.com
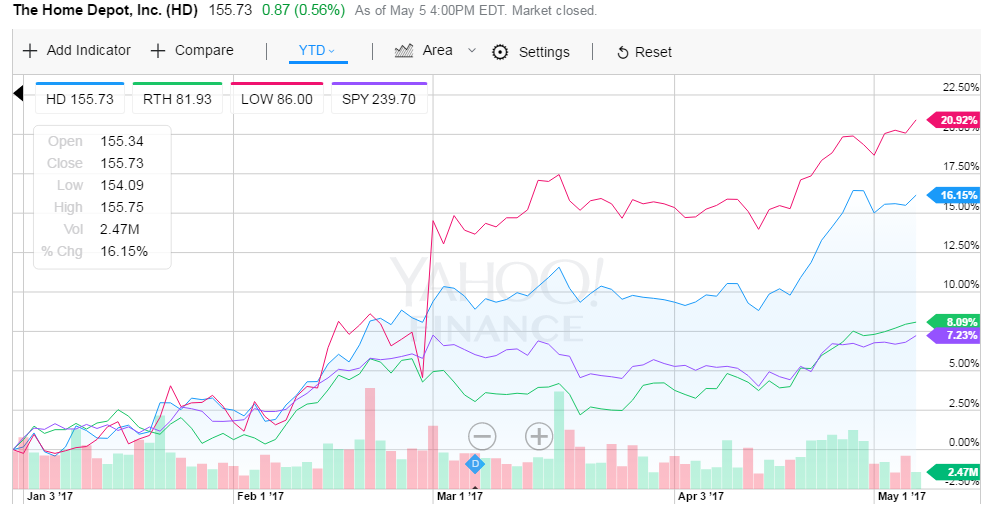
www.yahoofinance.com
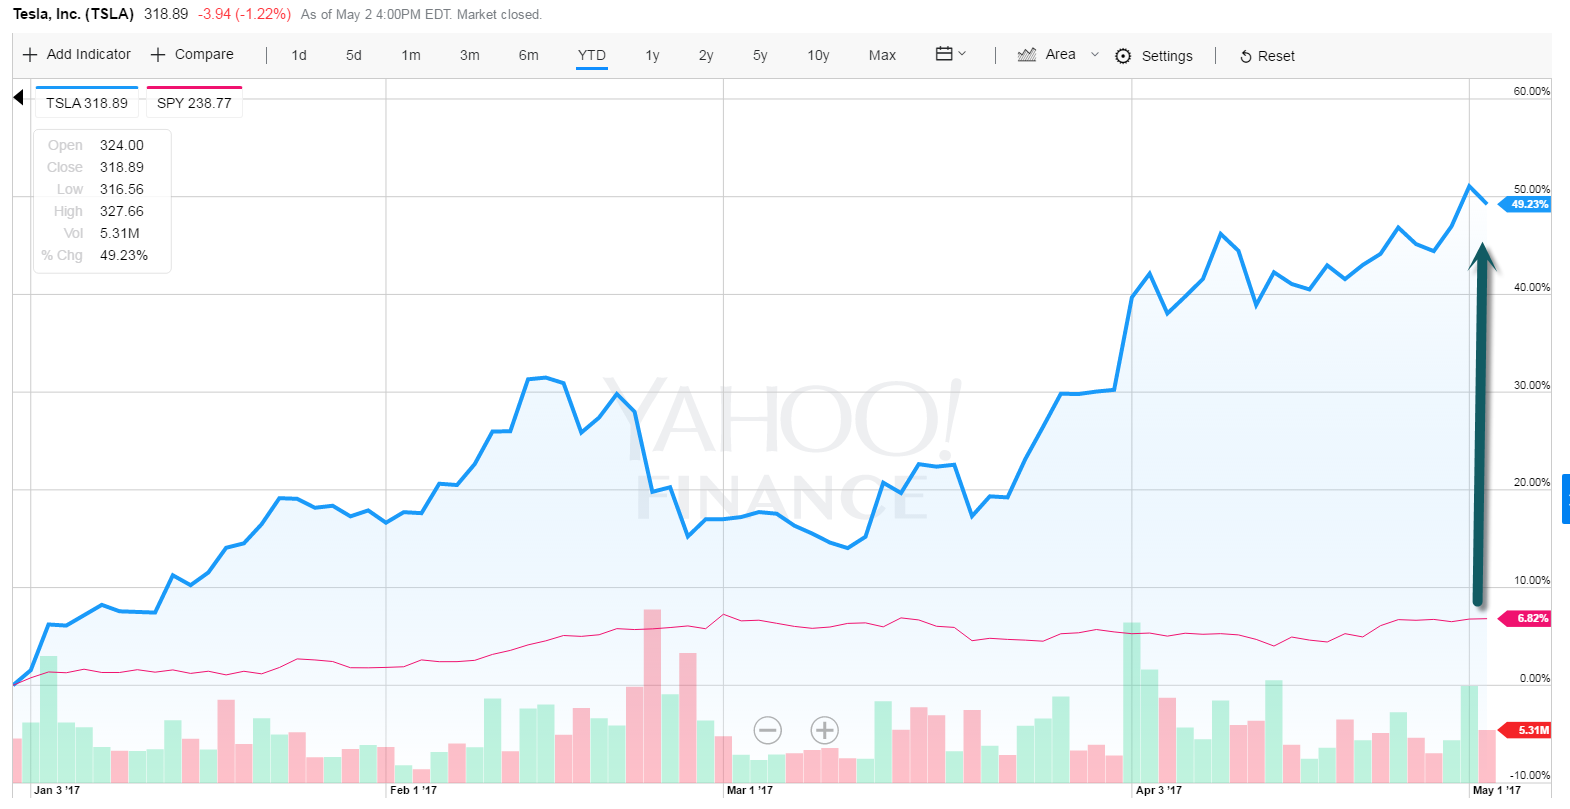
Traders short selling Tesla’s (TSLA.O) soaring stock have lost $3.7 billion this year, eclipsing the combined losses of traders shorting Apple (AAPL.O), Amazon.com (AMZN.O) and Netflix (NFLX.O)

www.yahoofinance.com
http://www.reuters.com/article/us-tesla-stocks-idUSKBN17Y29O
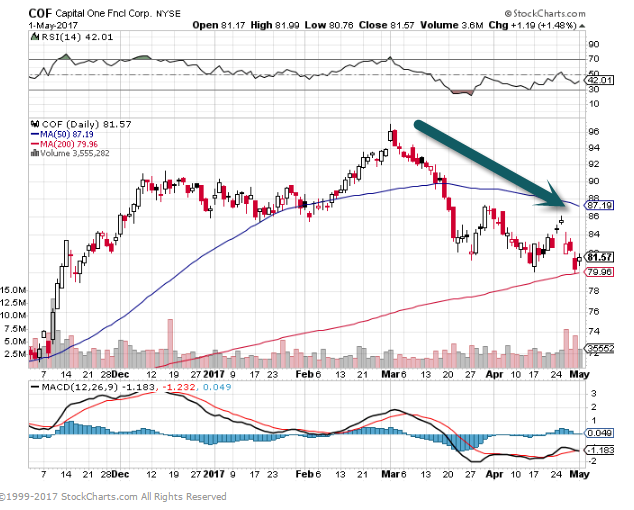
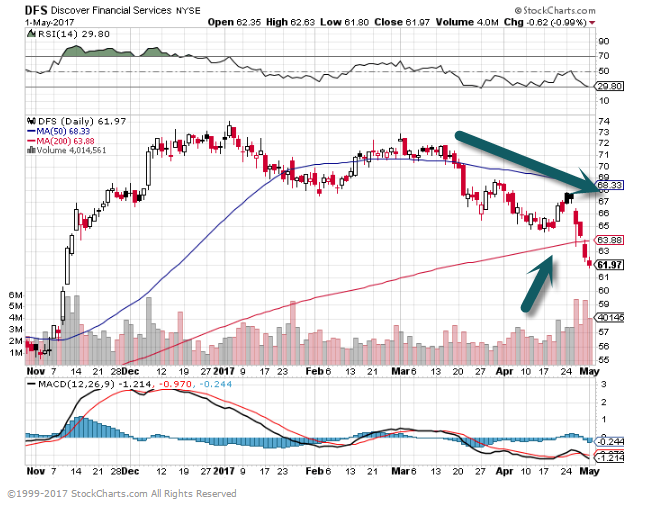
Synchrony, Capital One, and Discover – a gauge of how well over-indebted consumers are managing to hang on – have together increased their Q1 provisions for bad loans by 36% year-over-year.
Wolf Street Read on Bad Debt at BI
http://www.businessinsider.com/us-consumer-debt-is-piling-up-2017-5
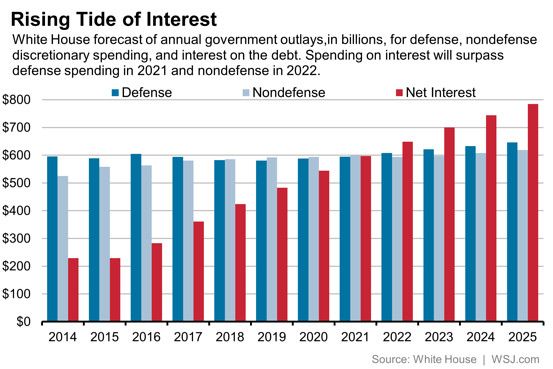
We have actually been blessed by this decline in interest rates in the United States. In 2000, the total interest cost of servicing the federal debt was $360 billion, based on a blended interest rate on government bonds of 6%. Today, the blended interest rate is 2.1% and the total interest cost is $400 billion, only $40 billion more on a debt burden three times the size of its 2000 level. If interest rates on government securities rise 1%, the cost of debt service would increase almost $200 billion, offsetting most of the budget cuts being proposed by the Trump administration
Byron Wien Full Read Below
http://www.barrons.com/articles/byron-wien-the-scary-signal-of-the-bond-market-1493417352
 “A Bronx Tale” is on all week so I can’t help but watch some before bed each night. Who knew Sonny had such great advice for Wall Street?
Josh Brown-The Reformed Broker.
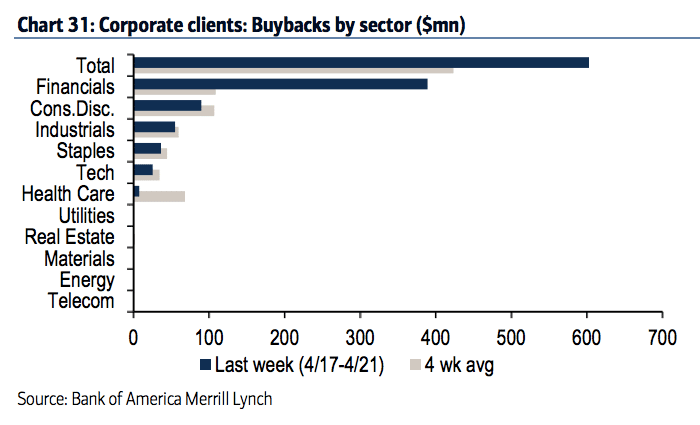
The truth is, however, that buybacks may have peaked for the cycle a year or two ago. Which, if you’re blaming monetary policy for their prevalence, would make sense. The Fed’s tapering off of monthly QE began in 2014, and the Fed Funds hikes began in December of 2015. We’ve been in a tightening environment – in both word and deed – for three years now.
Bank of America looks at its corporate clients’ buyback activity and finds quite a drop-off year-to-date:
Buybacks by our corporate clients picked up last week to typical April levels, but year-to-date are tracking their lowest of any comparable period since 2013 and are down nearly 30% YoY—suggesting less of a boost to corporate EPS from buybacks.

“Put him in the bathroom” A Bronx Tale

www.stockcharts.com
Continue reading
 www.yahoofinance.com
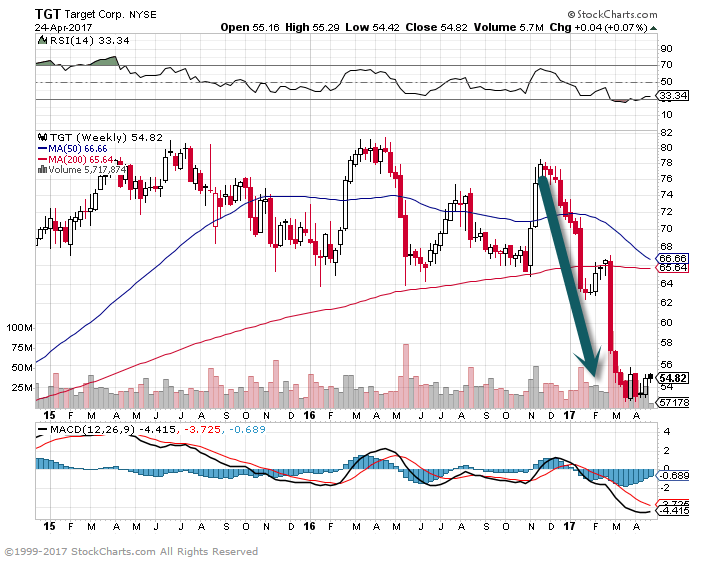
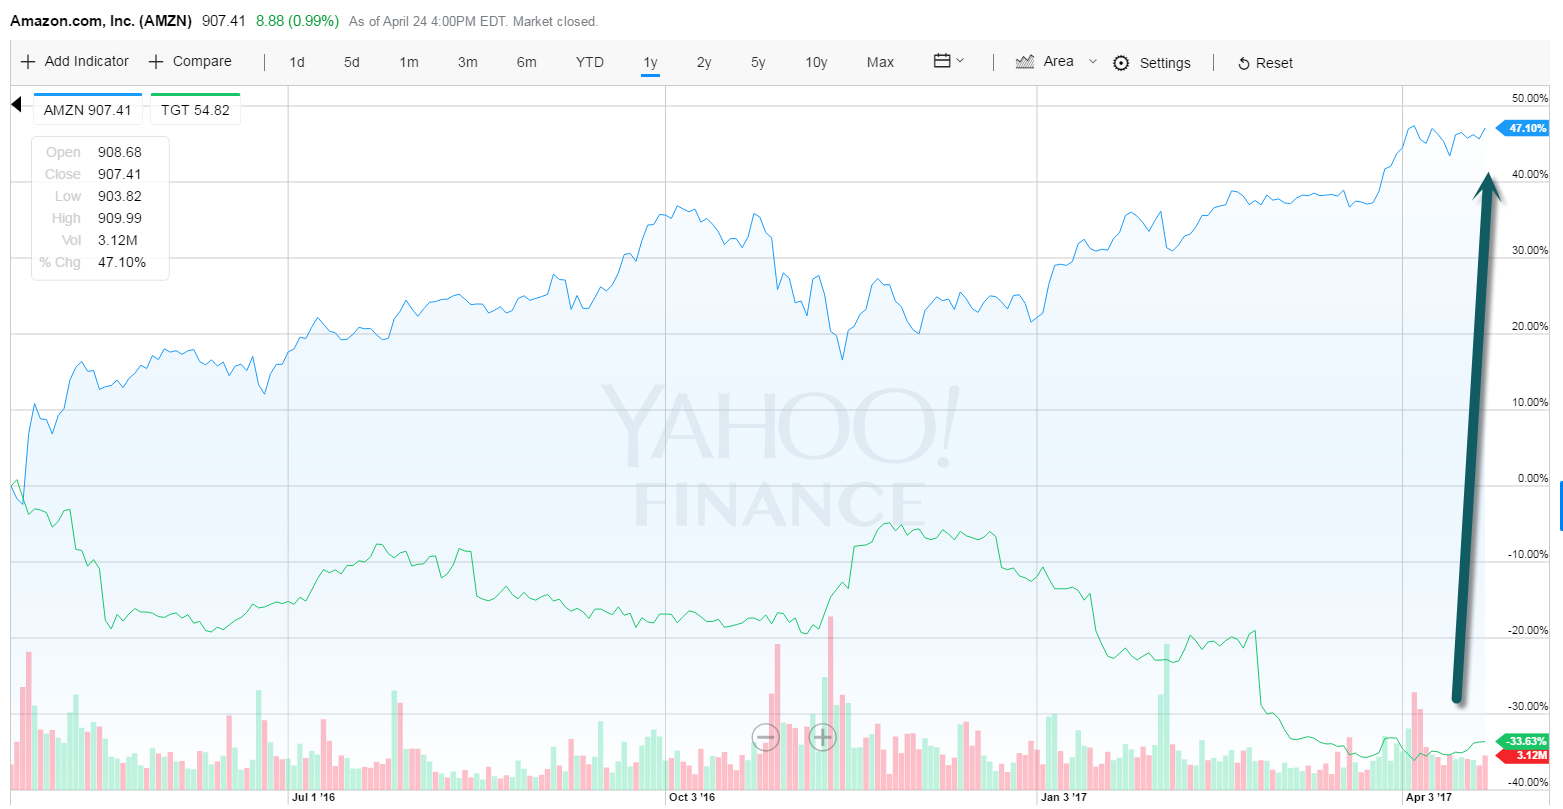

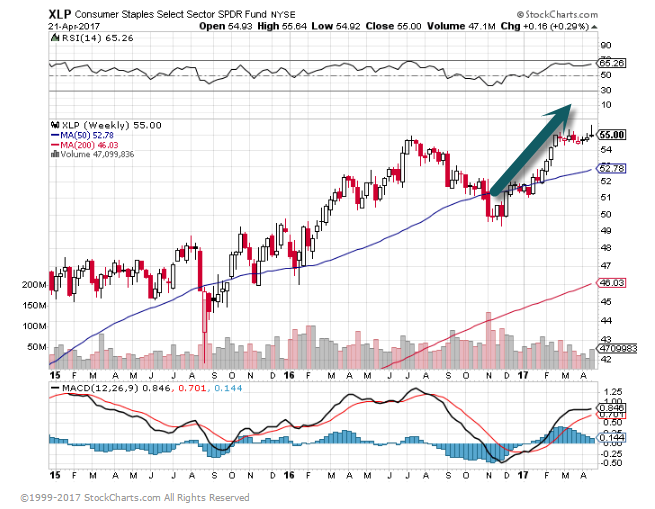
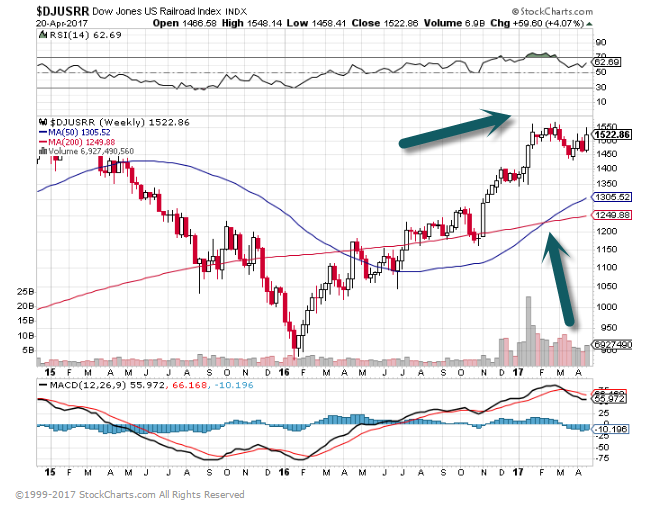
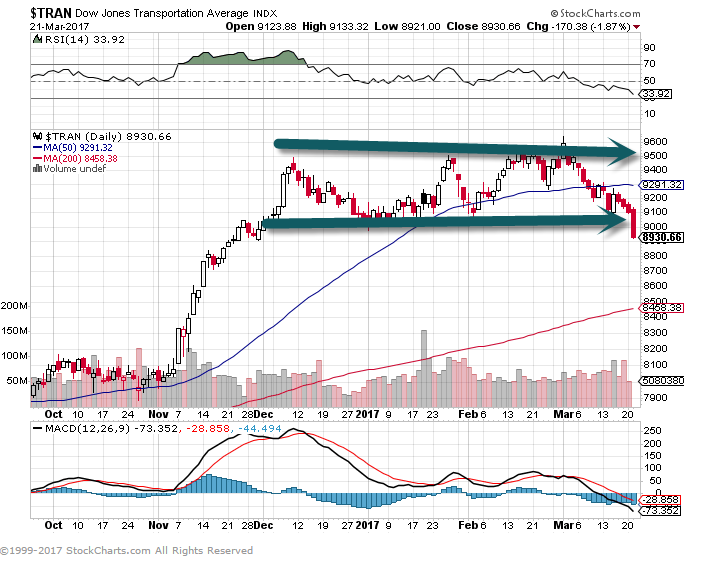
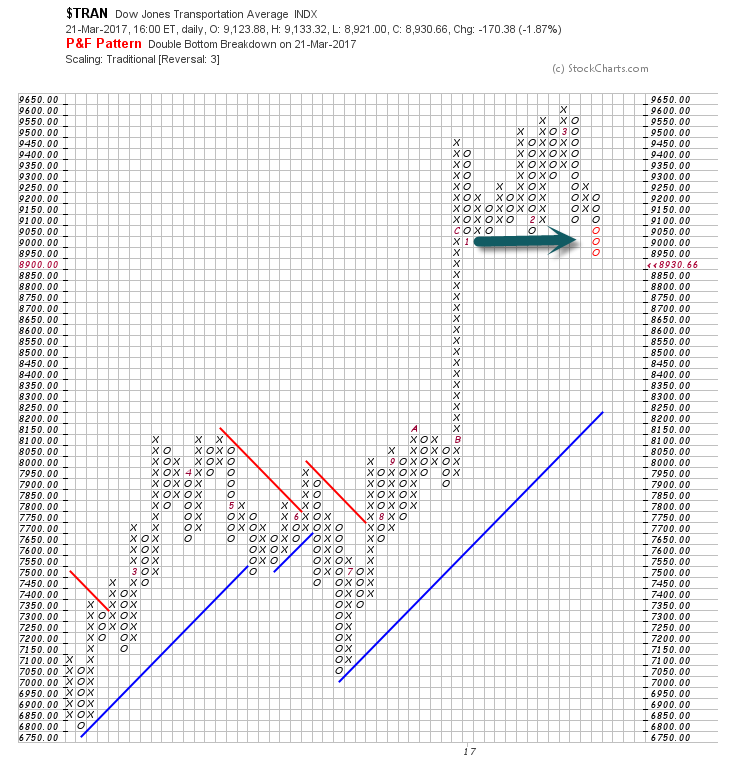
Dow Jones Railroad Index 60% Rally off 2016 lows…50 day thru 200 day to upside on big volume. Not Recession like chart???
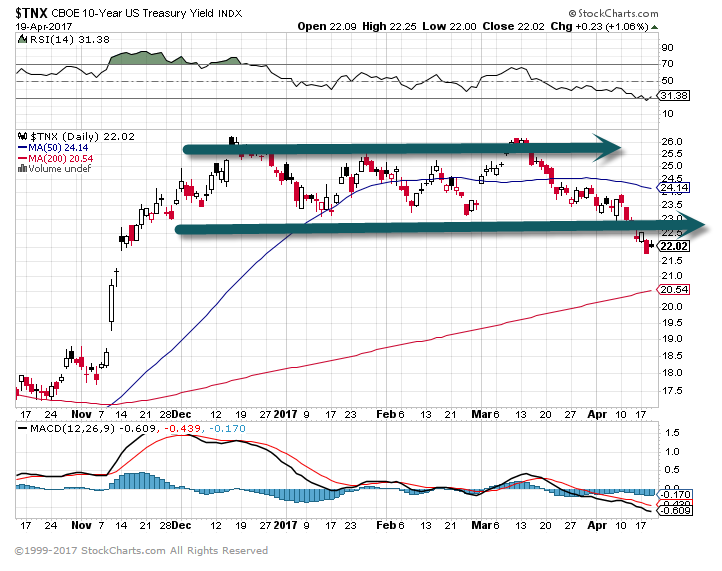
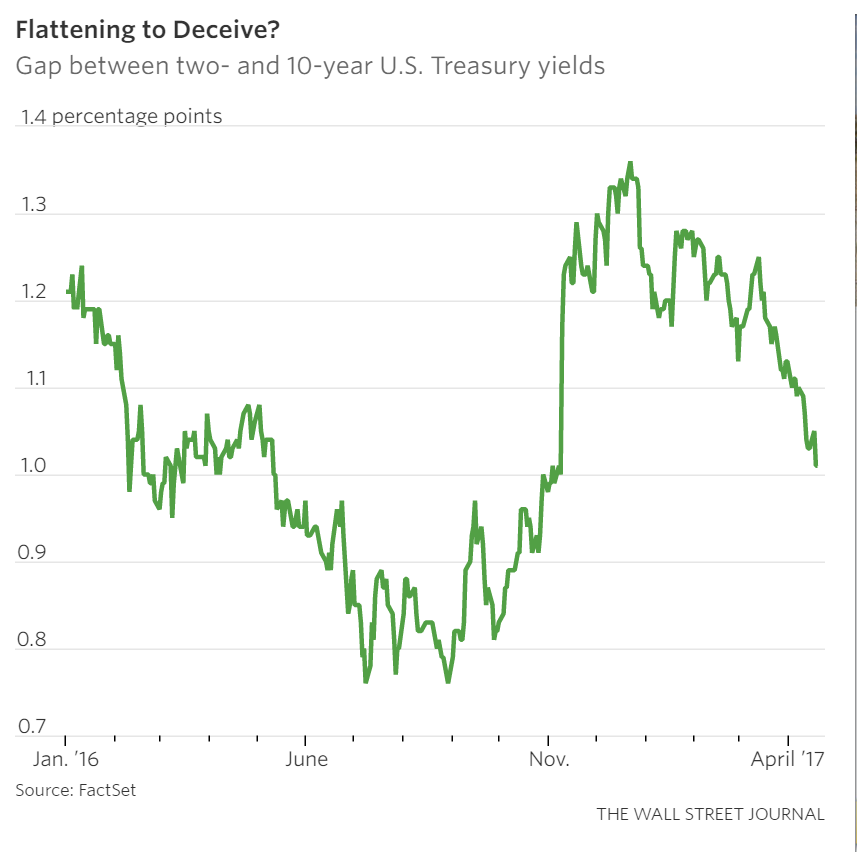 https://www.wsj.com/articles/bond-markets-send-jitters-but-is-anyone-listening-1492606188?tesla=y
Ford has the fifth-lowest price/earnings ratio in the S&P 500. The absolute lowest belongs to rival General Motors, which at $34, trades for under six times projected 2017 earnings. Barron’s has written favorably on GM, including in an article earlier this year (“GM Shares Could Drive 35% Higher,” Feb. 18), when GM traded around $37.
http://www.barrons.com/articles/ford-shares-are-too-cheap-1492229293
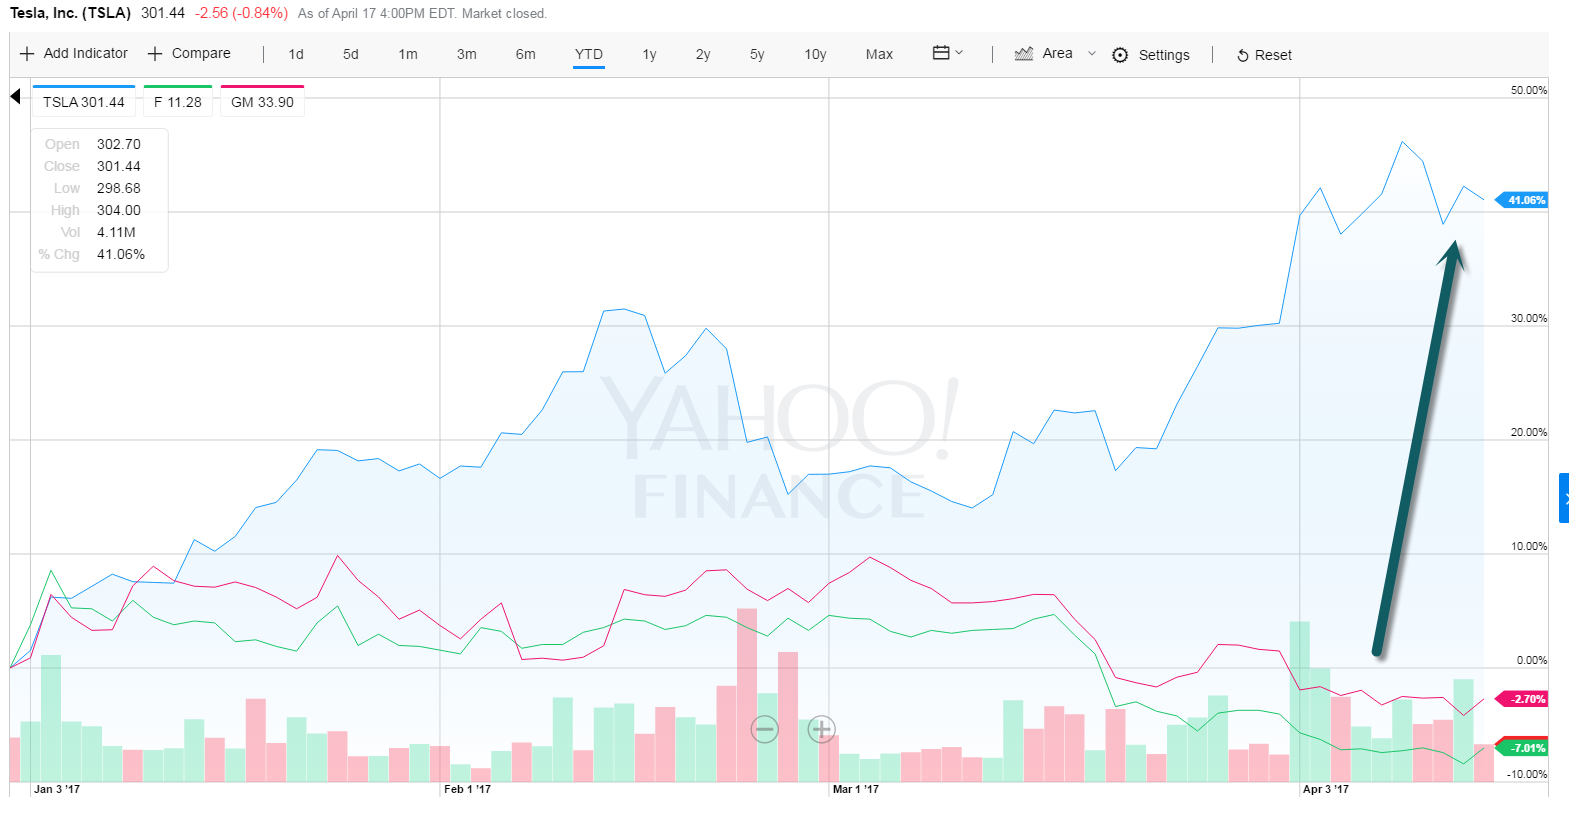
www.yahoofinance.com
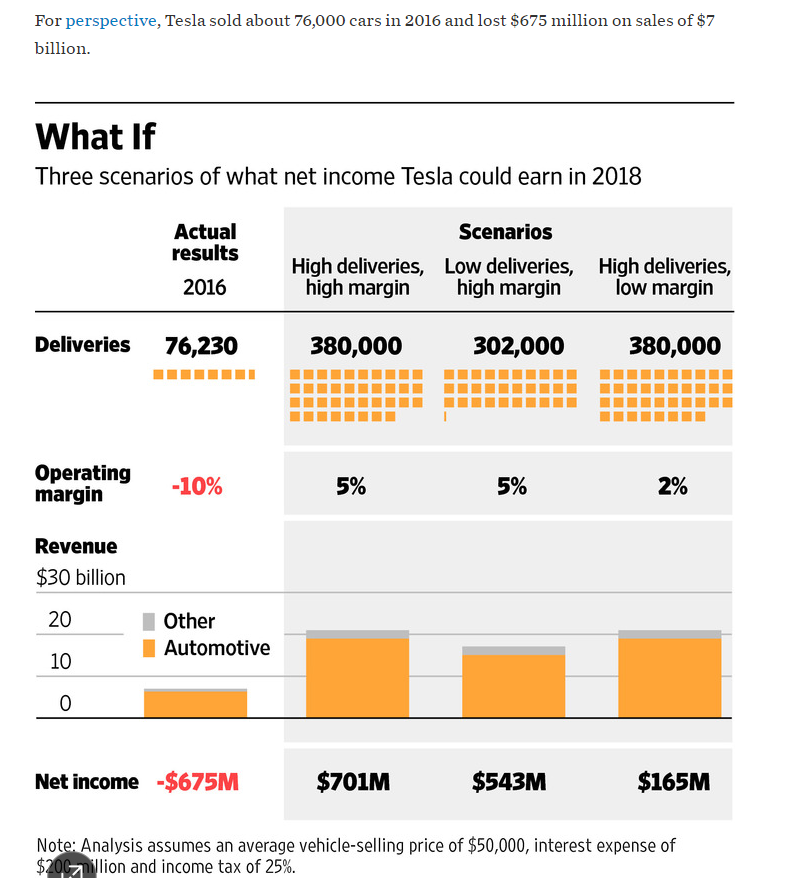
Read Full Story at WSJ
https://www.wsj.com/articles/what-is-tesla-really-worth-1492365561?tesla=y
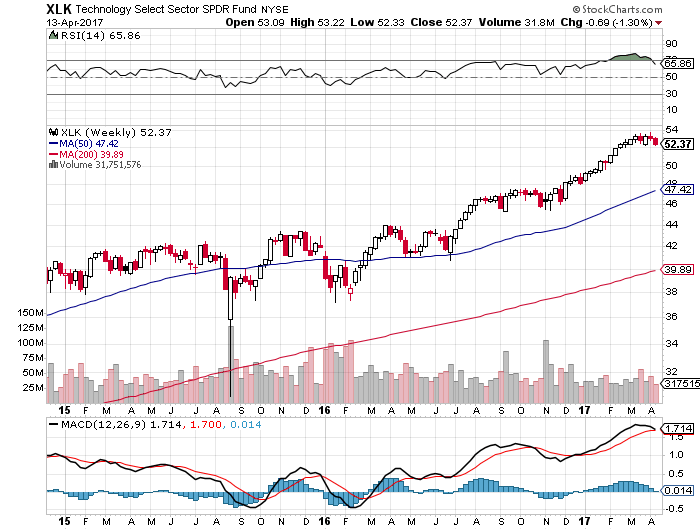
The Standard & Poor’s 500 Information Technology Index has finished lower 10 days in a row, only the fourth such streak since 1989, when daily data on the sector was first posted, according to Bespoke Investment Group.
 Barrons
http://www.barrons.com/articles/stocks-slip-1-on-week-as-geopolitical-worries-grow-1492229480
FUNDAMENTAL
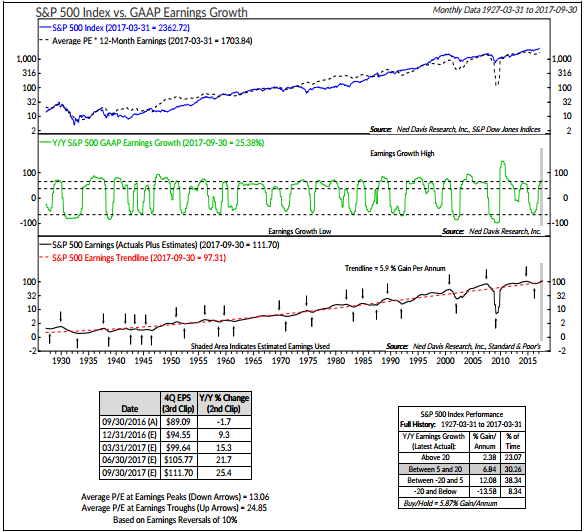
Last year’s earnings rebound appears to be continuing in 2017. The 15% year/year growth in S&P 500 GAAP EPS is higher than at all but three previous bull market peaks and dividend growth remains above average. We are skeptical, however, that earnings will grow as fast as consensus suggests, as year/year comps become more difficult, earnings momentum will likely slow, leaving the market left with both elevated expectations and valuations.
Ned Davis
 www.ndr.com
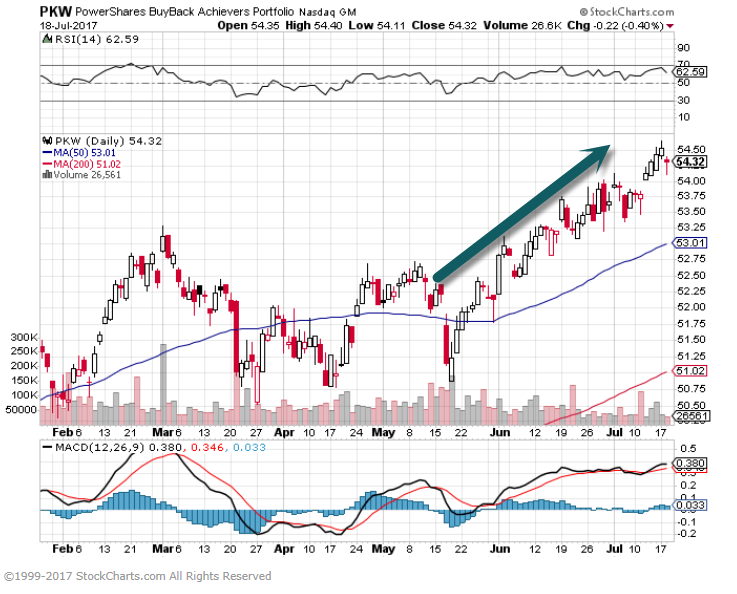
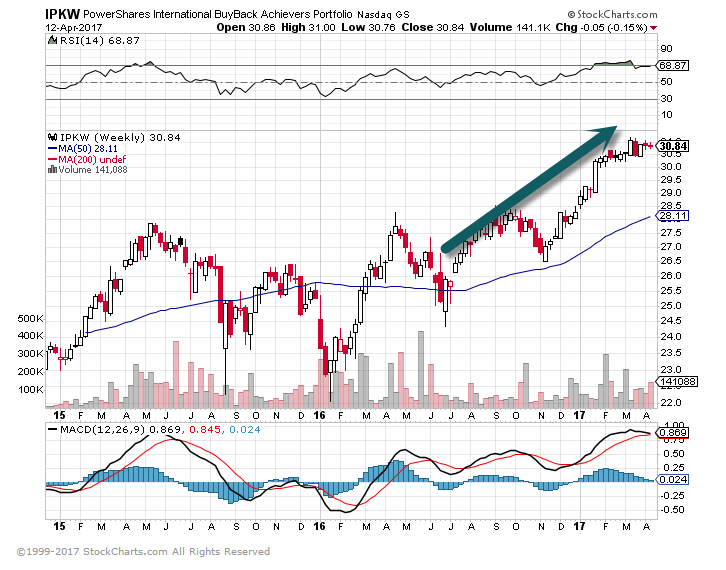
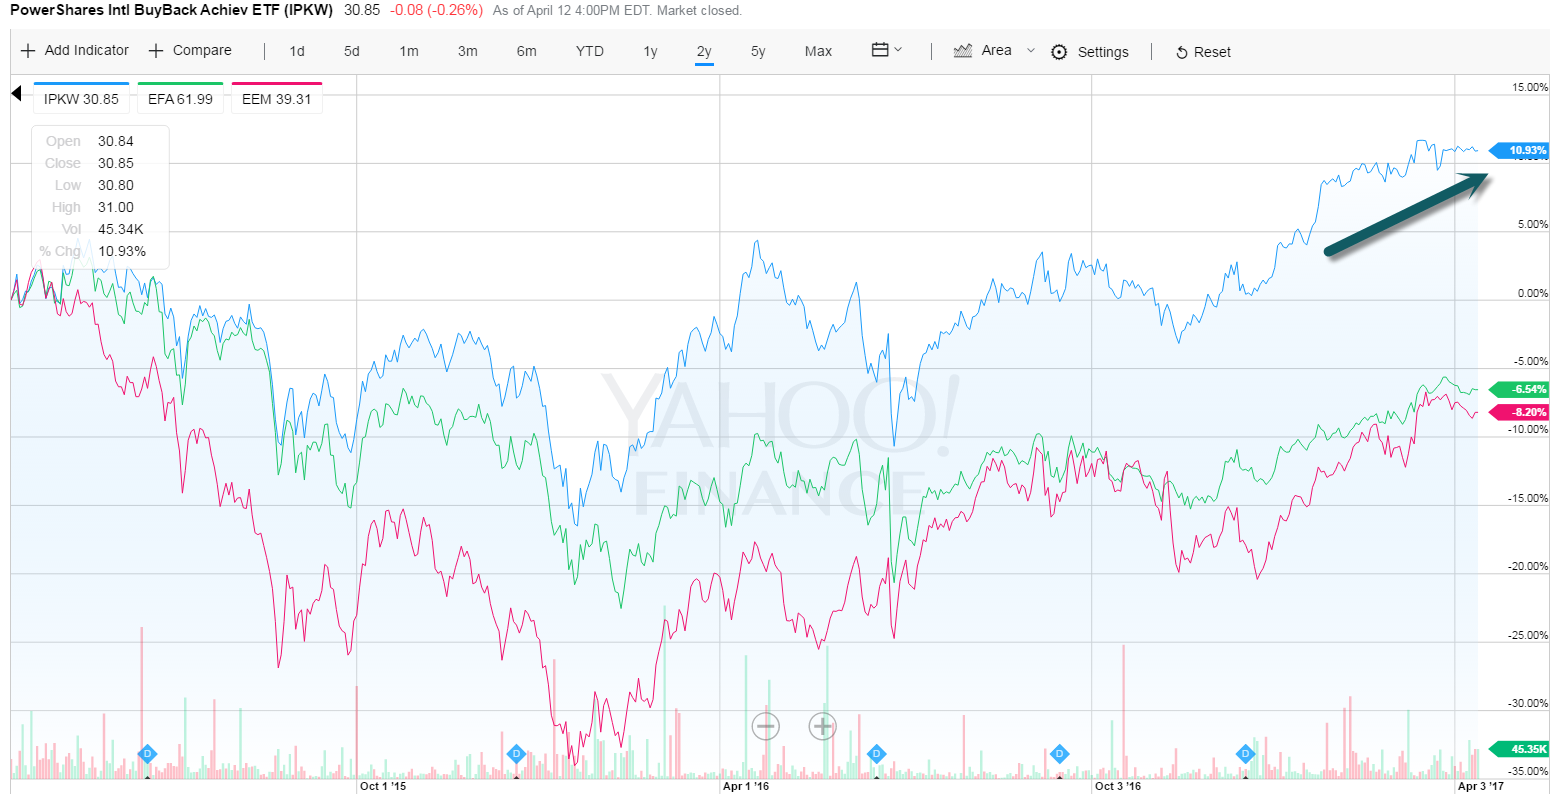
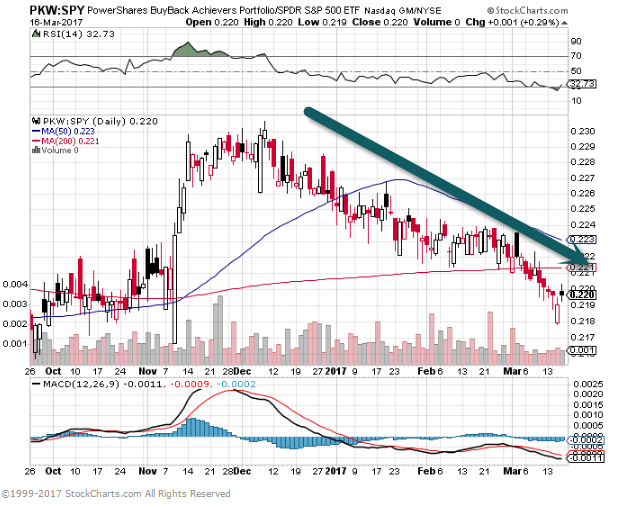
We have mentioned PKW-U.S. buyback ETF for 3 years as a leader of bull market. As International takes the lead this year, a new buyback ETF goes on watch list.

David Scutt, Business Insider Australia
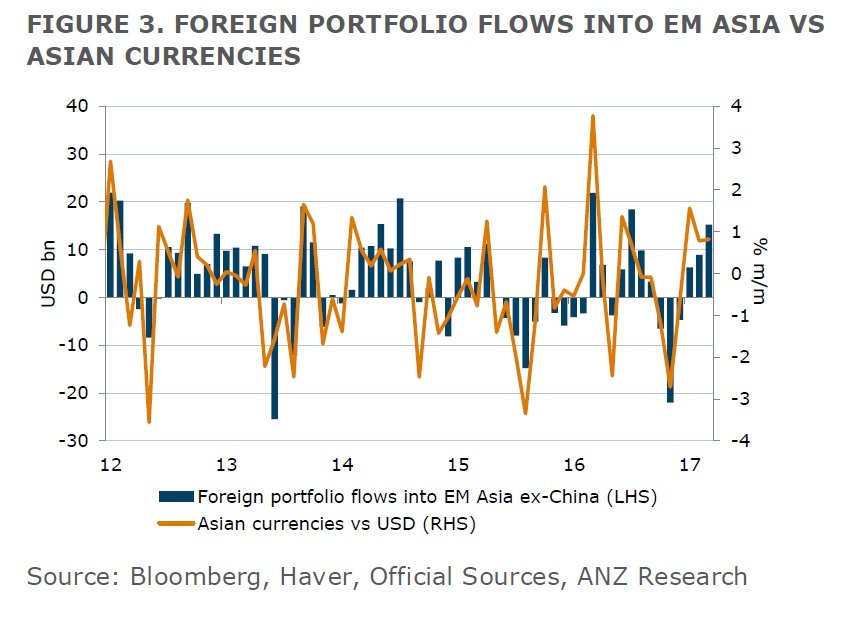
Foreign capital is flooding back to emerging markets across Asia, particularly for stocks.
According to new research released by ANZ today, capital inflows to the region rose to $US15.3 billion in March, the largest one-month increase since the middle of last year.
It was the third consecutive month that net inflows were recorded, all but unwinding similarly large outflows seen in the final three months of last year.
As this excellent chart from ANZ demonstrates, continued weakness in the US dollar against currencies in the region was probably a contributing factor behind the pickup in capital flows to the region.
http://www.businessinsider.com/foreign-capital-is-flocking-back-to-emerging-markets-in-asia-2017-4
www.yahoofinance.com

 www.yahoofinance.com
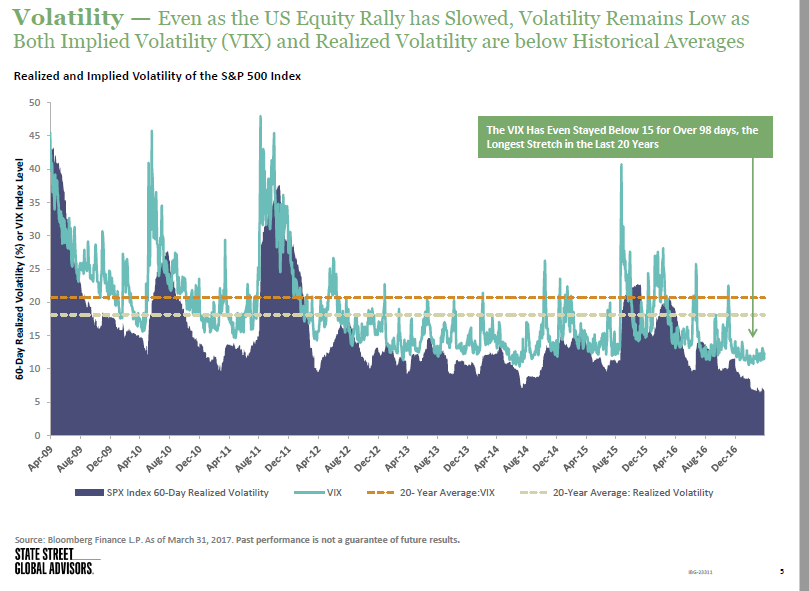
http://statestreetspdrs.com/1381/files/April_Chart_Pack_2017.pdf


https://www.ishares.com/us/products/239512/ishares-us-home-construction-etf

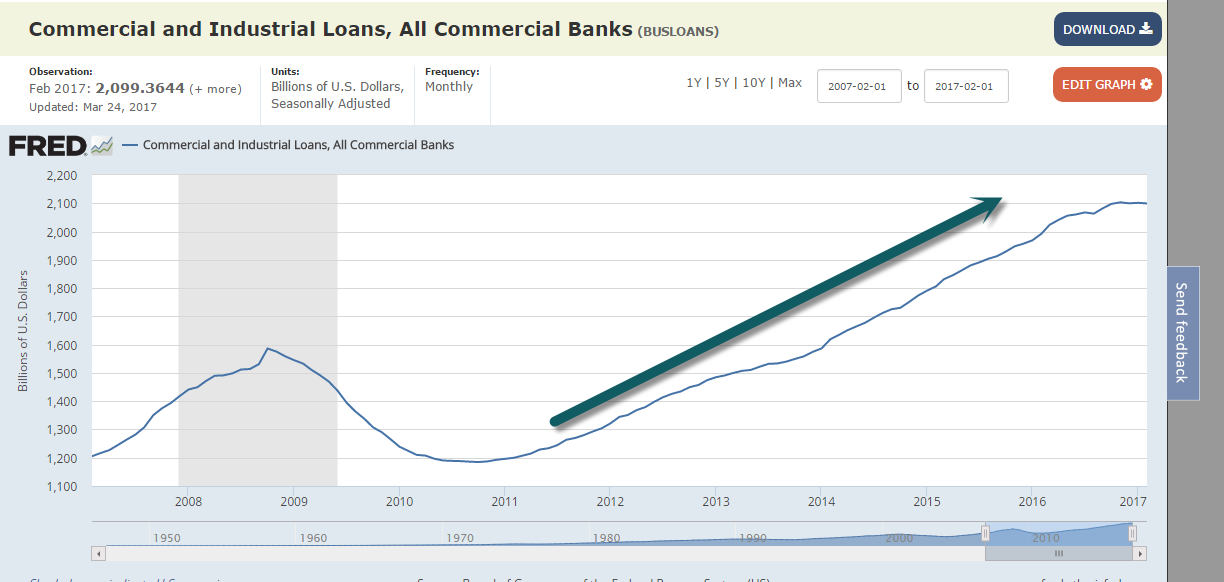
https://fred.stlouisfed.org/series/WALCL
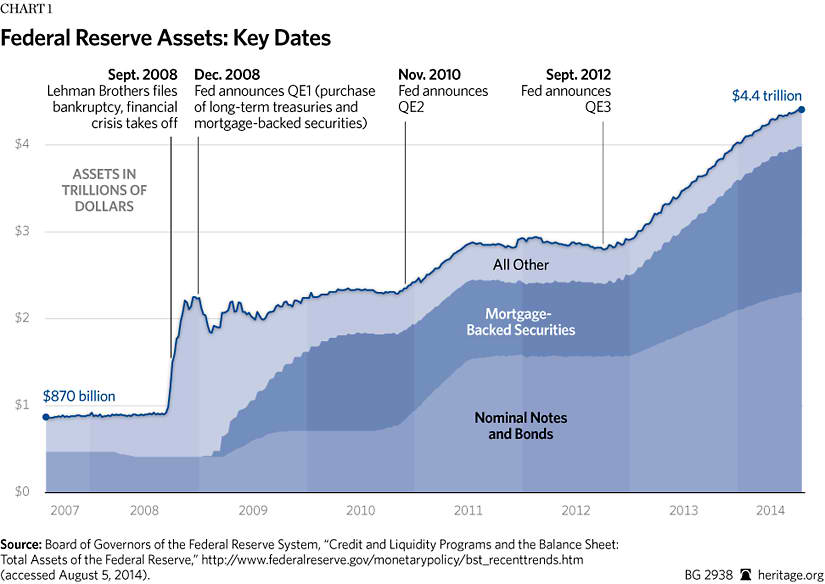

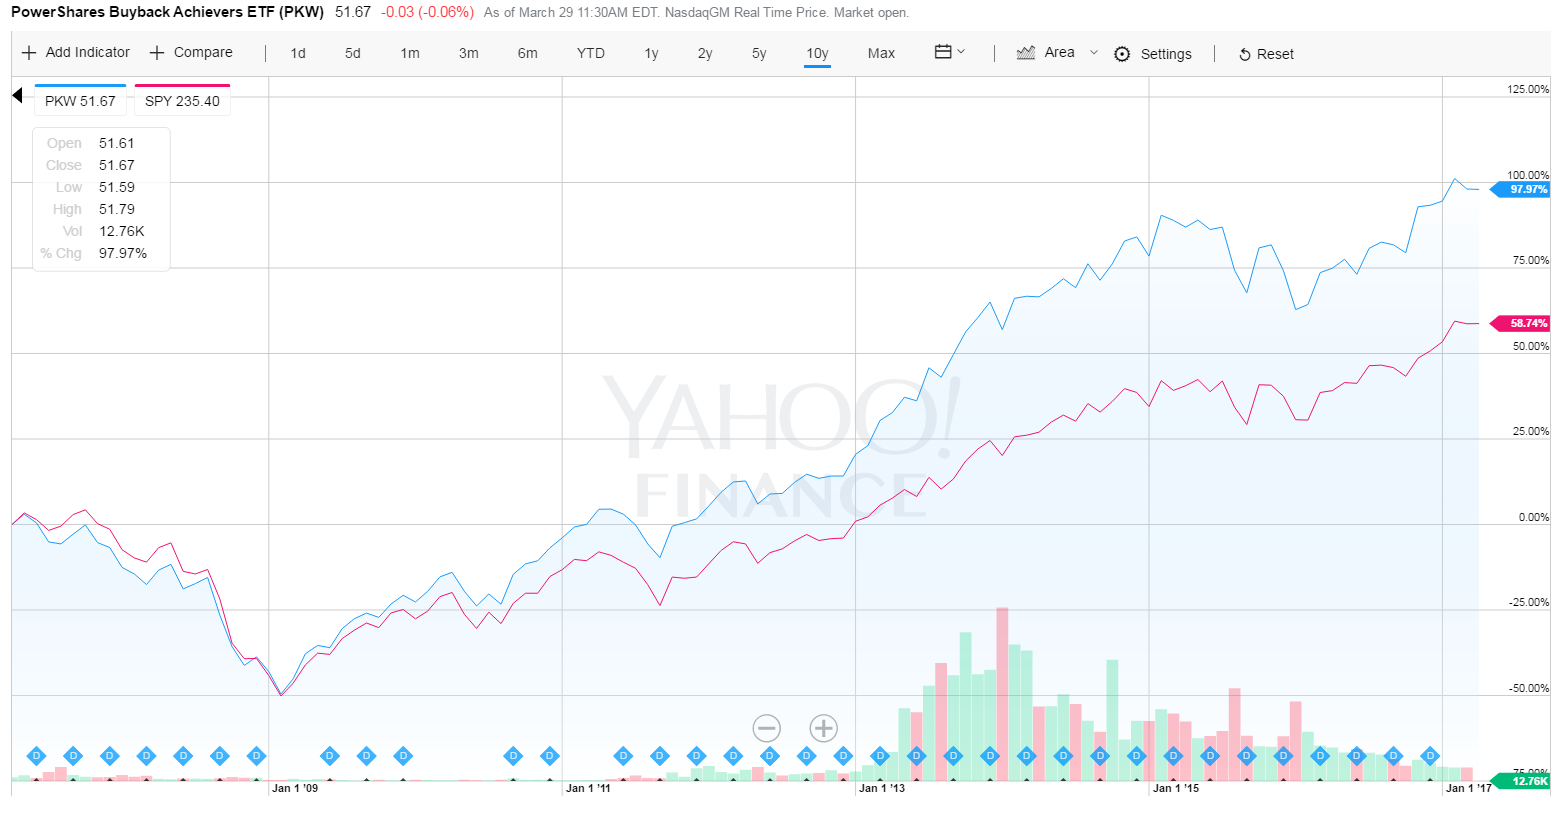
www.yahoofinance.com
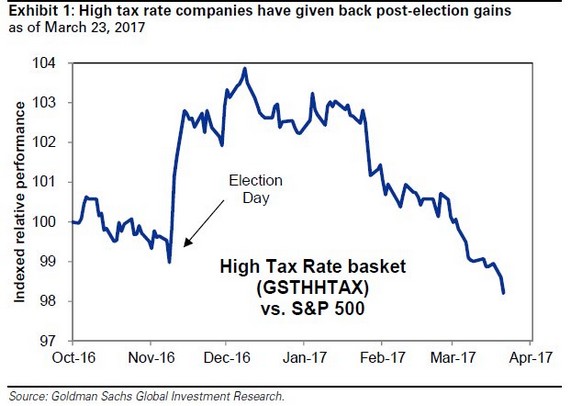
Equity Markets: According to the next chart, the markets seem to be giving up on US corporate tax cuts. It shows that a broad basket of companies paying the highest tax rates has reversed all of its post-election outperformance and then some. The stock market doesn’t see these firms in a lower-tax regime anytime soon
Source: @tracyalloway
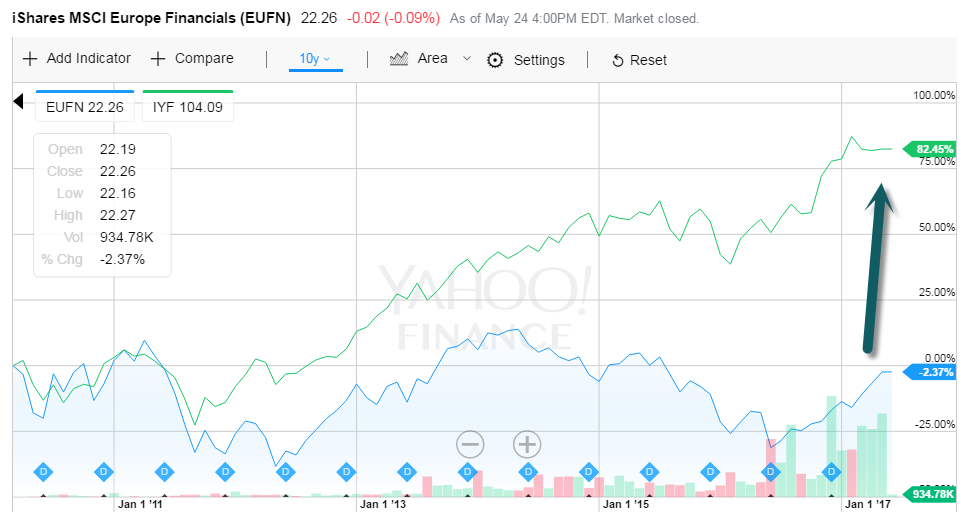
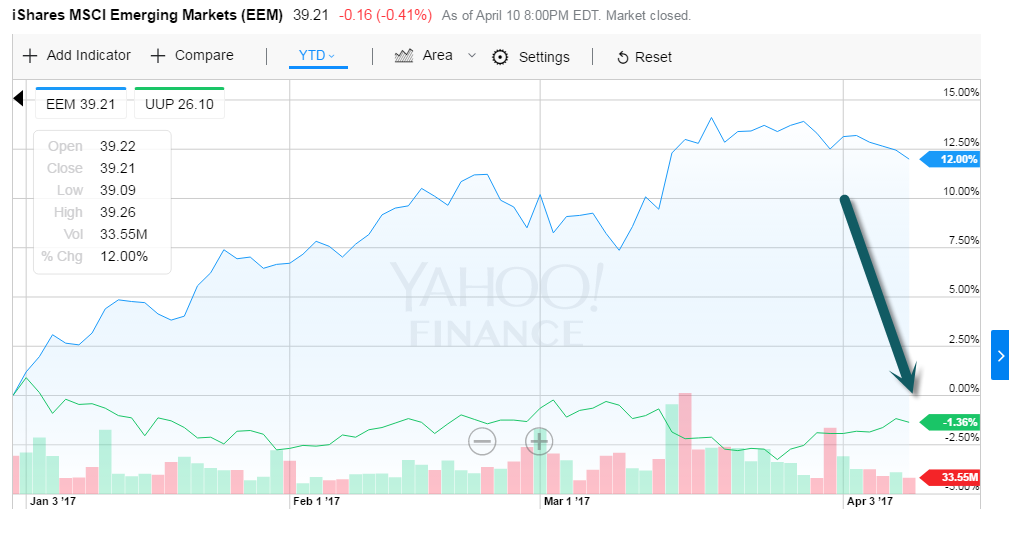
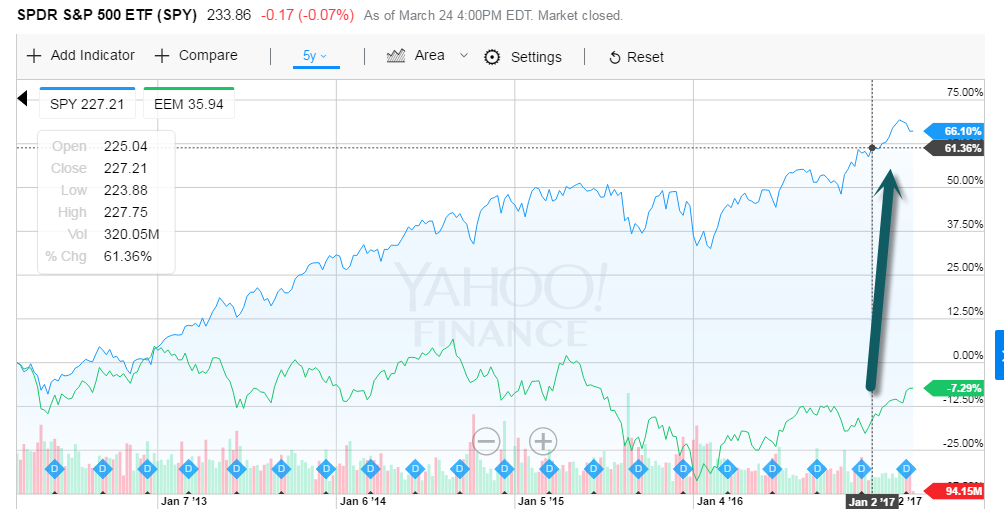
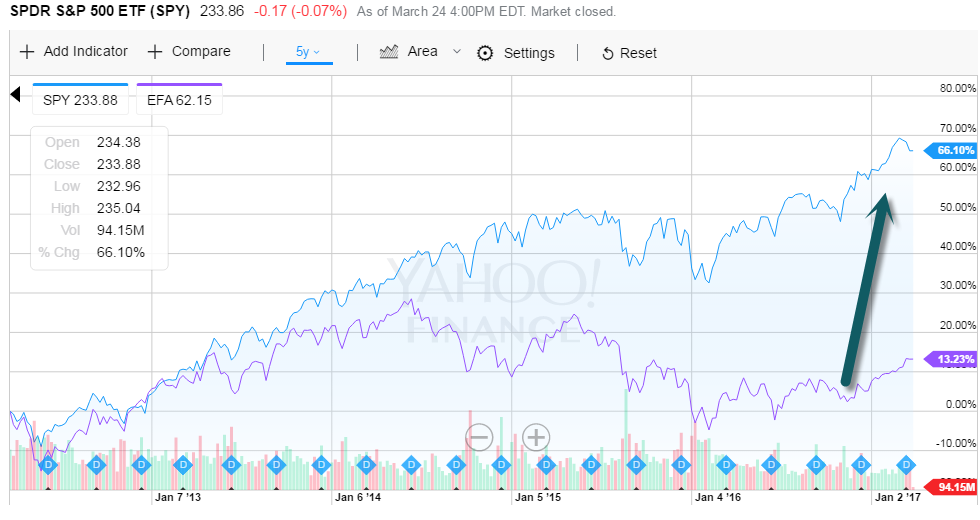
Since the 2009 bear-market low, the SPDR S&P 500 exchange-traded fund (ticker: SPY) has shimmied up 244%, outgunning the 96% gain in the iShares MSCI All Country Ex-U.S. ETF (ACWX), and 93% for the iShares MSCI Emerging Markets ETF (EEM).
 www.yahoofinance.com
 Continue reading
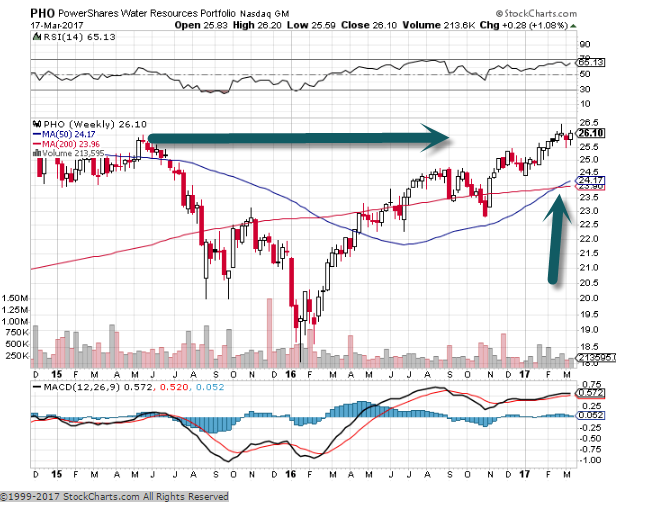
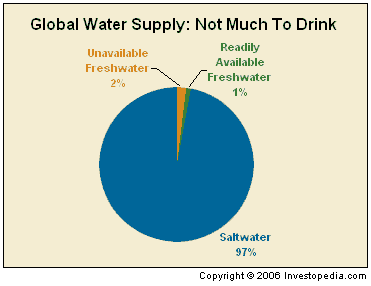
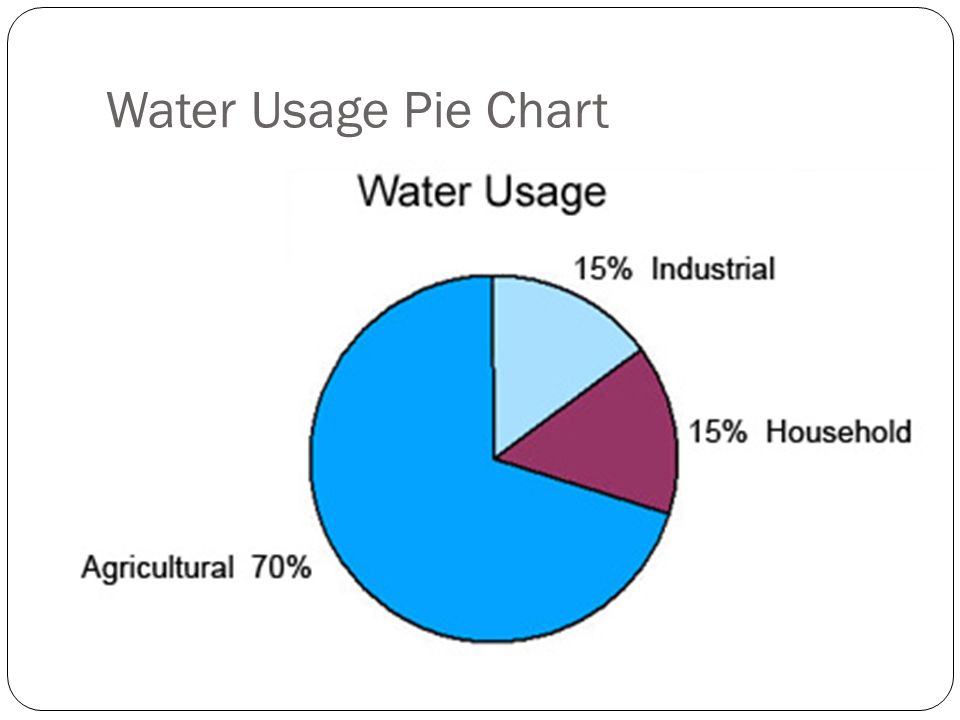
How to Invest in Water: 5 Picks
Analysts and money managers see a wave of water-related investments ahead. But there isn’t a single dominant company to bet on.
Today, for instance, the PowerShares Water ETF trades at 23.1 times trailing 12 month earnings—a tad richer than its median over the past decade, but well shy of the peak of 28.1 times. Compare this with, say, the Industrial Select Sector SPDR ETF (XLI), which is already straining at itsdecade-peak of 20.7 times trailing earnings.
http://www.barrons.com/articles/how-to-invest-in-water-5-picks-1489814477
 http://slideplayer.com/slide/6632427/

Buybacks 4th qt. 2016 half the previous qt. and lowest since 2014
For years, American companies’ loved nothing more than using their cash to buy their own stock. But tastes may be changing.
But the data also suggest a shift is underway. In the fourth quarter, nonfinancial companies bought back a net $323 billion in equities, at a seasonally adjusted annual rate, half as much as in the previous quarter and the lowest amount since the second quarter of 2014.
And unlike the third quarter, companies’ capital spending surpassed their cash flows, which is a return to normal. Companies usually borrow to spend, betting the payoff from the investments more than pay off the debt.
https://www.wsj.com/articles/stock-buybacks-are-so-yesterday-1489088699

 www.stockcharts.com