1.PKW Buyback ETFs Has Outperformed the S&P for the Entire Bull Market.
PKW (buybacks) vs. S&P…Chart to watch as rates rise. Will this money switch to capital spending?
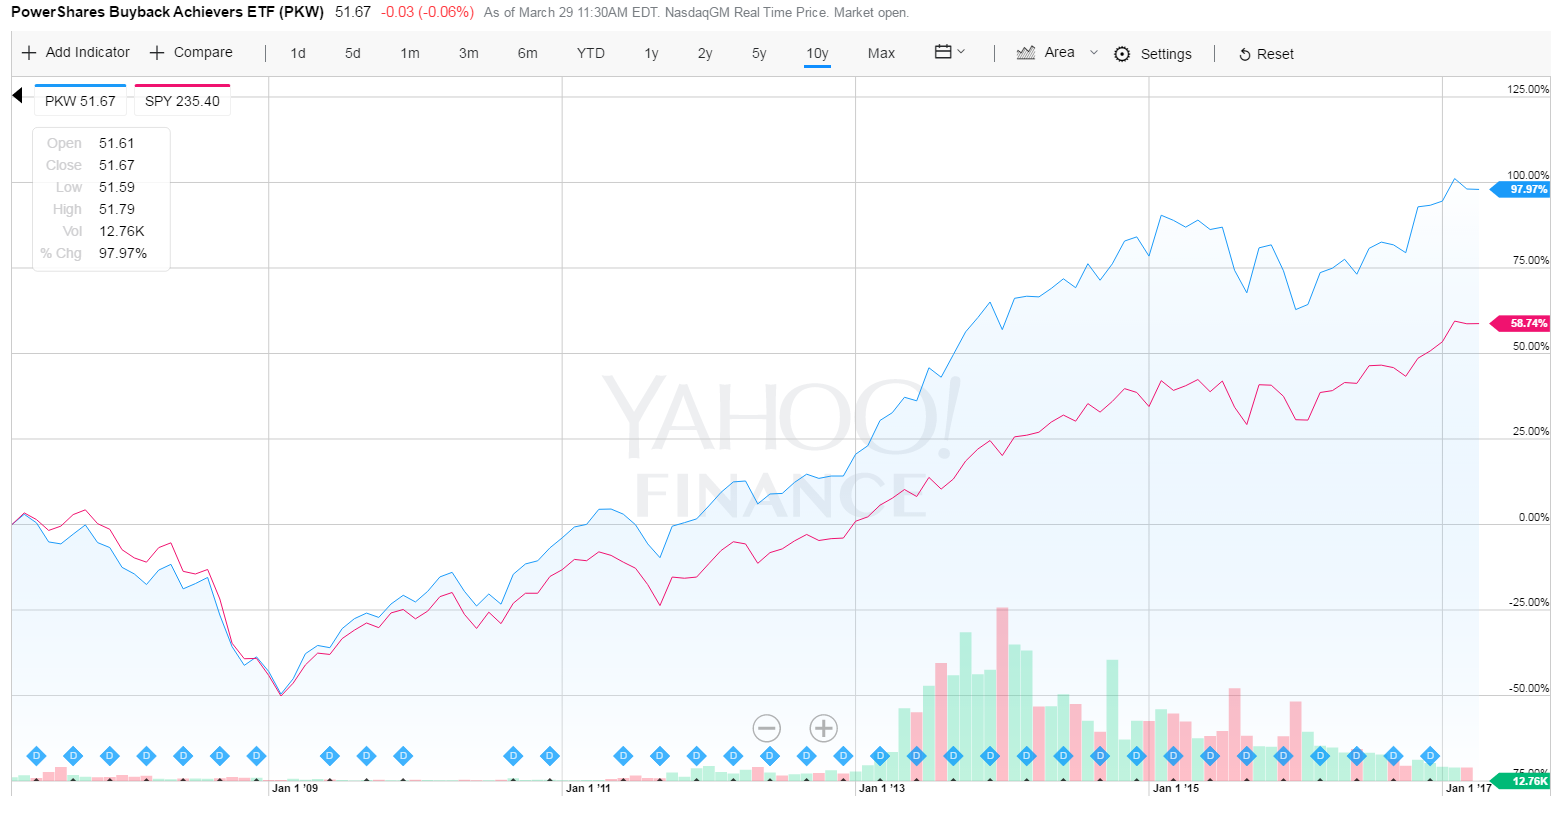
www.yahoofinance.com
2.More Positive Signs for Emerging Markets?
RAFI Emerging Market Fundamental Index 50day thru 200 day to upside
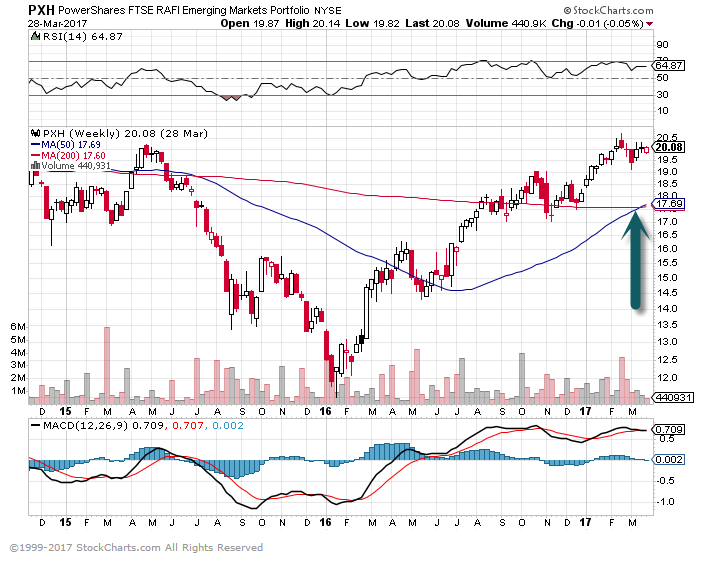
2016 Correction…This index traded near crisis levels.
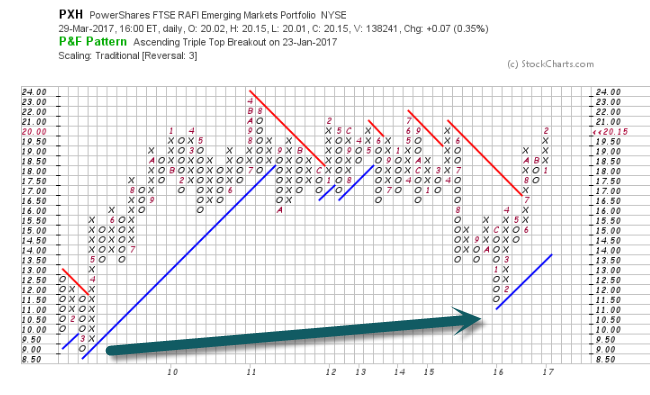 www.stockcharts.com
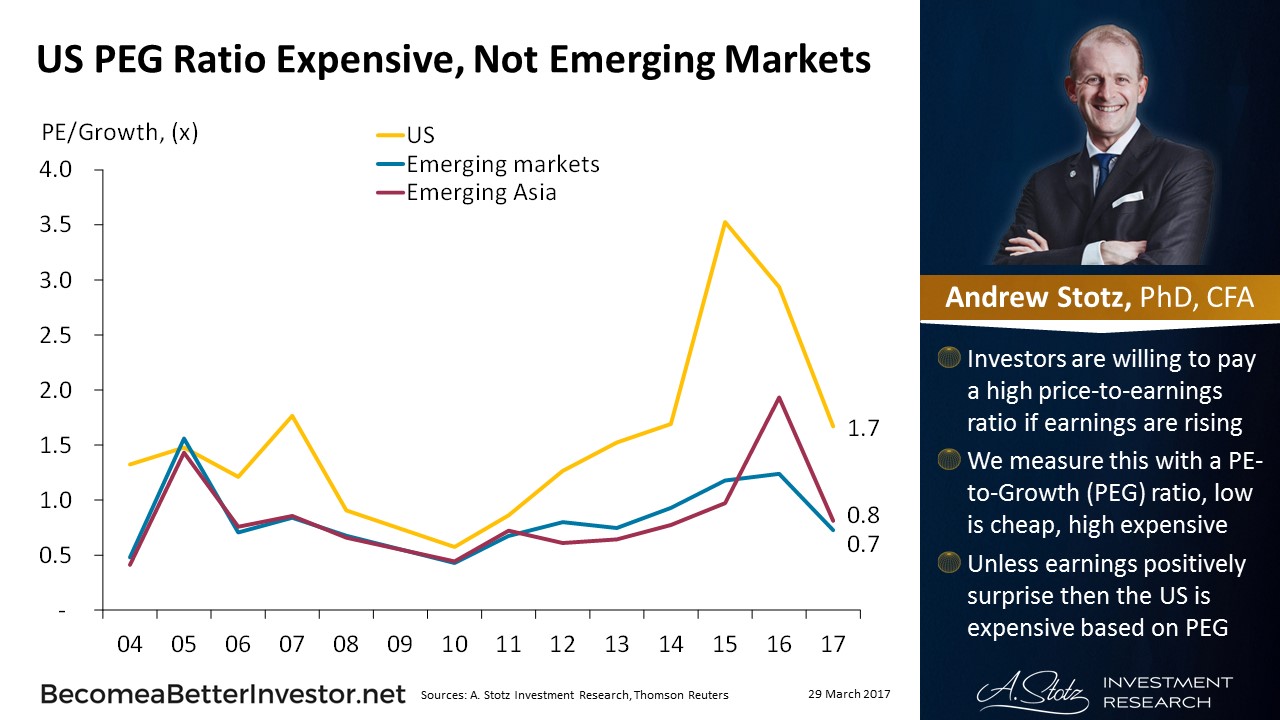
3.PEG Ratio—U.S. Vs. Emerging.
http://www.valuewalk.com/wp-content/uploads/2017/03/US-PEG-Ratio-Expensive-Not-Emerging-Markets.jpg
Price/Earnings To Growth – PEG Ratio
What is the ‘Price/Earnings To Growth – PEG Ratio’
The price/earnings to growth ratio (PEG ratio) is a stock’s price-to-earnings (P/E) ratio divided by the growth rate of its earnings for a specified time period. The PEG ratio is used to determine a stock’s value while taking the company’s earnings growth into account, and is considered to provide a more complete picture than the P/E ratio.
BREAKING DOWN ‘Price/Earnings To Growth – PEG Ratio’
While a low P/E ratio may make a stock look like a good buy, factoring in the company’s growth rate to get the stock’s PEG ratio can tell a different story. The lower the PEG ratio, the more the stock may be undervalued given its earnings performance. The degree to which a PEG ratio value indicates an over or underpriced stock varies by industry and by company type, though a broad rule of thumb is that a PEG ratio below one is desirable. Also, the accuracy of the PEG ratio depends on the inputs used. Using historical growth rates, for example, may provide an inaccurate PEG ratio if future growth rates are expected to deviate from historical growth rates. To distinguish between calculation methods using future growth and historical growth, the terms “forward PEG” and “trailing PEG” are sometimes used.
Read more: Price/Earnings To Growth – PEG Ratio Definition | Investopedia http://www.investopedia.com/terms/p/pegratio.asp#ixzz4cnkSrCY6
Follow us: Investopedia on Facebook
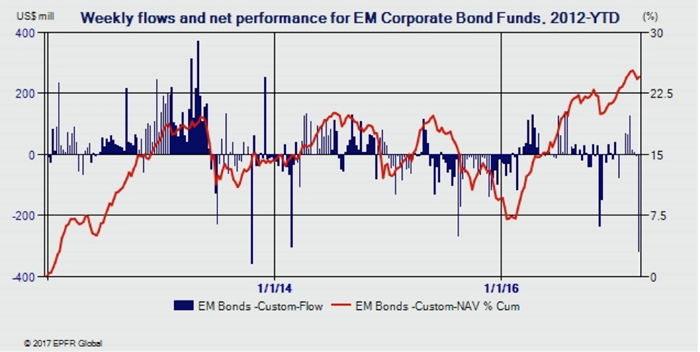
4.FUND FLOWS: Investors Put Money Back in Bond Funds
U.S. bond fund flows rebounded last week, helped by renewed doubts that the new administration will succeed in implementing its reflationary policies.
Cameron Brandt | Mar 28, 2017
A week after posting their first outflows year-to-date, EPFR Global-tracked Bond Funds were back in the money as flows into U.S. Bond Funds rebounded, helped by renewed doubts that the new U.S. administration will succeed in implementing many of its reflationary policies. This uncertainty about likely U.S. growth rates and the degree to which they might drive future interest rate hikes was also reflected in the flows to Japan and Emerging Markets Bond Funds, which hit 11- and 35-week highs respectively during the third week of March.
At the asset class level, Bank Loan Funds recorded their smallest inflow since late November, Inflation Protected Bond Funds attracted the least fresh money since their current inflow streak began in early December and High Yield Bond Funds recorded their third straight outflow.
Also recording outflows were Europe Bond Funds which saw redemptions climb to a 16-week high. Five funds, all Europe-domiciled, accounted for the bulk of the headline
number. The prospect of the European Central Bank switching to a tightening bias, and the risks that one of the current Eurozone members will exit the currency union so it can redenominate its debt in its domestic currency, are keeping investors on edge. However, fears that France will be that country are ebbing with France Bond Funds extending their longest inflow streak since early 4Q16.
Both Emerging Markets Hard and Local Currency Funds took in over $1 billion during the week. Investors gravitated to geographically diversified funds with sovereign or mixed portfolios at the expense of EM Corporate Bond Funds which recorded their biggest weekly outflow in over three years.
Advertising, Mouse Over For Audio
The renewed interest in U.S. Bond Funds saw all the major subgroups except U.S. High Yield Bond Funds post inflows during the week. Intermediate Term Mixed Funds attracted the biggest inflows in cash terms and Long Term Government Bond Funds in flows as a percent of AUM terms. Recent drops in oil prices, signs of stress among retail issuers and fears U.S. growth this year will not be as strong as hoped for are all weighing on junk bond funds.
http://www.wealthmanagement.com/fixed-income/fund-flows-investors-put-money-back-bond-funds?NL=WM-019&Issue=WM-019_20170329_WM-019_606&sfvc4enews=42&cl=article_1&utm_rid=CPG09000007333628&utm_campaign=8906&utm_medium=email&elq2=ac6dddf56e124df9b185c3aec2f516e8
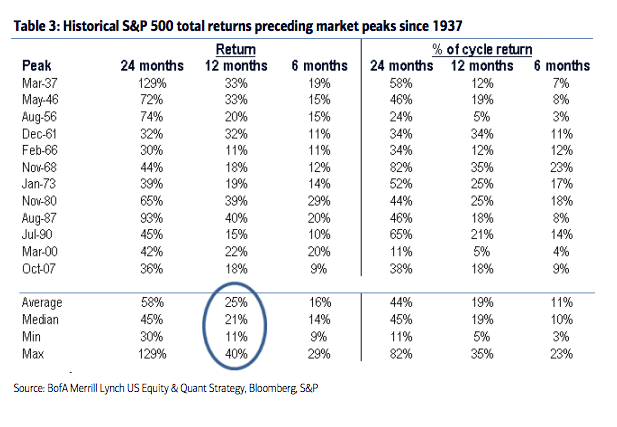
5.Tough to Miss Last Phase of Bull Market.
Chart o’ the Day: Here Comes the Happy Ending
Posted March 28, 2017 by Joshua M Brown
Earn $200 when you open a 360 Money Market & deposit $10k+
You don’t want to miss the end of a bull market, says Savita Subramanian, Bank of America Merrill Lynch’s Quant-in-Chief. It’s where some of the most explosive upside moves take place. Parabolic, skyscraper-like charts can happen just before it’s all over.
Additionally, you need euphoria to show up – not in the form of sentiment surveys but in actual dollar volume. You need fund flows. Savita makes the case that, if history is guide, we haven’t seen the best part yet (even if it ends in tears, as usual).
Here’s a look at the performance of stocks heading into historic bull market peaks, 24, 12 and then 6 months prior. It’s painful to miss the end of these things (you may click to embiggen):
From Josh Brown Blog. Reformed Broker
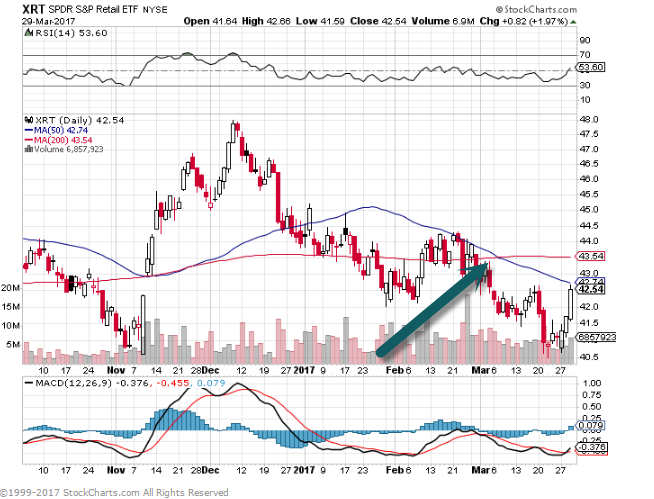
6.Death by Amazon Hitting Retail Again.
As the Mall REIT short plays out…Retail ETF Charts going negative…50day thru 200day to downside.
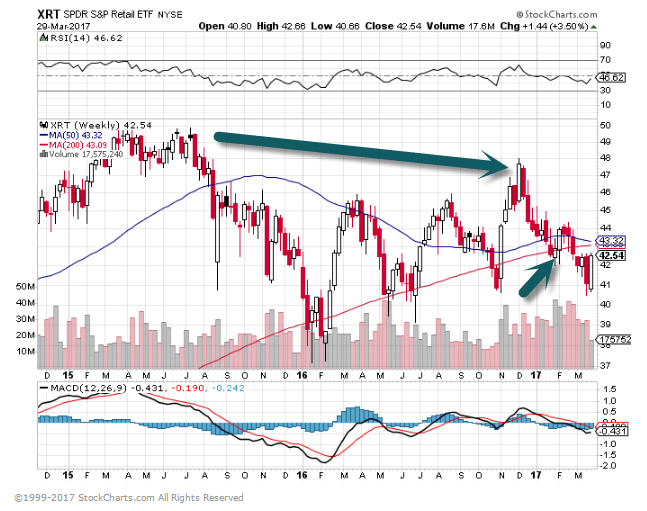
Longer Term Weekly Chart—Rally from 2016 lows never made new highs….closes below 200day.
www.stockcharts.com
7.Retailers Acting Sick Even as Gas Prices Trending Down…More Money in Consumer’s Pockets.
Gas Prices Sputtering Along
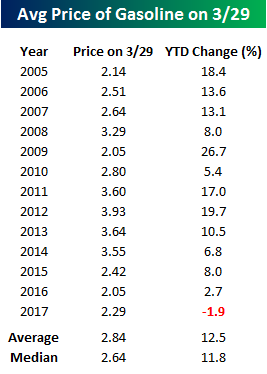
Mar 29, 2017
It’s been awhile since we last provided an update on national average gas prices, but recent trends are definitely worth highlighting. The table to the right shows the YTD change in gas prices based on AAA data this year and at the same point in each prior year dating back to 2005. With average prices at the pump down nearly 2% on the year, this is the first year where prices have actually been down YTD at this point in the year. This is a pretty big divergence from the overall average gain of 12.5% that is normal for this point in the year. Looking at the year by year returns, there has definitely been a trend in recent years where prices didn’t start off the year as strong as they have in the past, but this year’s decline is a bit extreme.
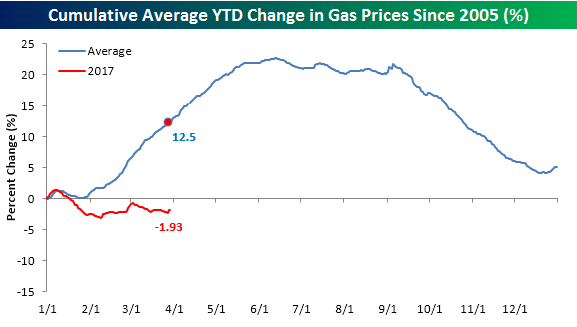
The chart below further illustrates this trend as it compares changes in prices YTD this year to a composite of the average YTD change for all prior years since 2005. By this point in the year, prices are typically already in rally mode leading up to the summer driving season. With oil prices weak this year, though, that seasonal lift has yet to materialize.
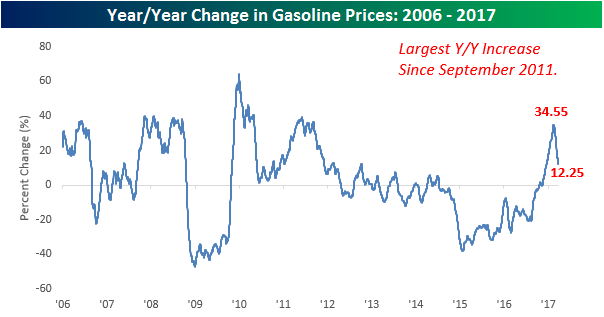
Finally, the chart below shows the year/year (y/y) change in gas prices going back to 2006. After prices bottomed in early 2016, the y/y change in prices began to recover and quickly accelerated to the upside the further away we moved from the lows. In late 2016, the y/y change in prices turned positive for the first time in over two years, and then quickly spiked to over 30% in February. As quickly as that y/y change increased, though, it has been declining even faster and is now just barely in double-digits at 12.25%, and if prices don’t start accelerating to the upside the y/y change will likely fall back to negative levels. The reason this is important is that it illustrates a trend we have seen throughout the commodity space in recent months, where base effects have had an exaggerated impact on y/y prices changes. Now that those low levels are falling further out than a year, though, the percentage changes are looking a lot less dramatic. This is also likely to start showing up in inflation statistics which have recently been lifting to multi-year highs on a y/y basis. Going forward, though, some of that upward pressure is likely to subside.
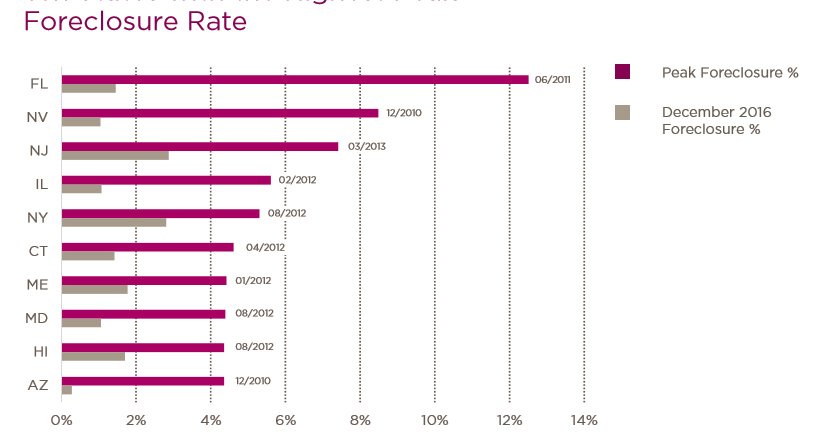
8.And the Final Number is 7.8 Million Homes Lost to Foreclosure from Crisis.
CoreLogic: “Between 2007–2016, Nearly 7.8 Million Homes Lost to Foreclosure”
Bill McBride Calculated Risk
Tweets by calculatedrisk
9.A Dearth of I.P.O.s, but It’s Not the Fault of Red Tape
Deal Professor
By STEVEN DAVIDOFF SOLOMON MARCH 28, 2017
Credit Harry Campbell
The confirmation hearing last week for Jay Clayton, who has been nominated to head the Securities and Exchange Commission, focused on the continued sluggishness of the market for initial public offerings. Senators pushed the nominee to do something, anything, to revive it.
The problem is that there is no magic wand — including deregulation — that can fix the decline.
The problems were recently documented in a research note by Credit Suisse titled “The Incredible Shrinking Universe of Stocks.” The bank documented that the total number of companies listed on the United States stock market plummeted by nearly half, to 3,671 last year from 7,322 in 1996.
Companies get bought or go out of business, but new companies are not replacing them. In 1996 there were 706 initial public offerings, but in 2016 there were only 105. The downturn affects all sectors, and last year there were only 30 new private equity offerings, the “lowest level since 2009,” according to Credit Suisse.
Such shrinkage has prompted hand-wringing for over a decade. At Mr. Clayton’s hearing, at least five senators brought it up, pointing to the regulatory burdens on companies going public.
There’s only one problem with casting regulation as the villain: There’s not much evidence for it.
In 2012, Congress took a stab at fixing the regulatory issues in the Jump-Start Our Business Start-Ups Act. The changes have been well-received by entrepreneurs. Some provisions, like the one allowing for confidential review with the Securities and Exchange Commission, have been particularly popular.
But the JOBS Act has not spurred initial public offerings in any meaningful way. One study found that it may — may — have resulted in 21 more new offerings a year, but given the small numbers in the analysis, that is questionable.
Moreover, the JOBS Act has done nothing to revive the market for small companies, those with a market capitalization of under $75 million. They still number less than a handful each year.
And while fingers get pointed at regulation like Sarbanes-Oxley and Dodd-Frank, the number of initial public offerings fell off the cliff in 1996 — years before either bill was passed. So there must be something more here.
Those who have examined this issue have come up with a number of possible reasons.
The first theory is that the decline is a result of structural changes in the market ecosystem. Jay Ritter, a professor at the University of Florida, has argued that the dearth of initial public offerings has been caused by companies selling out quicker.
The Credit Suisse paper also brings up this theory, noting that mergers are the major cause for companies to be delisted from a stock exchange. It appears that this deal activity has spread to the private markets, co-opting the process of taking companies public.
For example, Cisco Systems purchased AppDynamics on the eve of its market debut. And acquirers seem willing to pay top dollar in these instances, as research and development by many large corporations now consists largely of acquiring smaller, usually private, companies.
This is aptly illustrated by the buying sprees of Google and Facebook, which took candidates to go public — like Instagram, Nest, Waze and WhatsApp — out of contention.
Another possibility involves demand. In a paper that I wrote with Robert Bartlett and Paul Rose, we explore this theory. The drop-off in activity is largely attributed to the disappearance of the small offering.
In 1996, average proceeds for an initial public offering were $85.7 million, and 54 percent of these offerings were considered small, with a market capitalization below $75 million in inflation-adjusted dollars. In 2014, however, average proceeds were $186.4 million and only 4 percent of offerings were small.
The market for new issues has moved toward liquidity and bigger stocks. Mutual funds prefer making big investments rather than small ones for liquidity and administrative purposes — lots of small investments simply require more people and more monitoring.
A third possibility is that companies simply no longer need the public market. The private markets are more efficient, and financing is readily available from venture capitalists and banks.
There are even markets and mechanisms that exist not only to allow for financing, but to allow for selling employees’ and founders’ shares in private markets. In addition, the JOBS Act allowed companies to expand the number of shareholders and still be private, a change that encouraged companies to remain private.
There are other theories. One of these notes that the 1990s saw a surge in I.P.O. activity and that we are just back to what the activity was in the 1970s and ’80s. Who is to say what is a normal market?
Another possible reason is that companies are shying away from the public markets to avoid shareholder activism, short-termism and the glare of public scrutiny.
Yet the growing use of dual class shares and staggered boards by new companies, measures that help founders retain control, argues against this need. And they are tools that can be used by any company — even Shake Shack went public with dual-class stock.
The bottom line is that while there might be rational reasons to reduce regulation on capital raising — to make it easier and less expensive — we are kidding ourselves if we think that simply deregulating will bring back initial public offerings.
The task is much harder. The Securities and Exchange Commission, for one, could help build an infrastructure for buying small company offerings. Allowing mutual funds more latitude to buy illiquid small investments and to change their compensation structures if they do would be a big step.
In addition, we could explore more novel ways of bringing companies to the public markets. Special purpose acquisitions companies — those created to buy a private company and bring it public — have attracted criticism, including from me. Yet a recent $900 million deal in the energy business shows one possible way to take more companies public, provided there are investor protections.
Then there is the argument that maybe we shouldn’t do anything, given how hard it will be. The idea behind the public markets is to provide capital funding. But if the private markets are now efficient and capable of providing even less expensive capital at lower cost, maybe we should be fine with the current state of affairs.
Still, that overlooks the fact that for most of us, our retirement money is in the public markets. We should be worried about all of this money flowing into a smaller and smaller group of companies.
One answer is to allow mutual funds to invest more in private companies. Already 26 mutual fund groups had $11.5 billion invested in late-stage companies in 2016, according to Credit Suisse.
That’s one answer, but that will result in yet more intermediaries. The better solution is to push more companies to the public markets. Deregulating is one thing, but the real work will require more innovative thinking from market regulators. That’s your homework, Mr. Clayton.
On a personal note, I’ve been writing the Deal Professor column for DealBook for over nine years now, and this will be my last column before I take an extended sabbatical to work on other projects.
10.Why Great Leaders (Like Richard Branson) Inspire Instead of Motivate
Inspiration (not motivation) is the most important leadership trait, fueled by passion and purpose. Here’s how top leaders inspire their people.
People often use the terms “inspire” and “motivate” interchangeably. Conceptually they may seem related, but in fact they are worlds apart.
“Inspire” translates to “in spirit.” Inspiration comes from within.
The root word of “Motivate” is “motive,” which is an external force that causes us to take action.
Motivation pushes you to accomplish a task, or work through a difficult event, even when you would rather be doing anything else. We are motivated by a result.
ADVERTISING
Inspiration pulls you towards something that stirs your heart, mind, or spirit. We are inspired by a person, an event, or a circumstance.
When we are inspired, we aren’t thinking about the final end state. In fact, when we are filled with inspiration, we want to hold onto that feeling for as long as possible.
When we are filled with inspiration, we often don’t need external motivation to move forward. The feeling of purpose and meaning is enough to propel us. When we are void of inspiration, we must seek out ways to keep ourselves moving forward towards a clearly defined end state.
Those without a clear vision, mission, or purpose often require lots of external motivation to keep moving forward.
Those that operate and live from a place of purpose are inspired every day to give 100%. They may get tired, but they can reach back to their higher purpose to be inspired. This is why the most effective leaders are the most inspired leaders – and the most inspirational.
Richard Branson identifies the ability to inspire as the single most important leadership skill. The ability to infuse energy, passion, commitment, and connection to an organization’s mission and direction is essential in any growing company.
According to an IBM survey of 1,700 CEOs through 64 countries, the three leadership most important leadership traits are:
1. the ability to focus intensely on customer needs,
2. the ability to collaborate with colleagues, and
3. the ability to inspire.
Inspired employees are more than twice as productive as satisfied employees, according to a survey conducted by Bain Research.
Harvard Business School gathered data from assessments of more than 50,000 leaders, and the ability to inspire stood out as one of the most important competencies. It is the trait that creates the highest levels of engagement, it is what separates the best leaders from everyone else, and it is what employees want most in their leaders.
How Great Leaders Inspire
As Simon Sinek taught us in his TED Talk, “How Great Leaders Inspire Action,” no one follows a leader for the leader. They follow a leader for themselves. The most inspirational leaders ignite a spark within their employees and followers that move them to action. They don’t require motivation to act because they’ve been inspired.
How can you inspire your people? What follows is a collection of strategies compiled from various studies and sources.
1. Have a Clear Vision, Mission, and Values System. Inspiring leaders know that the most effective way to enroll followers is to clearly articulate what they believe in, why they exist, and where they are going. Followers need something tangible to grasp.
2. Create Stretch Goals. Paint a bold picture for your employees and followers that helps them visualize unlimited possibility.
3. Work with Them. The most inspiring leaders are highly collaborative. They work alongside their people to make things happen, rather than issuing directives. Two of the most inspiring words are we and together.
4. Encourage Self-Development. Inspiring leaders want their people to develop. They invest in them, and they encourage activities that foster physical, intellectual, emotional, and spiritual growth & well-being.
5. Acknowledge Them. Everyone has 3 fundamental needs, according to science: to feel safe, to feel like we belong, and to feel like we matter. Through acknowledgement and appreciation, we can address all 3 needs, and inspire our people to give us 100%.
6. Invest Time in Good Communication. Inspiring leaders understand the impact of great communication, and the harm of poor communication. They know communication can be a catalyst to growth, and use it as a strategic tool to achieve their goals.
7. Listen. Again, employees want to know they matter. It’s not enough to share your vision. Followers want to contribute their ideas and perspectives as well.
8. Act with Integrity; Inspire Trust. Employees take their cues from their leaders. They are always watching. To believe in their leaders, they must believe them. Inspiring leaders know every action matters.
The next time you want to motivate your people, ask yourself how you can inspire them. Look inside for your answers to drive a devoted following, quantum growth and lasting change.
Good luck!
By Marissa Levin
Founder and CEO, Successful Culture
http://www.inc.com/marissa-levin/why-great-leaders-like-richard-branson-inspire-instead-of-motivate.html?cid=readmoretext