1.The Dividend Bull Market Has Pushed Valuations to Record Levels.
Larry Swedroe Weighs In…
The table below shows three value metrics—price-to-earnings (P/E), price-to-book value (P/B) and price-to-cash flow (P/CF)—for two of the market’s most popular dividend strategies: the SPDR S&P Dividend ETF (SDY), with more than $14 billion in assets under management (AUM), and the Vanguard Dividend Appreciation ETF (VIG), with more than $22 billion in AUM. Data is as of July 13, 2016. VIG buys the stocks of companies with rapid growth in their dividends.
The table also shows the two large-cap value ETFs with the most AUM, the iShares Russell 1000 Value ETF (IWD) and the Vanguard Value ETF (VTV). Finally, I’ll compare the value metrics of these funds with that of the SPDR S&P 500 ETF (SPY). As you review the data, remember that the lower the price metric, the higher the expected return. Data is from Morningstar.
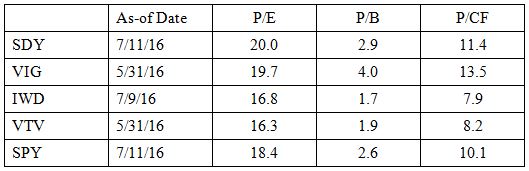
The above data makes clear that the popularity of the two dividend strategies (SDY and VIG) has led to a rise in the prices of these stocks and reduced their expected returns. No matter which value metric we look at, the expected returns for both SDY and VIG are now well below the expected returns of the two large value strategies, and also below that of the S&P 500 ETF. It’s an example of the curse of popularity, and what happens when a trade gets “crowded.” Forewarned is forearmed.
Larry Swedroe on Dividends
http://www.etf.com/sections/index-investor-corner/swedroe-irrelevance-dividends?nopaging=1
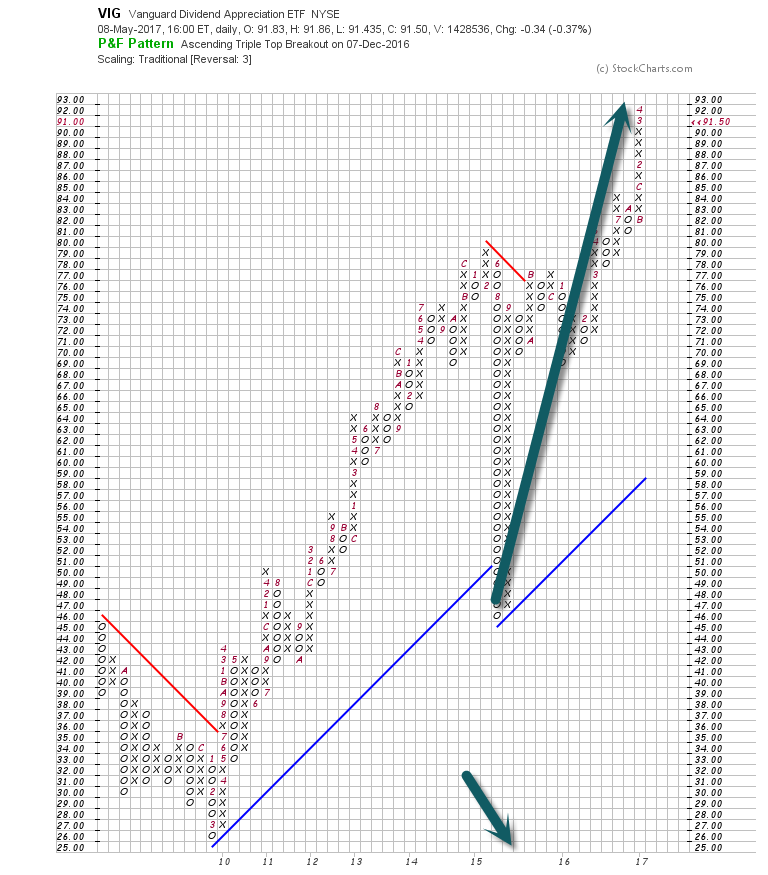
Dividend Stocks Have Doubled Since Pullback in Mid-2015
www.stockcharts.com
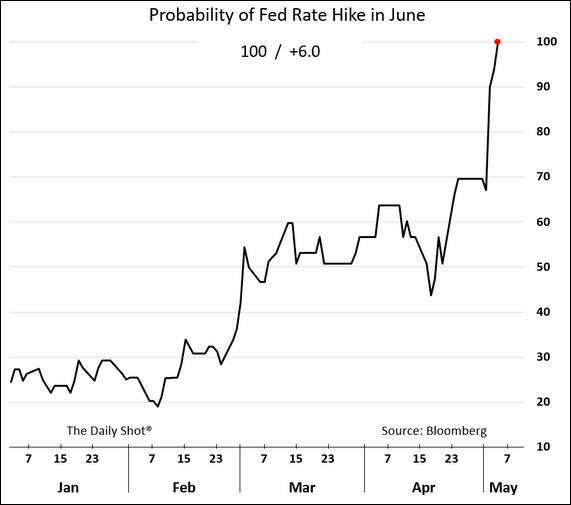
2.Rate Hike Probability in June Hits 100%.
The June rate hike probability jumped to 100% in response to the employment report. Just like we saw in February/March, the Fed officials will begin the rate hike “road show” in the next couple of weeks to make sure the message gets out.
www.thedailyshot.com
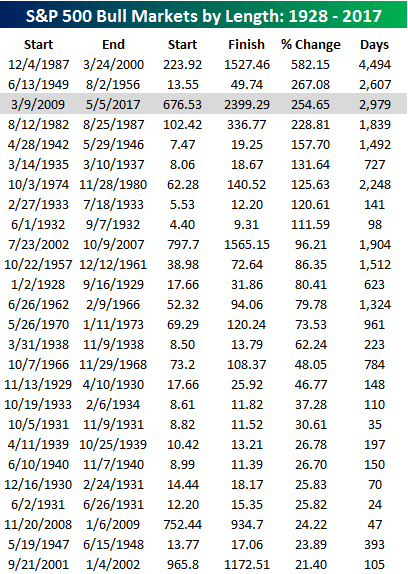
3.S&P Needs Just 3.4% to Become Second Longest Bull Market of All Time.
In terms of strength, the current bull market ranks as the third strongest of all time. The table below lists all S&P 500 bull markets since 1928 sorted by strength. The only two that were stronger than the current one were the 1987 – 2000 run and the 1949 – 1956 rally. At current levels, though, the S&P 500 is right on the heels of the bull that ended in 1956. In fact, to move into second strongest of all time, the S&P 500 would have to rally just 3.4% to 2,483.44. A move into first place, however, is a bit more of a longshot. In order to move into the top spot, the S&P 500 would have to rally an additional 92% to 4,614 without a 20% decline in between. It’s a ways off, but we wonder if even that would be enough to move the AAII Bullish sentiment reading above 50%.
4.This Time is Different….The IPO Boom that Wasn’t….Private Equity is Carrying the Bag on High Valuations?
Modern IPO History….The 3rd Longest Bull Market Ever has not Produced Traditional IPO Boom.

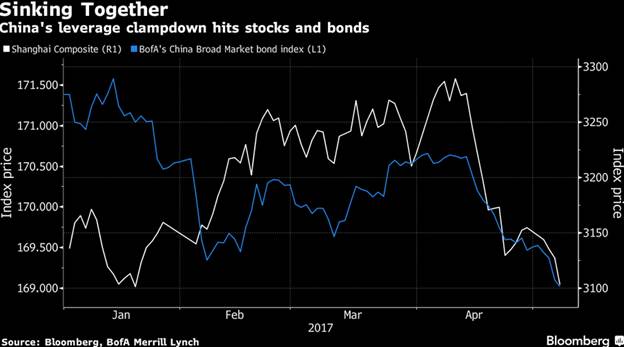
5.Chinese Government is Clamping Down on Financial Leverage
The Chinese government clampdown to reign in financial leverage has erased at least $453 billion from the value of Chinese stocks and bonds since mid-April, spurred $21 billion of canceled debt sales and compelled the People’s Bank of China to inject $48 billion into jittery money markets. Sales of asset-management products by lenders and trust companies have plunged by more than 30 percent, while domestic real estate transactions have slowed and metals prices have buckled (Bloomberg
From Dave Lutz at Jones.
6-7.Barry Ritholtz Takes on the VIX Below 10 Issue.
The VIX Tells Us Very Little About Tomorrow
All the hand-wringing because the “fear index” has fallen below 10 is a waste of time.
By
Barry Ritholtz
May 8, 2017, 7:00 AM EDT
No need to panic.
Source: New York World-Telegram and the Sun Newspaper Photograph Collection/Library of Congress
Instead, let’s consider some of the underlying factors impacting the VIX — or more correctly, the Chicago Board Options Exchange Volatility Index, which reflect market estimates of future volatility — to see if we can properly frame what it means for investors and traders.
Vexing VIX:
No. 1. VIX Under 10: Let’s begin with the issue that made the rounds this past week: The VIX broke 10, and the past time it did that was 2007 and you know what happened next.
There are two obvious problems with this line of thinking. The first is the tiny sample set of how often the VIX is in single digits. We had the mid-2000s, and the early 1990s and now. There are simply not a whole lot of recent examples when the VIX was that low. The second is the overemphasis on 2007. The financial crisis and stock collapse wasn’t about stock-market complacency and a low VIX.
See the chart below:
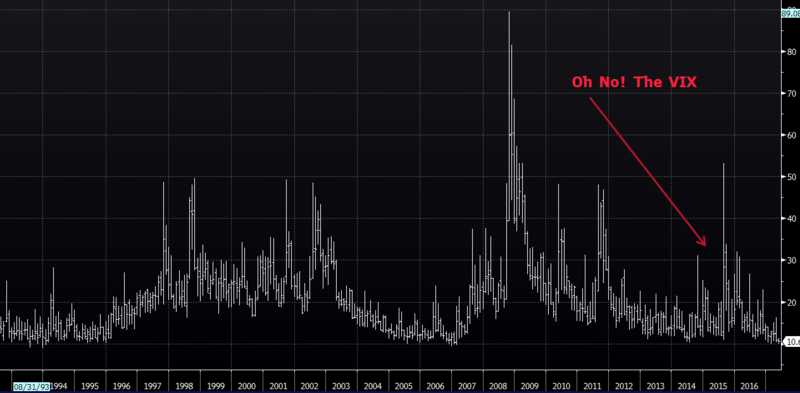
This is what happens when markets trend lower for a while. In all three examples when the VIX went below 10, markets were more than five years into recoveries from major plunges: The 1987 crash, the dot-com implosion in 2000 and the financial crisis in 2008-09. In each of these cases, markets afterward rose double-digit rates for a good long while as the VIX fell.
Yes, I recall how the 1990s ended, with the Standard & Poor’s 500 Index down 47 percent and the tech-heavy Nasdaq Composite Index shellacked by almost 80 percent. But that raises a separate question: Are you willing to give up six years of those sorts of gains to avoid the possibility — not the certainty — of a market crash at the end? And what makes you believe you have the intestinal fortitude to be able to jump back if there is a major retreat?
No. 2. VIX is a bet on prescience and probability: When we break it down to its most basic components, the VIX is in part a reflection of what option traders believe the markets might do during the next 30 days. The market sets prices in response to demand, which is driven by all sorts of things: Sentiment, news, and of course, investor angst.
No. 3. VIX is a mirror image of market trend: The VIX often drifts inversely to the dominant trend. In a rising market, the VIX slips lower; when we see minor pullbacks, it blips higher; when we see significant moves down, it jumps up wildly.
No. 4. It isn’t just equities: Bank of America Merrill Lynch has a Move Index that looks at expected volatility in the U.S. Treasury market. It too has been falling, despite the Federal Reserve’s rate increases and indications of more to come.
No. 5. Are investors still hedging?: My colleague Josh Brown credits the rise of indexing and rediscovery of buy-and-hold investing with the reduction in the desire to hedge equity exposure. I agree with his analysis.
No. 6. Technical reasons: Bloomberg Markets observed that VIX exchange-traded products linked to the index “have altered the futures market, and at times indirectly influenced the index itself.” We have to recognize the possibility that the new instruments have changed how the old instruments trade.
The bottom line is simply that the VIX tells us very little about what the market is likely to be doing tomorrow, or next month, or even next year. It certainly is not the reliable prophesy of doom some perma-bears make it out to be.
This column does not necessarily reflect the opinion of the editorial board or Bloomberg LP and its owners.
Read Full Story at
https://www.bloomberg.com/view/articles/2017-05-08/the-vix-tells-us-very-little-about-tomorrow
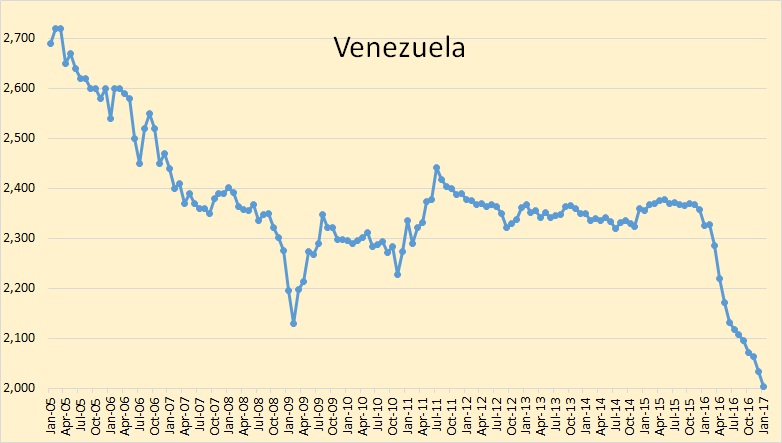
8.Venezuela on the Brink of Civil War….
CARACAS, Venezuela—Nationwide protests are spreading beyond President Nicolás Maduro’s control and risk morphing into civil war, said a retired Venezuelan general who was in charge of suppressing the last wave of unrest three years ago.
“We’re seeing much larger masses protesting across all major cities, including the working-class neighborhoods” once firmly supporting the government, said Major Gen. (Ret.) Miguel Rodríguez Torres, who served as Mr. Maduro’s interior minister in 2013 and 2014. “The government is losing control.”
The embattled president needs to begin negotiating election dates now to avoid plunging the country into anarchy, he added.
https://www.wsj.com/articles/former-minister-warns-of-civil-war-in-venezuela-1494263279?tesla=y
Oil Production
Venezuelan production dropped by 30,500 bpd in January. They are now barley above two million bpd now. I doubt that any of this decline was intentional. Look for their decline to continue.
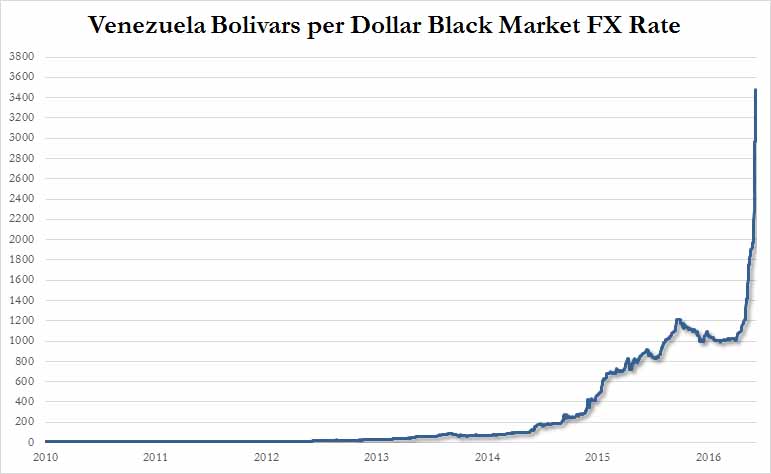
Hyper Inflation Currency
9. Read of the Day…It’s Not How Well You Invest, It’s How Long
by Marc Lichtenfeld, Chief Income Strategist, The Oxford ClubThursday, May 4, 2017
“Time is on my side, yes it is.”- Rolling Stones
With the market near all-time highs, it’s tough for some investors, especially new investors, to put money to work. “I’ll just wait for a pullback,” many people think.
And the pullback never comes. The market keeps hitting new highs, and the investor believes he or she has completely missed the opportunity to get in.
Most investors spend a lot of time and effort picking the right stock, fund or investment manager and fret over getting in at the perfect price. But they’re focusing on the wrong thing.
Instead, investors need to focus their energies on getting as much money into the market as early as possible.
For long-term investors, time is the most important element of investing success. Sure, picking some big winners and avoiding losers will help, but the longer investors have to allow their money to compound, the more cash they will end up with.
And each extra year that the money can be left alone to compound pays off in a very big way.
Consider…
If an investor invests $3,000 in the market each year for 40 years and achieves just a 6% annual return (nearly two percentage points below the historical average), the investor will wind up with $492,143.
That same investor who invests for only 30 years would need to achieve a 9.5% annual return, a point and a half above the historical market average and more than 50% higher than the 40-year investor.
Cut the time down to 25 years, and the investor needs to earn about 12.5% per year, more than 50% more than the market average: a very difficult task.
And if the investor has only 20 years in the market, she’ll need to earn 17.5% per year, more than double the market’s historical average: nearly impossible.
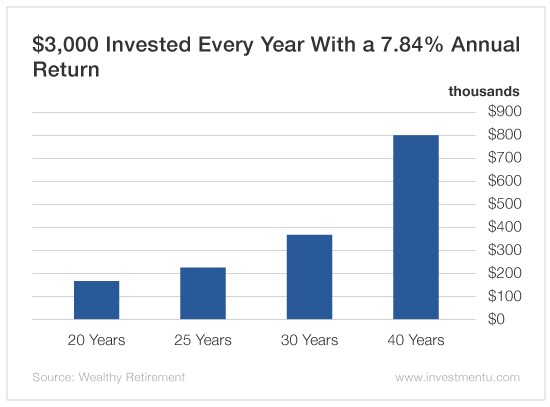
Let’s look at it another way. An investor puts $3,000 per year to work in the market and earns the S&P’s 50-year historical average of 7.84% (not including dividends).
The investor who saves $3,000 a year for 40 years and makes an average annual return of 7.84% will have $803,583. The 30-year investor has less than half that amount at $355,909.
Look at the difference those last 10 years made. That’s the power of compounding. If you can keep the money invested just 10 years longer, you make an additional $417,000.
If you’re investing for 25 years, you wind up with $231,056, and in 20 years, you finish with $145,451. Granted, if you’re saving for 40 years instead of 20, you’re contributing an extra $60,000, but the difference in the final amount is more than 10 times that $60,000 investment.
Now, I realize not everyone has 40 years to invest. But let’s take a look at the difference a few years can make.
Read Full Article
http://www.investmentu.com/article/detail/54655/time-is-on-my-side-compound-interest#.WRGdNFXyvIU
10.Three Ways to Grow Your Leadership Potential
An interview with Sue Ashford.
Posted May 07, 2017
Do you wish you had more leadership development opportunities at work? Are you tired of waiting for people to see your potential and tap you on the shoulder? If you could step into a leadership role right now, are you ready, willing and able?
Nearly 60% of companies are facing leadership talent shortages that is impeding their performance. Another 31% expect a lack of leadership talent to impede their performance in the next several years. And while spending on leadership development programs keeps rising, some suggest it isn’t providing the returns that are promised or needed and instead this crisis could be averted if people understood that leadership is a fundamental state anyone can demonstrate and not just a job title.
“Leadership is about influencing people and processes to accomplish a collective goal,” explained Professor Sue Ashford, a leading researcher on organizational management from the University of Michigan, when I interviewed her recently. “So you can develop your leadership potential no matter what your current role is, by considering how you can influence and contribute more to your organization.”
Sue suggests that leadership is partly a skill that can be developed by learning to be more inspirational, to set visions and to be people-focused. It’s also being willing to take risks and overcome the fear of getting this wrong, of projects failing and of your image taking a hit. And it’s a mindset to be open to learning from your experiences – the good, the bad and everything in between.
In fact, research indicates that leaders learn over 70 percent of the skills they need to be good leaders as they go through the ups and downs of developmental experiences on the job. And another 20 percent is learned from either observing role models or through interactions with others. And thus often the best leadership development opportunities come from your on-the-job experiences, rather than external courses that teach leadership concepts, frameworks and skills.
How can you best learn from your experiences?
“The biggest obstacle to learning on-the-job is that many of us are so busy, we’re mindlessly racing through tasks and missing out on the learning that could help you be an effective leader,” explained Sue. “While it’s unlikely you’ll ever be mindful of every moment, you can decide to approach your leadership experiences in a more mindful way to improve your performance.”
Sue suggests trying these three steps for mindful engagement:
· Prioritize a learning approach – Develop a growth mindset that allows you to approach your experiences as learning goals. Rather than focusing on proving yourself which has been found to undermine your learning opportunities and impair your potential for success.
Set explicit goals for learning development and leadership like: ‘‘learning how to set an effective vision or direction for a group,’’ ‘‘learning to be more persuasive,’’ and ‘‘learning how to share more of my authentic self.’’ Not only will this help to direct your attention from simply performing the task to gaining the new knowledge and skills you need to develop and exhibit, it will also help you assess and share your leadership development needs.
· Take action and experiment – Develop your leadership skills by playing with different actions to discover what does and doesn’t work for you, your team and your organization. For example, if you want to work on being more influential, you might try speaking first in the meeting, or you might try speaking last. You might try speaking softly so that everyone’s drawn in or speaking in a tone that doesn’t rise at the end in a question mark. The idea is to try different things so that you can discover what might help you better achieve your goal.
Keep seeking feedback by asking others how you can improve in specific areas. Far from making you look weak or insecure, Sue has found that in fact, your colleagues, manager and the people you manage are more likely to regard you favorably. Let people know you’re working on improving a particular skill, and you’d really value any thoughts they have on how you could do this better.
And try to keep your emotions in balance as you work to improve your performance. Be aware that while anxiety about your performance can get in the way of your learning, too many positive emotions can interfere with your ability to pay attention to important cues in your environment. Emotional regulation can help you help you to keep your emotions in a middle ground that is optimal for learning.
· Make time to reflect – Whilst many of us would rather be zapped by an electric shock, than left alone with our thoughts, to truly learn from your experiences you need make time to reflect on what happened and to learn from it. Studies have found leaders who engage in ‘after-action reviews’ (as detailed below) enjoy improved leadership ratings, more leadership opportunities and higher salaries.
To complete an ‘after-action review’ make time to capture a clear picture of what unfolded (try to separate out your biases as you do this), consider the “what-if” options that were available but weren’t taken and what impact these may have had, and then distill the lessons you learned. Try to identify new insights about effective leadership and identifying how these insights can be applied to improve performance in future situations.
How can you be practice more mindful engagement as a leader, no matter what your job title says?
https://www.psychologytoday.com/blog/functioning-flourishing/201705/three-ways-grow-your-leadership-potential