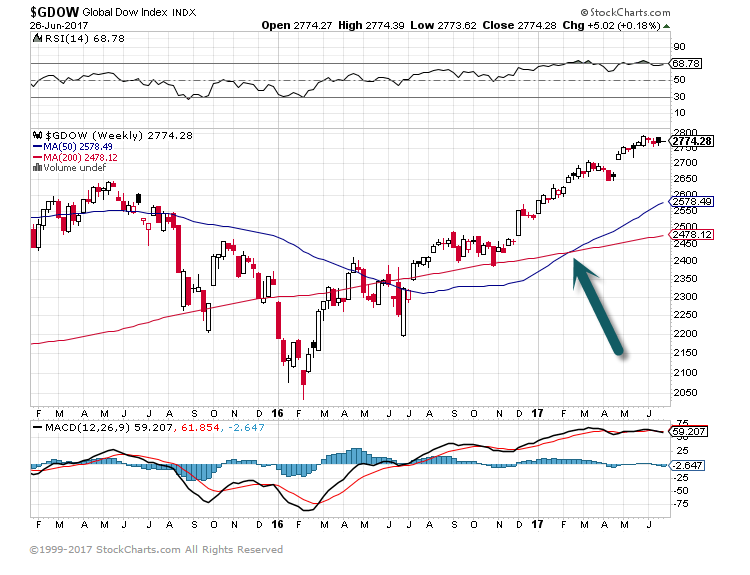
1.Global Dow Index Breaks Out to New All-Time Highs.
Proxy for Global Markets Breaks Out
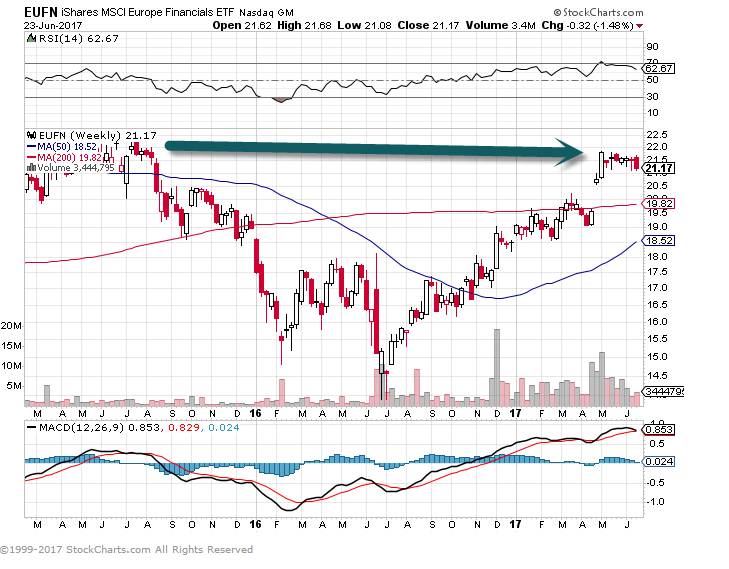
2.Watching to See if European Financials Break Out to New Highs.
EUFN-Euro Financials ETF….Hit Wall Near Previous Highs.
3.800 Smart Beta ETFs Now on Market….Someone is Betting Big on the Value Investing Comeback.
Hottest Smart Beta ETFs This Year
June 26, 2017
Smart beta is a very broad category, comprising some 800 different ETFs that set out to offer investors alternatives to the market-cap view of the world.
So far this year, these funds have attracted nearly $40 billion in assets under management (AUM), according to FactSet data.
We take a look at some of the most popular smart-beta ETFs this year.
Popularity Winner
The Vanguard Value Index Fund (VTV) is the most popular smart-beta ETF so far this year, seeing net inflows of $3.43 billion year-to-date.
The fund is the second-largest value ETF on the market today, with $32 billion in total AUM, behind only the $37 billion iShares Russell 1000 Value ETF (IWD), which has seen net creations of about $644 million so far in 2017.
The fund tracks an index from CRSP that relies on five different value metrics to evaluation components. VTV’s big upper hand over IWD is its price tag: 0.06% in expense ratio versus IWD’s 0.20%—that’s less than a third of the cost.
What’s amazing about VTV’s asset haul so far this year is that, first of all, no other smart-beta ETF has come even close to that asset gain. Secondly, value as a risk factor hasn’t really been performing that well in 2017. In fact, value has underperformed the broad market as well as growth, as the chart below plotting VTV against VOO and VUG shows.
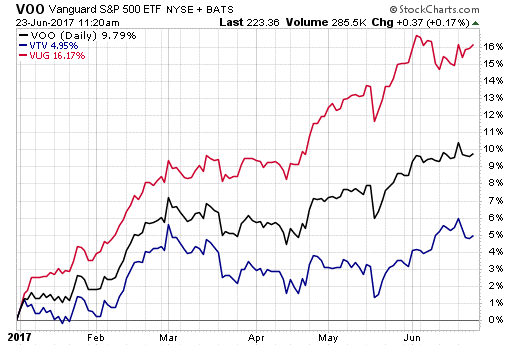
Perhaps VTV’s impressive asset haul is a testament to something that’s often said in investing circles: Value investors are patient investors, as they know capturing value takes time.
http://www.etf.com/sections/features-and-news/hottest-smart-beta-etfs-year
Vanguard Preps to Offer Actively Managed ETFs….Vanguard Entering Active ETF Game
What would happen if the second largest provider of ETFs, best known for low-cost index funds, entered the actively managed ETF market?
It’s a question that asset managers are probably asking since Vanguard in late May updated its filing with the Securities and Exchange Commission to offer actively managed ETFs.
4.One Billion in IP0’s This Week.
First Qt. IPO Activitiy.
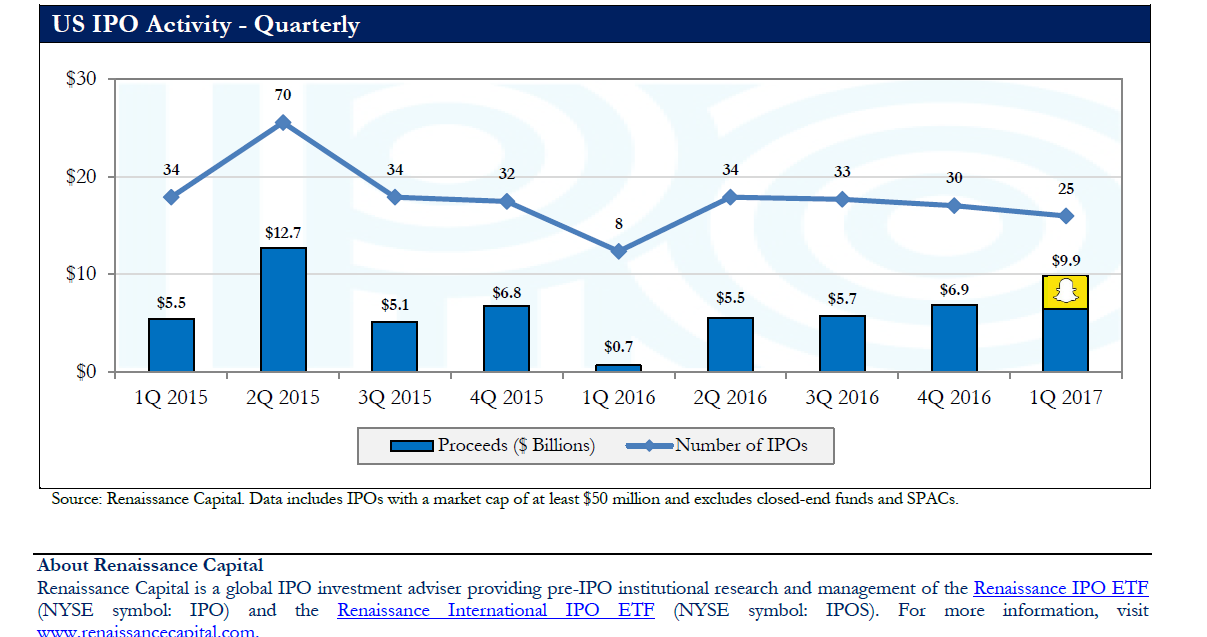
Get ready for the busiest IPO week so far this year
The initial public offering market is heating up over coming days, with 10 IPOs expected in what will be the busiest week so far this year, according to market intelligence firm Ipreo Capital Markets.
Leading the pack by deal size is the expected offering of meal-kit delivery service Blue Apron Holdings. APRN, +0.00% The company is expected to price Wednesday and raise up to $510 million, giving the company a public market capitalization of up to $3.2 billion.
See also: Blue Apron seeks IPO valuation boost despite Amazon-Whole Foods fears
Combined, the 10 IPOs, which are largely concentrated around health care, are expected to bring in about $1.1 billion if all price at the midpoint of their projected ranges. The health-care IPOs include Akcea Therapeutics, the second largest IPO of the group.It’s expected to price Thursday to raise up to $135 million.
So far this year, 69 IPOs have priced, according to Renaissance Capital, manager of an IPO-focused ETF. That tally is up 73% from the same time period last year. The majority have been in health care.
Outside of health care, Chicago bank Byline Bancorp Inc. BY, +0.00% is expected to bring in proceeds of up to $119.7 million.
Tintri Inc. TNTR, +0.00% , an enterprise cloud company, is expected to price Wednesday to raise up to $109 million if it prices at the high end of its range.
The rush of IPOs comes a week after the market debut of Altice USA Inc.ATUS, -1.17% , the second-largest IPO of the year. The cable company raised $1.9 billion, which put it behind Snap Inc. SNAP, -1.43% ‘s offering of $3.4 billion.
Before this week’s 10, the busiest IPO week of the year was April 23-29, which included online used car company Carvana Co. CVNA, +9.15% and Cloudera Inc.CLDR, -0.73% , according to Ipreo.
More from MarketWatch
http://www.marketwatch.com/story/get-ready-for-the-busiest-ipo-week-so-far-this-year-2017-06-26
5.No Secret that Private Equity has Seen Huge Cash Inflows……They Backed Half the IPOs in First Quarter.
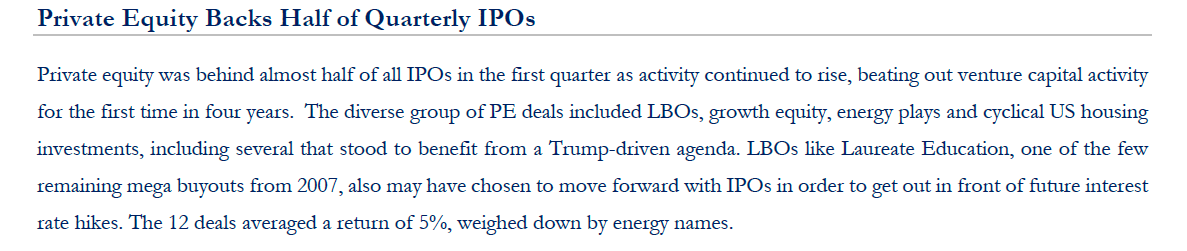
http://www.renaissancecapital.com/IPO-Center
6.The US dollar is falling out of favor with traders even with the Fed continuing to hike rates
David Scutt, Business Insider Australia
Reserve Board Chair Janet Yellen at a June 14 news conference after the Fed released its monetary policy decisions in Washington. REUTERS/Joshua Roberts
The US dollar is falling out of favor with currency traders, even with the US Federal Reserve continuing to lift interest rates.
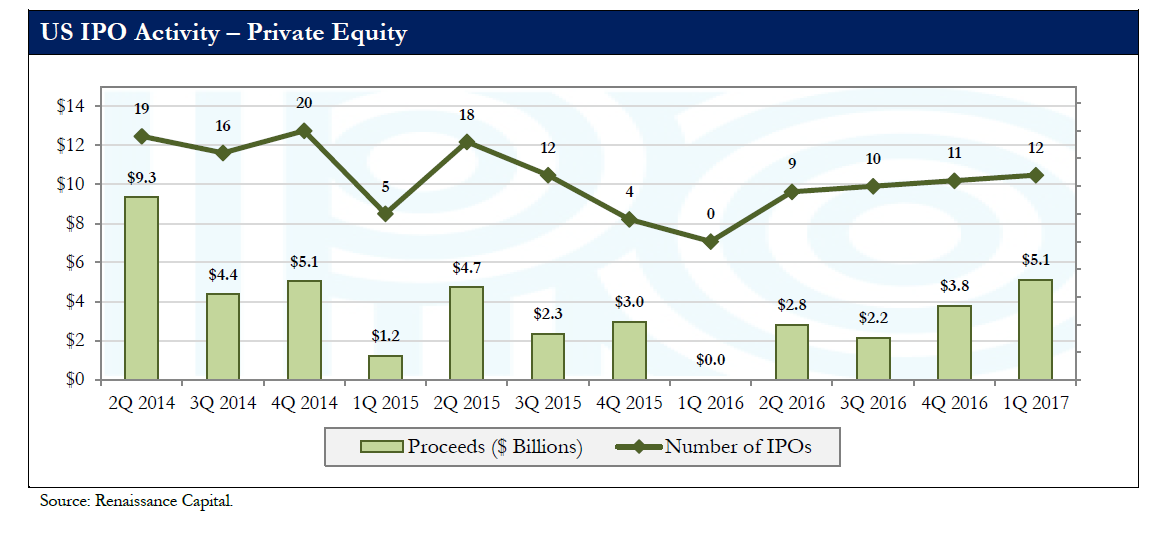
According to data released by the US Commodity Futures Trading Commission on Friday, net long speculative positioning in the greenback fell in late June for a fifth consecutive week, leaving it sitting at its lowest levels since September last year.
“Dollar selling was mostly broad-based except against the EUR,” said Khoon Goh and Rini Sen, strategists at ANZ Bank.
Goh and Sen said net long US dollar positions were reduced by $2.5 billion to $6.7 billion while net long positioning in the ICE US Dollar Index fell by $2.2 billion to $5.5 billion, leaving it sitting at a three-year low.
The US dollar index has lost 6.3% from the multiyear high of 103.82 struck January 3, undermined by doubts over the ability of the Trump administration to deliver wide-ranging tax cuts.
As seen in the chart below, those doubts, leading to sharply lower US Treasury yields, has seen long US dollar positioning among speculators fall sharply.
The continued decline in long positioning has come despite a 1% bounce in the US dollar index in the past couple of weeks, and it suggests that traders don’t think the move will become part of a longer-lasting trend, at least not yet.
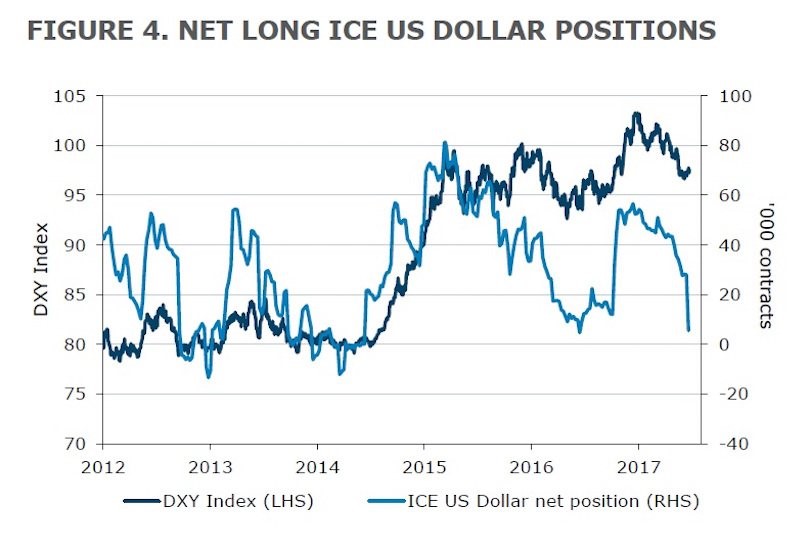
According to Goh and Sen, the continued reduction in long US dollar positioning was driven by renewed buying in the British pound and commodity currencies such as the Australian and New Zealand dollars.
“GBP saw net buying after three straight weeks of selling,” the pair wrote, adding that leveraged funds reduced their net short British pound positions by $500 million to $800 million.
“The surprise 5-3 decision to leave rates unchanged by the Bank of England (BoE) at their 15 June meeting, raising the possibility that the BoE could be the next major central bank to follow the Fed in hiking rates, likely spurred the GBP buying.”
And despite continued weakness in commodity prices, traders also stepped up their buying in the Australian and New Zealand dollars.
“Commodity currencies experienced net buying for the fourth consecutive week,” Goh and Sen said.
“Leveraged funds have turned net long AUD again following net buying of $US1.5 billion, while overall net long NZD positions rose to their highest level since February ahead of the 22 June Reserve Bank of New Zealand meeting.”
Of the other major currencies, net short positioning in the Japanese yen was reduced by $1.1 billion to $1.3 billion, while net positioning in the euro — after turning long for the first time in several years in the prior week — went short once again with net selling of $3.3 billion reported.
This chart from ANZ shows net speculative positioning in the US dollar against other major currencies.
Net positioning is simply the sum of long and short options and futures positions in a particular currency reported by the CFTC in its weekly Commitment of Traders report, released each Friday. When net positioning is short, it suggests the market is looking for price weakness. Long positioning indicates that the opposite outcome is expected.
To determine speculative positioning, ANZ uses noncommercial positions reported by the CFTC as they “seek to profit from movements in the asset price as opposed to hedging business activities.”
Read the original article on Business Insider Australia. Copyright 2017. Follow Business Insider Australia on Twitter.
http://www.businessinsider.com/us-dollar-falling-out-of-favor-with-traders-2017-6
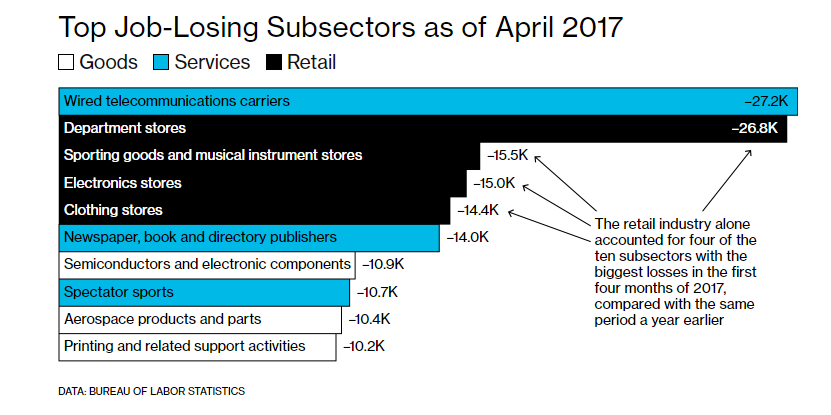
7.Top Job Losing Sectors 2017
Overall, services accounted for three-fourths of the job losses among more than 350 sectors of the private economy in the last year. That’s a big shift from previous decades, when goods-producing categories tended to suffer the most losses.
https://www.bloomberg.com/graphics/2017-jobs-automation-risk/
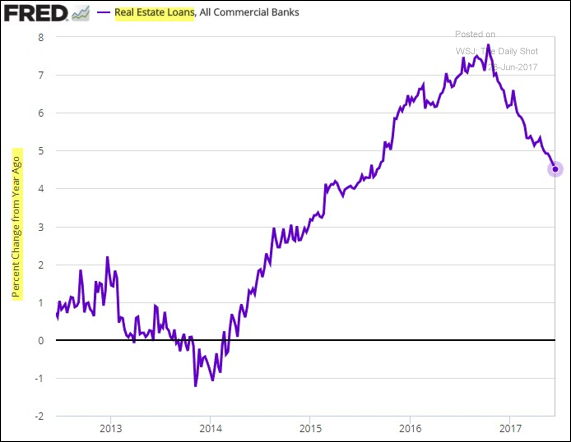
8.Follow Up to My Comments Regarding Multi-Family Housing Permits Falling 5 Quarters in a Row.
Source: The Wall Street Journal
Total real estate loan growth (commercial and residential) on banks’ balance sheets is a healthy 4.5% above last year’s level, but it has visibly slowed.
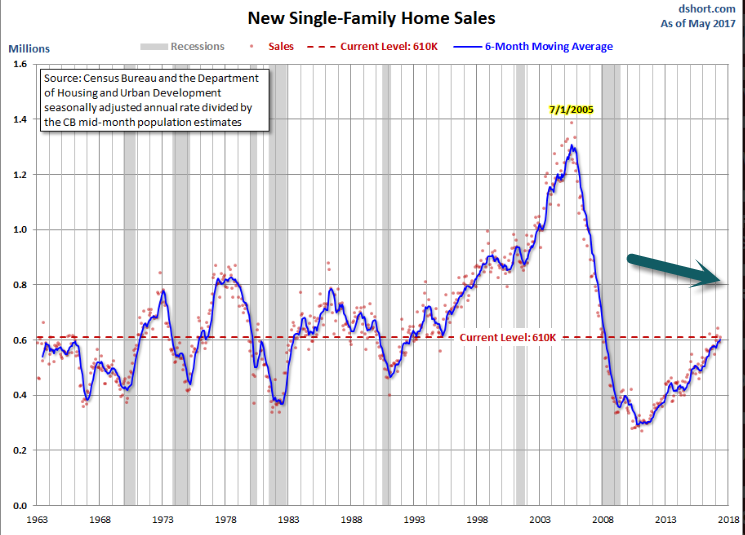
9.The Largest Generation Ever is Coming to New Home Sales in Next 5 Years.
Here is the opening from the report:
Sales of new single-family houses in May 2017 were at a seasonally adjusted annual rate of 610,000, according to estimates released jointly today by the U.S. Census Bureau and the Department of Housing and Urban Development. This is 2.9 percent (±13.0 percent)* above the revised April rate of 593,000 and is 8.9 percent (±21.9 percent)* above the May 2016 estimate of 560,000.
The median sales price of new houses sold in May 2017 was $345,800. The average sales price was $406,400. [Full Report]
For a longer-term perspective, here is a snapshot of the data series, which is produced in conjunction with the Department of Housing and Urban Development. The data since January 1963 is available in the St. Louis Fed’s FRED repository here. We’ve included a six-month moving average to highlight the trend in this highly volatile series.
https://www.advisorperspectives.com/dshort/updates/2017/06/23/may-new-home-sales-beat-expectations
10. 6 Reasons Salespeople Win or Lose a Sale
STEVEN MOORE FOR HBR
Why does a salesperson lose a sale?
It’s a question I’ve studied for years, as part of the win-loss analysis research I conduct.
There’s a tendency to assume that the salesperson lost because their product was inferior in some way. However, in the majority of interviews buyers rank all the feature sets of the competing products as being roughly equal. This suggests that other factors separate the winner from the losers.
In order to identify these hidden decision-making factors, more than 230 buyers completed a 76-part survey. The research project goals were to understand how customers perceive the salespeople they meet with, explore the circumstances that determine which vendor is selected, and learn how different company departments and vertical industries make buying decisions. We had six key research findings:
#1: Some Customers Want to be Challenged
What selling style do prospective buyers prefer? The survey shows 40% of study participants prefer a salesperson who listens, understands, and then matches their solution to solve a specific problem. Another 30% prefer a salesperson who earns their trust by making them feel comfortable, because they will take care of the customer’s long-term needs. Another 30% want a salesperson who challenges their thoughts and perceptions and then prescribes a solution that they may not have known about.
From a departmental perspective, under 20% of accounting and IT staffers want to be challenged, while 43% of the engineering department does. Over 50% of marketing and IT prefer a salesperson who will listen and match a solution to solve their specific needs. The sales department equally preferred having a salesperson listen and solve their needs and being challenged; HR was equally split across all three selling styles.
There’s an interesting explanation for selling styles preferences, which is based on whether the buyer is comfortable with conflict. Seventy-eight percent of participants who preferred a salesperson who would listen and solve their specific needs agreed with the statement: “I try to avoid conflict as much as I can.” Conversely, 64% of participants who preferred a salesperson who challenges their thoughts disagreed with the statement and are comfortable with conflict.
#2: It’s Really a Committee of One
Whenever a company makes a purchase decision that involves a team of people, factors including self-interests, politics, and group dynamics will influence the final decision. Tension, drama, and conflict are normal parts of group dynamics, because purchase decisions typically are not made unanimously.
One critical research finding is that 90% of study participants confirmed that there is always or usually one member of the evaluation committee who tries to influence and bully the decision their way. Moreover, this person is successful in getting the vendor they want selected 89% of the time. In practicality, it can be said that a salesperson doesn’t have to win over the entire selection committee, only the individual who dominates it.
#3: Market Leaders Have an Edge
In most industries a single company controls the market. Compared with their competitors, they have a much larger market share, top-of-the-line products, greater marketing budget and reach, and more company cachet. For salespeople who have to compete against these industry giants, life can be very intimidating indeed.
However, the study results provide some good news in this regard. Buyers aren’t necessarily fixated on the market leader and are more than willing to select second-tier competitors than one might expect. In fact, only 33% of participants indicated they prefer the most prestigious, best-known brand with the highest functionality and cost. Conversely, 63% said they would select a fairly well-known brand with 85% of the functionality at 80% of the cost. However, only 5% would select a relatively unknown brand with 75% of the functionality at 60% of the cost of the best-known brand.
Not surprisingly, the answer to this question differed by industry. The fashion and finance verticals had the highest propensity to select the best-known, top-of-the-line product, while manufacturing and health care had the lowest.
#4: Some Buyers Are “Price Immune”
Price plays an important role in every sales cycle. Since it is a frequent topic during buyer conversations, salespeople can become fixated on the price of their product and believe they have to be lowest. However, decision makers have different propensities to buy, and the importance of price falls into three categories. For “price conscious” buyers, product price is a top decision-making factor. For “price sensitive” buyers, product price is secondary to other decision-making factors such as functionality and vendor capability. For “price immune” buyers, price becomes an issue only when the solution they want is priced far more than the others being considered.
Study participants were asked to respond to different pricing scenarios, and their responses were analyzed to categorize their pricing tendency. From a departmental perspective, engineering would be classified as price immune; marketing and sales as price sensitive; and manufacturing, information technology, human resources, and accounting as price conscious. From an industry perspective, only the government sector would be classified as price immune. Banking, technology, and consulting would be price sensitive, while manufacturing, health care, real estate, and fashion are price conscious.
#5: It’s Possible to Cut Through Bureaucracy
The most feared enemy of salespeople today isn’t solely their archrivals; it’s buyers’ failure to make any decision. This is because every initiative and its associated expenditure is competing against all the other projects that are requesting funds. Do the departments have different abilities to push through their purchases and defeat their company’s bureaucratic tendency not to buy?
The answer is yes. Based on the research results, sales, IT, and engineering have more internal clout to push through their projects as opposed to accounting, human resources, and marketing. Therefore they’re better departments to sell into from the salesperson’s perspective.
#6: Charisma Sells in Certain Industries
Imagine three salespeople who’ve pitched products that are very similar in functionality and price. Which would you rather do business with:
- A) A professional salesperson who knows their product inside and out but is not necessarily someone you would consider befriending
- B) A friendly salesperson who is likable and proficient in explaining their product
- C) A charismatic salesperson who you truly enjoyed being with but is not the most knowledgeable about their product
While top selection in every industry was the friendly salesperson, the media and fashion industries selected “charismatic salesperson” more than most, and the manufacturing and health care industries had the highest percentage of “professional salesperson” responses.
Many salespeople behave as if buyers are rational decision makers. In reality, human nature is complicated, and a mix of factors — some rational, some not — determine how buyers evaluate sales reps and who they select. Ultimately, it is the mastery of the intangible, intuitive human element of the sales process that separates the winner from losers.
Steve W. Martin teaches sales strategy at the University of Southern California Marshall School of Business. His new book is titled Heavy Hitter I.T. Sales Strategy: Competitive Insights from Interviews with 1,000+ Key Information Technology Decision Makers.