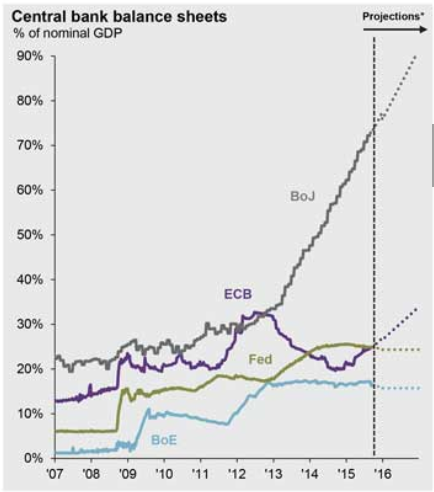
1.Global central banks have expanded their balance sheets to $19 trillion—about the size of the U.S. GDP—from about $3 trillion in 2000

http://globaleconomicanalysis.blogspot.com/2015/10/central-bank-balance-sheets-what-will.html
FED Balance Sheet and S&P Lock Step Since Crisis.

2.What to do When Both Stocks and Bonds are Expensive? The combined valuation of stocks and Treasuries is now richer than 99% of readings over the past 55 years.
Traditionally, investors might hedge their stock risk by buying government bonds, but that gets trickier when stocks and bonds are both expensive. Michael O’Rourke, JonesTrading’s chief market strategist, added up the Standard & Poor’s 500 earnings yield and the 10-year Treasury yield. That came to just 6.84%. He says the combined valuation of stocks and Treasuries is now richer than 99% of readings over the past 55 years.
http://www.barrons.com/articles/central-banks-dance-on-the-abyss-1498887887

3.Ultra-Low Rates has Driven Corporate Borrowing for Buybacks, Dividends and less so Capex.
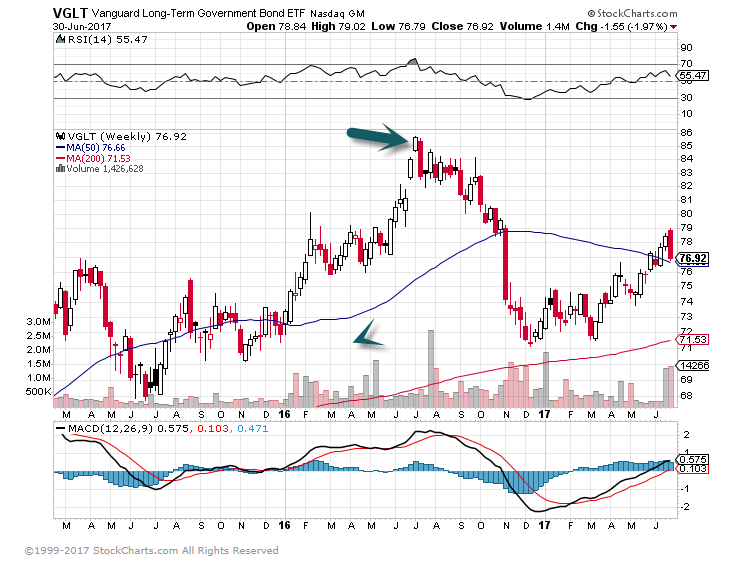
4.Watching Longer Term Bonds Selling Off for Sign of that Peak Quanitative Easing is Behind Us. This Will Increase Volatility Going Forward.
30 Year Treasury ETF hit all-time highs in mid-2016

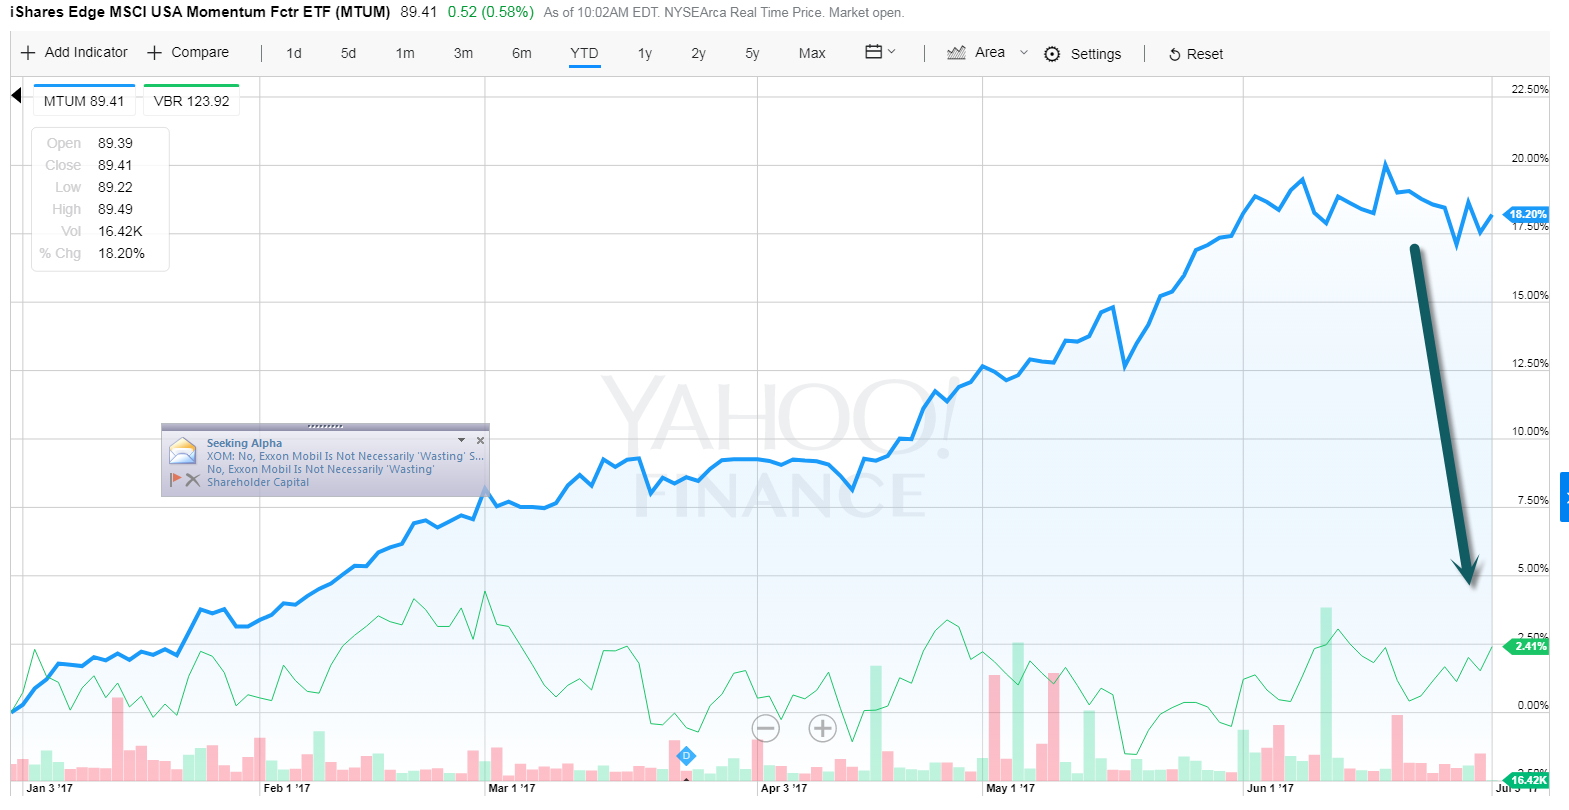
5.Momentum Crushing Small Cap Value in 2017.
2017 YTD—MTUM momentum ETF vs. VBR small cap value ETF
MTUM +18% vs. VBR +2.5%

6.When a Country’s Market is Doing Well…Always Check it’s Small Cap.
India Small Cap Almost a Double Since 2016 Pullback.
 7.As the Massive Adoption of Passive Continues….Two Iconic Mutual Fund Brand Names Have Highest 3 Year Outflows….Fidelity Contrafund and American Funds Growth Fund of America.
 2 Funds with Highest 3 Year Outflows.
#1 Fidelity Contrafund
Estimated three-year net outflow: $28.2 billion
Assets: $114.5 billion
Average annual three-year performance: 11.5%.
Contrafund, Fidelity’s flagship fund, hasn’t disappointed investors over the past three years. True, the fund lagged badly in 2016, but it has been on fire this year, gaining 17.3% through May, vs. 8.7% for the S&P 500. And the fund’s 0.68% expense ratio is well below the average actively managed fund. Unfortunately for Fidelity, Contrafund isn’t its only fund with good performance and big outflows: Fidelity Growth Company, up 14.5% a year the past three years, has seen $19.8 billion flee. And Fidelity Blue Chip Growth, up a blistering 20% this year, has shed $4.3 billion.
#2 American Funds Growth Fund of America
2. American Funds Growth Fund of America
Estimated three-year net outflow: $20.5 billion
Assets: $164.1 billion
Average annual three-year performance: 10.8%.
No one may have ever gotten fired for recommending the American funds, but the Growth Fund of America has gotten more than 20 billion sets of walking papers. The fund, up 12.5% this year, charges 0.66% in expenses for its A shares.
8.We are not as Divided as Advertised.
Nearly all Americans believe in open and fair elections, our system of checks and balances among the three branches of government, the right to protest, and the freedom to express unpopular views.
Even the media — a frequent target of the Trump administration — is viewed as very important by nearly two-thirds of Americans and as somewhat important by another 20%.

Even after a presidential campaign in which the eventual winner used the anti-immigrant slogan “build the wall” at his rallies, most Americans see newcomers as a good thing. The most recent iteration of the Pew Research Center’s survey showed 62% saying immigrants strengthen America and just 35% describing them as a burden.
Immigration was a central issue in the 2016 election, but Americans believe by a difference of almost 2-to-1 that immigrants make our country stronger.

Read Full story w more charts.
9. Read of the Day…Is Having a Smaller Stock Market Negative? 3500 Names vs. 7000 Names
Upon Further Review, Don’t Sweat the Small Stuff
After hearing from some investors and researchers, Jason Zweig isn’t so sure about his take in last week’s column
By
Jason Zweig
Biography
June 30, 2017 3:32 p.m. ET
How much should you care about the decline in the number of publicly traded companies?
The number of stocks has halved over the past two decades, to fewer than 3,600 from nearly 7,400, with most of the declines coming among the smallest companies.
That, I argued in a column last weekend, may be making it tougher for stock pickers to beat the market and for investors to forecast future returns from past data. Now, I’m not so sure. In the past few days I’ve heard from several leading investors and researchers who feel I got parts of that story wrong. There’s a lot that I, and you, can learn from their criticisms, mainly about the role that small companies play in the markets.
Ronen Israel, a partner at AQR Capital Management LLC, a firm in Greenwich, Conn., that manages more than $180 billion in assets, doesn’t think the decline in the number of small companies is a big deal.
“That part of the universe is so small,” says Mr. Israel, “that it doesn’t really affect most portfolio managers because they can’t invest there anyway.”
The 1,900 most minuscule companies combined are only 2% of the total value of the U.S. stock market, according to the Center for Research in Security Prices at the University of Chicago’s Booth School of Business.
Many such minnows have market values barely above $15 million, making them untouchable for the typical fund manager and unlikely to be a major factor in the performance of stock pickers, says Mr. Israel.
Or consider “factor investing,” which selects groups of stocks based on how big companies are, how much their shares fluctuate, how expensive they are relative to asset value and so on. Much of that underlying research is based on periods when twice as many stocks existed as today. Is it still valid?
So many of the stocks that disappeared were so small that they shouldn’t overly influence the results, says Mr. Israel, except in strategies that weight stocks equally rather than by size as most indexes do.
Larry Swedroe, director of research at Buckingham Asset Management LLC in St. Louis, points out that the performance of small stocks has been relatively consistent all the way back to 1926, regardless of how many there were.
https://www.wsj.com/articles/upon-further-review-dont-sweat-the-small-stuff-1498851145?tesla=y
10.Want to Get Better at Selling Others on Your Ideas? Learn How to Draw a Vision Map
Drawing a map will help people get from here to there.

By Ayse Birsel
CREDIT: Getty Images
Have you ever drawn a map to show someone how to get to your house? Or how to get from your house to the park or the corner store? If you have, you know how to draw, how to visualize, and communicate a path in time and space.
These are the very same skills you can apply if you are an entrepreneur who is trying to sell customers on a new product or service, or someone who helps others imagine the future. Draw a map to help people to get from here to there.
“When your goal is to describe a vision for the future, information is not enough. People are up to their necks in information. What they need is a way to imagine their life after the change, and compare it with their life today. That’s why it’s called a “vision” and not a “plan.” Marty Neumeier, author of The Designful Company
A vision map shows, economically, how to get from point A (where you are today) to B (where you want and need to get). You can write about it and you should. But if you want people to understand you quickly and intuitively draw it for them.
Now I know what you’re thinking, that you really can’t draw. But remember your drawing doesn’t need to be great. Who cares if the lines are crooked as long as it gives good directions. However, it does need to be drawn by you. Because when you draw your idea you create an abstraction in space and time. You show a path. And because only you know the path, you need to draw it for the rest of us.
Contrary to what you think, the ability to draw is not purely a talent. It is having a kit of visual symbols and icons. Again just like drawing a map. NYTimes Financial Writer Carl Richard’s napkin sketches are a great example. Alex Osterwalder, author of the Business Model Generation, is both a great visionary and visualizer as you can see on his Twitteraccount almost daily.
To help you draw I broke down my drawings into the visual symbols I most often use. Please feel free to try them out, borrow and adopt them.

Ayse’s Vision Drawing Alphabet:
Simple geometric shapes: Circle, square, rectangle, triangle, cube are simple shapes that can depict an area, a category.
1 circle with a word in it: Depicts something central to your idea or concept.
2 circles overlapping: Intersection of 2 ideas. The intersection is the “sweet spot.” This is my favorite way of showing dichotomy resolution.
3 circles overlapping: Intersection of 3 ideas or a trifecta.
2 lines at 90º to each other: A graph. I use this to show the relation of one thing to another over time.
2 lines intersecting in the middle: 4 quadrants. I use this to depict 4 quadrants of emotion, physical, intellect and spirit.
2 words and an arrow between them: One thing becoming something else. Arrows can also depict direction, movement or the future.
Infinity sign: I use this to show a continuous feedback loop, like “give and take”.
Equal/unequal symbols: When used between 2 words, they summarize how things are alike or dissimilar. Other math symbols, like +, x, < and >, are also useful.
A stick figure or a smiley: A person. As simple as it sounds, adding a person connects the idea to users and humanizes it.
A stick figure in a circle: Depicts being user-centered.
Circle with a diagonal line over a word/symbol: Something that is banned or unwanted.
Simple icons: Heart for emotion, ying and yang for spirit, dollar sign for money, messy scribble for complication…
Throw some of these together to express one of your ideas. Put it on Twitter. Email it to your colleague. Draw it on a white board. You will see that a picture is worth a thousand words.
If you already draw to sell your vision, I would love to hear from you and learn about your drawing tool kit.
https://www.inc.com/ayse-birsel/if-your-job-is-to-map-the-future-you-need-to-draw.html?cid=hmside1
Design the vision you love, by drawing.
