1.March Madness…Highest Monthly Return Month for 10 Years.
March is known for many things, from spring training, to the NCAA tournament, to spring flowers, to consistent equity gains? That’s right, over the past 10 years, there hasn’t been a month for the S&P 500 with a higher average monthly return than March.
“When the first two months of the year have been higher, March has closed higher 19 of 26 times (73.1%) and has been up an average of 1.4%” – “The S&P 500 is set to close up four consecutive months once February is in the books. When the S&P 500 has been up four or more months heading into March, then March actually has become stronger, as since 1950, it has closed higher 11 of 13 times (84.6%) with an average return of 2.3%.” noted LPL
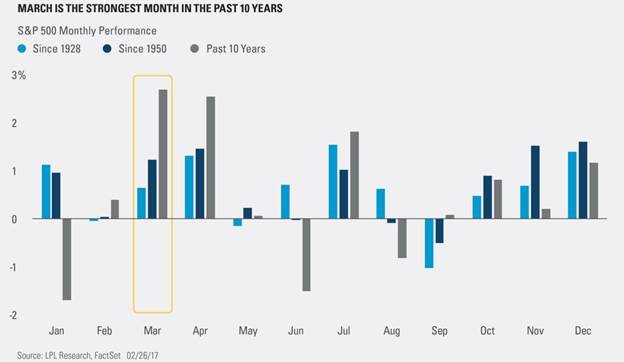
Thanks to Dave Lutz at Jones for Chart.
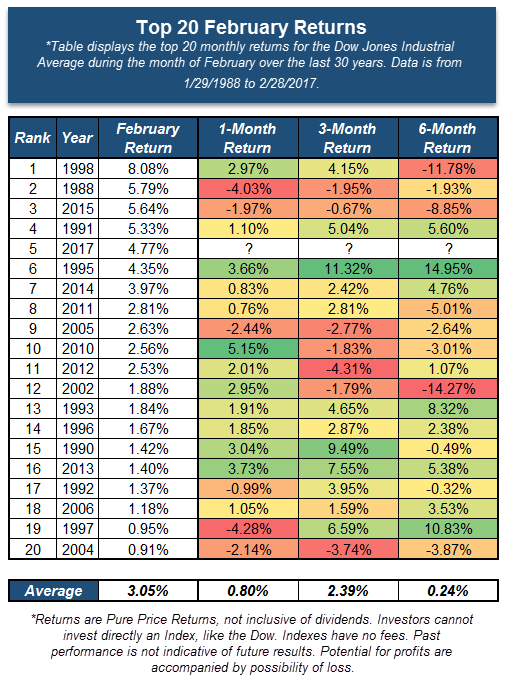
2.Top February Returns….2017 #5.
With Wednesday’s action, the Dow Jones Industrial Average DJIA rallied above the $21,000 level for the first time ever. Although this is a very noteworthy occurrence it would have not occurred this soon if it were not for the positive return for the Index that we saw during February. With the close on February 28th, the Dow gained 4.77% for the month, which is the 5th best February return in the last 30 years. February 1998 holds the top spot on our list as the Dow gained 8.08%, followed by 1988 in which the Dow gained 5.79%. The only year during this decade that betters the 2017 February return is 2015, when DJIA gained 5.64%. Interestingly enough, eight years from the list occurred during the 1990s and the average return for February during those eight years was 3.13%. For perspective on how the Dow traded after these February dates we looked 1, 3, and 6 months following the February of the particular year. Altogether, the results were somewhat mixed, but on average we do see that the market moves higher in the 1, 3, and 6 months following. On average, the 3-months following these February dates offers the best return, so keep an eye out on the how the market moves following this May.
3. Has Europe Bottomed? Fund Flows Lagging Market and Economic Data.
The Eurozone: This chart shows European fund flows lagging the economic surprise index due to political risks. Will things normalize after the elections across major European economies? A bull case for European stocks?
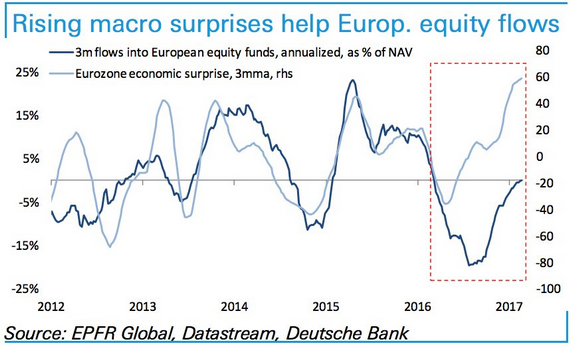
www.thedailyshot.com
4.Ten Year Treasury Yield Up Over 100% From 2016 Lows.
U.S. Ten Year Yield
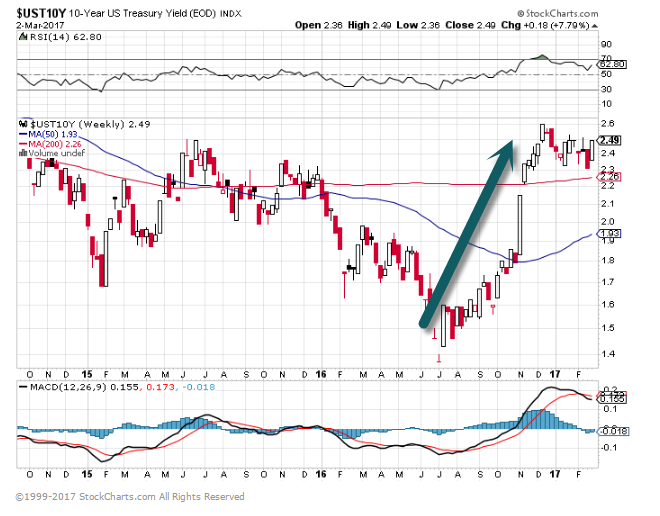
At 1:30 p.m. ET, the yield on the benchmark 10-year note reached 2.5%. It briefly touched that level on February 15 and got very close on February 3, before falling back each time.
Thomas Byrne of Wealth Strategies & Management notes that lately, buyers rush in whenever the 10-year yield reaches the 2.5% level. U.S. Treasury yields are still far more attractive than foreign debt. He believes demand for safe yields from baby boomers, insurance companies and pension funds will keep a lid on rates.
He wrote to Barron’s as the 10-year yield approached the 2.5% level:
The 10-year yield is flirting with the top of its range, even as wages, inflation and now oil prices, remain tame. Let’s see of demand pours in if it gets above 2.50%. Traders might let it run and whipsaw investors somewhere between 2.55% and 2.60%. If it gets through 2.60%, 2.70% could be the next stop, but I believe money will flow in before that happened.
5.Intereting Look at Economic Data Today vs. 1999
“Even though current valuation measures are not as extreme as in 1999, today’s economic underpinnings are not as robust as they were then,” he wrote. “Such perspective allows for a unique quantification, a comparison of valuations and economic activity, to show that today’s P/E ratio might be more overvalued than those observed in 1999.
In this chart, Lebowitz stacks up the metrics from the years running up to the dot-com explosion versus what we’ve seen since 2012:
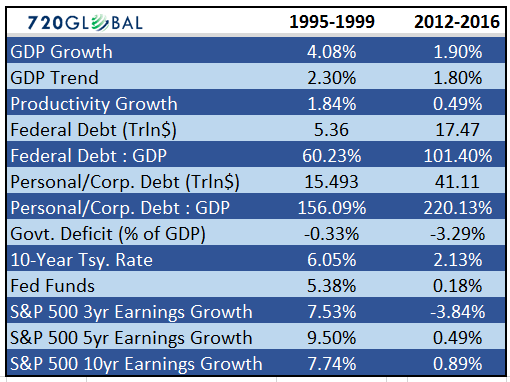
http://www.marketwatch.com/story/stop-this-is-not-like-the-dot-com-bubble-its-much-worse-according-to-this-chart-2017-03-02
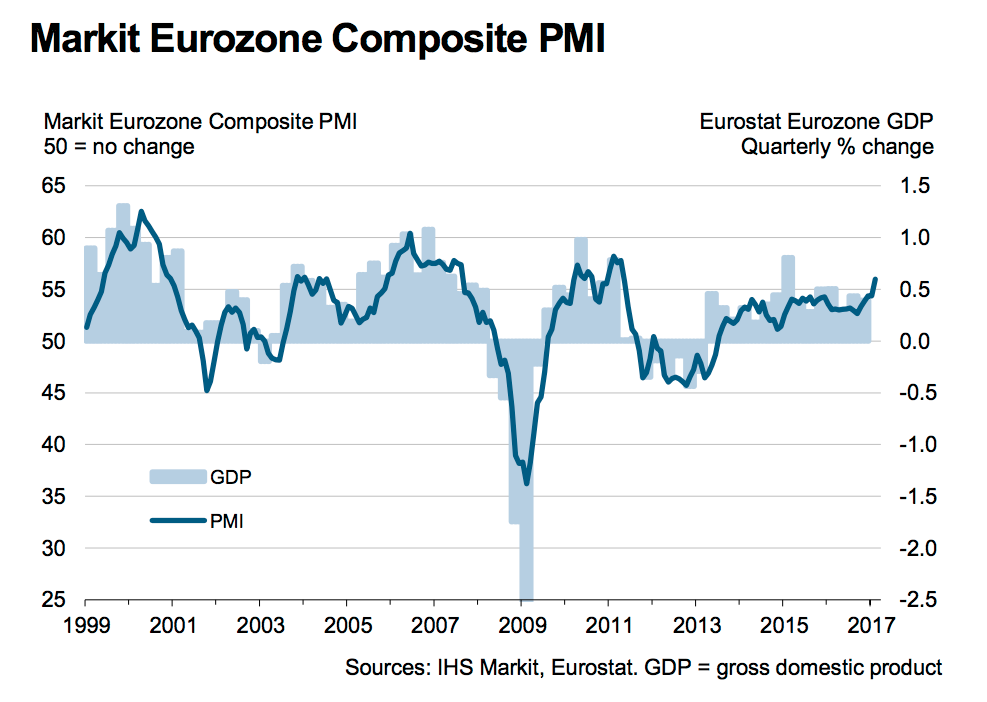
6.Follow up to Yesterday’s Comments on Europe….Growth at 6 Year Highs.
“Growth of eurozone economic output accelerated to a near six-year record in February,” IHS Markit said in a release.
“Output growth was led by the manufacturing sector. Improved inflows of total new orders and new export business drove the rate of expansion in manufacturing production to its highest since April 2011.”
Here is the full scoreboard of PMIs released on Friday:
- Services PMI— 55.5 (flash estimate 55.6)
- Composite PMI— 56 (flash estimate 56)
And here is the chart showing the long-term trend:
Here’s how the continent’s largest economies performed:
- French services — 4 (flash estimate 56.7)
- French composite —9 (flash estimate 56.2)
- German services — 4 (flash estimate 54.4)
- German composite — 1 (flash estimate 56.1)
https://www.markiteconomics.com/Survey/PressRelease.mvc/c0e2ebbc4eed4d419b0e5c99f94bc153
http://www.businessinsider.com/ihs-markit-european-pmis-for-february-2017-2017-3
7.With All The Headlines About New Highs and Trump Rally….Emerging Markets Outperforming YTD.
EEM Outperforming S&P….India Leading EEM Markets.
INDA-India ETF
EEM-Emerging Market ETF
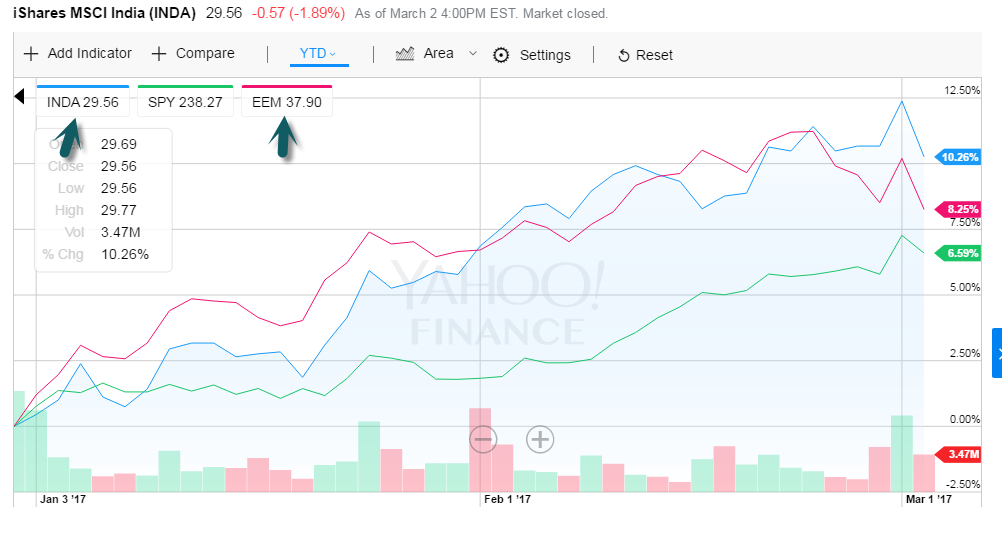
http://finance.yahoo.com/quote/INDA?p=INDA
8.$74 Trillion Global Economy…The U.S. and China are Huge on GDP Map.
March 1, 2017 9:00am by Barry Ritholtz
Fascinating depiction of the global economy, broken down by geographic region. Each country’s is sized according to their percentage of global GDP output. (GDP data is via the World Bank, effective February 2017).
South America is much smaller than I expected, as is China (still). Amazing that US is about the same size of Europe.
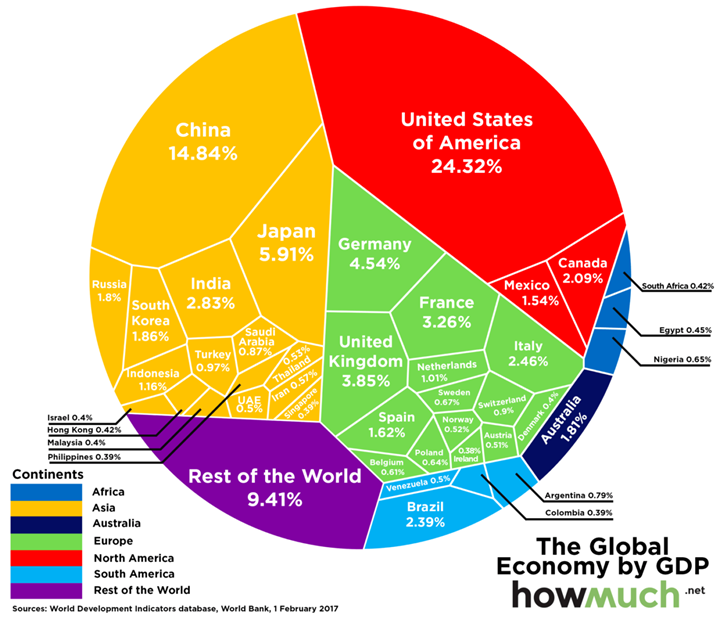
From Barry Ritholtz The Big Picture
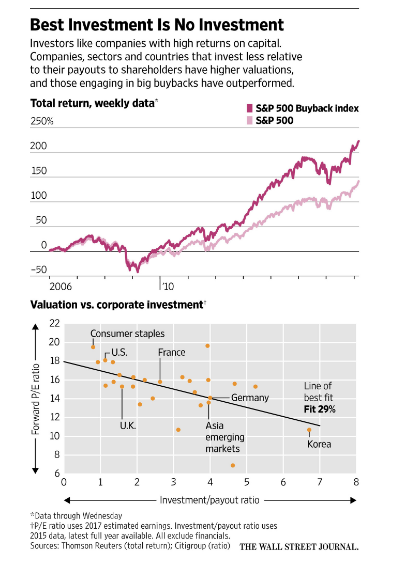
9.Read of the Day….Streetwise WSJ James Mackintosh on Buybacks.
Are shortsighted managers underinvesting in the American economy because they want to line the pockets of investors through share buybacks?
Yes, says the world’s biggest fund manager: American capitalism needs to be fixed. No, says the world’s most successful investor, good projects aren’t dying for lack of financing.
Larry Fink, BlackRock Inc.’s chairman and chief executive, and Warren Buffett, Berkshire Hathaway Inc.’s chairman, personify a debate vital to investors and voters. If managers are ignoring profitable opportunities because of short-term shareholders or badly-designed incentives, a better approach could boost both share prices and economic growth. Bringing back corporate cash trapped overseas, part of the aim of Donald Trump’s tax plans, could then support further investment.
If everything’s dandy with corporate management, the blame for slow growth lies elsewhere. Companies bringing cash home to the U.S. won’t have new projects to invest in, so it’s likely to be spent on yet more buybacks.
Mr. Fink warned against the “furious pace” of buybacks in his annual letter to CEOs earlier this year. “We believe companies must balance those practices with investment in future growth,” he said.
Mr. Buffett shot back last weekend in his letter to shareholders, saying companies and investors are “awash” in cash and constantly scouting for opportunities. “I’m not aware of any enticing project that in recent years has died for lack of capital,” he wrote. “Call us if you have a candidate.” In other words, capitalism and the market are doing their job of directing money to where it can best be used.
The issue of buybacks is really a puzzle about stock valuations and profits. Profit margins are high and stocks are worth far more than it would cost to replace all corporate assets.
https://www.wsj.com/articles/whos-right-warren-buffett-or-larry-fink-1488472177?tesla=y
10.Burned Out? Why Energy Management is the Key to Resilience
Why living life in the fast lane can slow you down, and what to do instead.

Why are we always exhausted at the end of a workday? Why do we come home wiped out, with barely enough energy to make dinner before collapsing for the night?
Normally, when we think about being tired, we think of physical reasons: lack of sleep, intense exercise, or long days of physical labor. And yet, as Elliot Berkman, professor of psychology at the University of Oregon, pointed out to me in an interview, in our day and age, when few of us have physically demanding jobs, we are wiping ourselves out through psychological factors.
After all, the physical effort we exert in our day jobs does not warrant the fatigue we experience when we get home. If you are a construction worker, a farmer toiling in a field, or a medical resident working both day and night shifts, then yes, physical exhaustion might be the reason for your fatigue. But otherwise, Berkman points out, your fatigue is mostly psychological. “Does your body get tired until you really can’t do anything at all?” asks Berkman. “Actually, it would take a long time to get to that point of complete physical exhaustion.”
One of the main reasons for our mental exhaustion is high-intensity emotions.
One way psychologists distinguish emotions is along two dimensions: positive/negative and high intensity/low intensity. In other words, is the emotion positive (like elated or serene) or negative (like angry or sad)? And is it high intensity (like elated or angry) or low intensity (like serene or sad)?
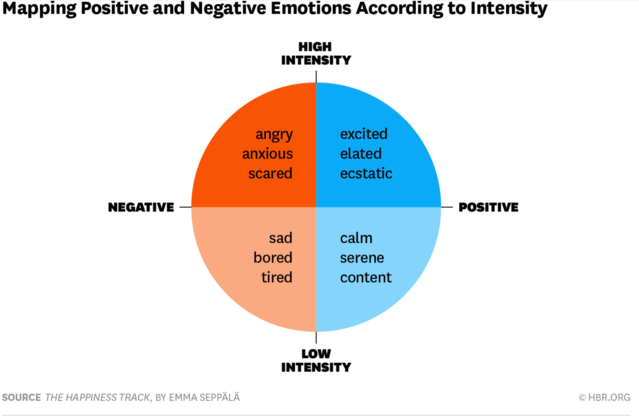
Source: HarperOne/HBR
It’s easy to see how high-intensity negative emotions might wear us out during the course of the day — and not just frustration and anger. Many of us have come to rely on our stress response to get things done. We fuel ourselves up with adrenaline and caffeine, over-scheduling ourselves and waiting until the very last minute to complete projects, waiting for that “fight or flight” mode to kick in and believing we need a certain amount of stress to be productive.
But high-intensity positive emotions can also be taxing. And research shows that we — especially Westerners, and Americans in particular — thrive on high-intensity positive emotions. Research by Jeanne Tsai of Stanford University, with whom I conducted several studies, shows that when you ask Americans how they would ideally like to feel, they are more likely to cite high-intensity positive emotions like elated and euphoric than low-intensity positive emotions like relaxed or content. In other words, Americans equate happiness with high intensity. East Asian cultures, on the other hand, value low-intensity positive emotions like serenity and peacefulness.
When Jeanne and I ran a study to figure out why Americans value high-intensity positive emotions, we found that Americans believe they need high-intensity emotions to succeed — especially to lead or influence. In a study we ran, for example, people wanted to feel high-intensity positive emotions like excitement when they were in a role that involved leading or trying to influence another person. This intensity is reflected in the language we use to discuss achievement goals: we get fired up, pumped, or amped up so that we can bowl people over, crush projects, or crank out presentations — these expressions all imply that we need to be in some kind of intense attack mode. Go get it, knock it out of the park, and muscle through.
The problem, however, is that high-intensity emotions are physiologically taxing. Excitement, even when it is fun, involves what psychologists call “physiological arousal” — activation of our sympathetic (fight-or-flight) system. High-intensity positive emotions involve some of the same physiological responses as high-intensity negative emotions like anxiety or anger. Our heart rate increases, our sweat glands activate, and we startle easily. Because it activates the body’s stress response, excitement can deplete our system when sustained over longer periods — chronic stress compromises our immunity, memory, and attention span. In other words, high intensity — whether it’s from negative states like anxiety or positive states like excitement — taxes the body.
High-intensity emotions are also mentally taxing. It’s hard to focus when we’re physiologically aroused and overstimulated. We know from brain-imaging research that when we’re feeling intense emotions, the amygdala is activated – that’s the same region that lights up when we’re feeling a fight-or-flight response. We need to use effort and emotion-regulation strategies from a different part of our brain, located in the prefrontal cortex, to calm ourselves enough to get our work done. This emotion regulation itself requires additional effort.
The result? You tire easily. Whether you’re getting amped up with anxiety or with excitement, you are draining yourself of your most important resource: energy.
Excitement, of course, can be a positive emotion and it certainly feels a lot better than stress. But just as a sugar high may feel great for a while, it sends your body into a physiological high that can end with a crash. You are bound to feel tired sooner than if you had remained in a calm state.
This isn’t to say you should never feel stressed or excited — nor should you lose your enthusiasm for your work. However, I’m suggesting you make more time for calm activities in your life and learn to tap into that other side of your nervous system — the parasympathetic “rest and digest” side, that helps restore your health and your well-being, making you more resilient over the long run. Doing so will help you save your energy for when you need it most.
This article is based on my book The Happiness Track (HarperOne, 2016) from which it is adapted with the publisher’s permissi