1.Positive Returns During January and February
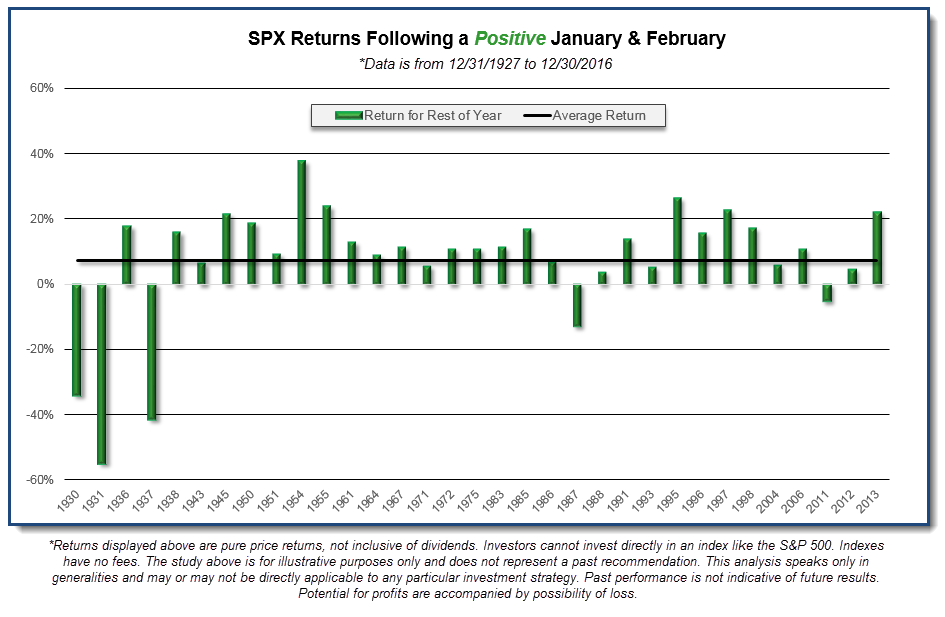
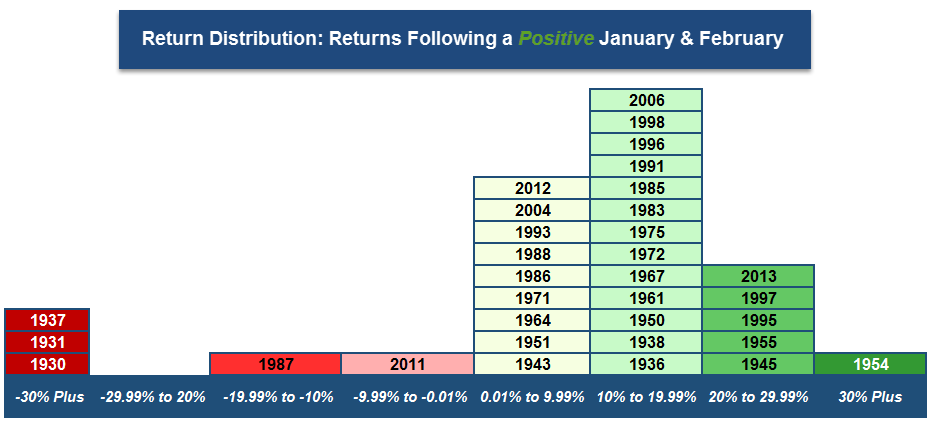
The images below show a bell curve and bar chart of the SPX returns for the remainder of the year (March – December) when both January and February returns were positive. As we can see from both images, the market tends to finish in positive territory for the remainder of the year as well, though there are a few exceptions. Here are some statistics from our findings:
· During the years where January and February were both positive the combined months average return was 7.40% (out of 33 occurrences). In 2017, the SPX was up 5.57% from 12/30/2016 to 2/28/2017.
· The remainder of the year (March – December) the SPX was up an average of 7.37%.
· Out of the 33 occurrences, 28 occurrences were positive (84.85%) and 5 were negative (15.15%).
· Average return for just the 28 positive occurrences was 14.01%.
· Of the five negative occurrences, three of them date back to the 1930’s. The two other negative occurrences were 1987, which saw the SPX fall -13.06% from March thru December (largely due to the October crash), and 2011, when the SPX finished down -5.24% from March to December.
 From Dorsey Wright
https://oxlive.dorseywright.com/research/bigwire/
2.We Know About Streak Without 1% Pullback….How About 1.5%?
Chart o’ the Day: Longest Streak in 53 Years
Posted March 1, 2017 by Joshua M Brown
Save Up to $1,500 on Commissions with TradeStation. Open an Account.
Jon Krinsky at MKM Partners shares an amazing stat on the S&P 500’s recent proximity to the all-time highs:
By now, most participants are aware that the S&P 500 hasn’t had a 1% down day since October 12th, or 94 consecutive trading days. That ties the streak from 2006. Barring a 1% down day today, this will be the longest such streak since 1995. Yet in many ways, a single 1% down day is irrelevant. For instance, two consecutive down days of 0.90% would be a much bigger drawdown than a single 1% down day. To get a better view of impact to a portfolio, we looked at the maximum SPX drawdown from a 52-week high (closing basis) going back to 1960.
Remarkably, the SPX has gone 74 trading days without a 1.5% drawdown from the 52-week high. That is the longest such streak since 1964 (126 trading days), and the second longest streak since 1960. Recently there was a streak of 72 days that ended on 7/30/14, and there was also a streak that ended at 72 days on 5/17/95. Outside of those, there was a 60 day streak that ended almost exactly ten years ago on 2/26/07.
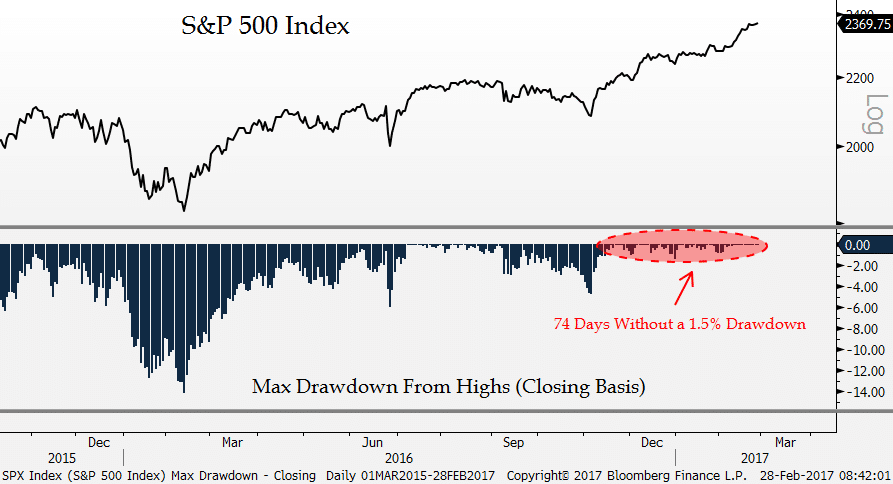
Jon’s takeaway is the right one – vol cannot be contained forever, but the length of time that could pass before it comes back can and will amaze even veteran traders.
Source:
74 days without a 1.5% drawdown… longest streak in 53 years
MKM Partners – February 28th 2017
From Josh Brown Blog.
3.ETFs Approaching $3 Trillion….EEM Emerging Market ETF Takes in 18% of Total Assets in 2 Months.
INTO ETFS– Investors poured $62.9 billion into exchange-traded funds in February, pushing the year-to-date world-wide tally to $124 billion, the fastest start of any year in the history of the ETF industry, according to data from BlackRock Inc. U.S. ETFs accounted for $44 billion of that, pushing assets in U.S. funds to almost $2.8 trillion. The fastest-growing ETF so far this year is the iShares Core Emerging Markets ETF, which took in $4.2 billion in the first two months of the year, 18% of its assets
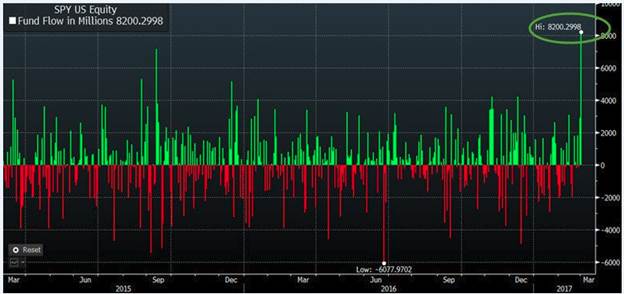
SPY took in $8.2b Wednesday, The most in over 2 yrs – Great chart from Bloomberg
Thanks to Dave Lutz at Jones for information
4.The Mergers Will Continue…..Aberdeen $32B Outflows and Standard Life $2.6B in Outflows 2016 in Talks to Merge.
Aberdeen, Standard Life in $13.5 bln merger talks
Published: Mar 4, 2017 1:37 p.m. ET
By
BENDUMMETT
LONDON– Aberdeen Asset Management PLC and Standard Life PLC are in talks over a merger that would create one of the U.K.’s biggest asset managers, worth more than GBP11 billion ($13.5 billion), according to people familiar with the matter.
Such a deal would mark the latest attempt to consolidate by fund companies that focus on stock and bond picking, facing mounting competition from low-cost fund providers such as Vanguard Group and BlackRock Inc.
In October, the U.K.’s Henderson Group PLC agreed to acquire U.S. rival Janus Capital Group Inc. for GBP2.01 billion, betting that the combination would boost revenue by expanding the firms’ global distribution of equity and bond funds, and generate annualized cost savings of $110 million.
A combination of Aberdeen and Standard Life would oversee a total of GBP571.7 billion held across a range of asset classes, including equities and fixed income.
The merger talks are advanced but could still break down, one person said. Representatives of Aberdeen and Standard Life couldn’t immediately be reached for comment. News of the talks was first reported by Sky News.
For the year ended Sept. 30, 2016, Aberdeen posted net outflows of GBP32.8 billion, along with declining year-over-year revenue and profit.
Standard Life reported net outflows of GBP2.6 billion last year. It saw a big drop in inflows at its highly successful Global Absolute Return Strategies fund.
The push to consider a merger comes as the industry faces higher costs and regulatory burdens at the same time that passive investments are taking away assets.
Of the $533 billion of net flows into all mutual funds and exchange-traded funds last year, 54%, or $289 billion, went to funds managed by U.S. index money manager Vanguard Group, according to research firm Morningstar.
Write to Ben Dummett at ben.dummett@wsj.com
http://www.marketwatch.com/story/aberdeen-standard-life-in-135-bln-merger-talks-2017-03-04
5.An IPO is Coming Bigger than SNAP…..Saudi Aramco’s IPO $1Trillion for 5%
Investors expect Saudi Aramco’s IPO to value it at as much as $1 trillion less than Saudi officials hope
DUBAI, (Reuters) – Fund managers and institutional investors expect oil giant Saudi Aramco to have a market capitalisation of $1 trillion to $1.5 trillion when it sells shares to the public next year, a survey by regional investment bank EFG Hermes showed on Monday.
The valuation of Aramco, the world’s biggest oil firm, has been the focus of intense speculation since the Saudi government last year announced plans to sell up to 5 percent of it and list the shares in Riyadh and at least one foreign stock exchange.
Deputy Crown Prince Mohammed bin Salman, who oversees the kingdom’s economic policy, has said the sale is expected to value Aramco at $2 trillion or more, making it by the far the world’s largest initial public offer.
http://www.businessinsider.com/investors-expect-saudi-aramco-ipo-to-value-at-one-trillion-2017-3
U.S. crude stockpiles have increased for eight straight weeks, hitting a record 520 million barrels in the week ended Friday

U.S. crude stockpiles have increased for eight straight weeks, hitting a record 520 million barrels in the week ended Friday
6.Aerospace and Defense Outperforming Under Trump.
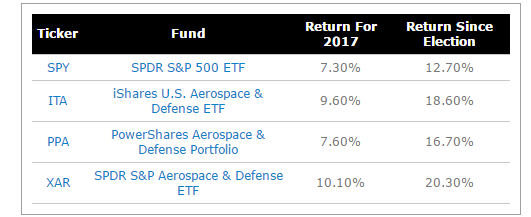
The $2.5 billion iShares U.S. Aerospace & Defense ETF (ITA), which holds a market-cap-weighted basket of stocks in the industry, gained 18.6% since Nov. 8, outpacing the 12.8% return for the S&P 500 in the same time frame.
ITA, like other similar ETFs, tracks “aerospace & defense” firms, which are a subgroup under the broader industrials sector. A full 88% of ITA’s portfolio is allocated to firms within this group. Top holdings include Boeing, United Technologies and Lockheed Martin. Together, these names make up more than a quarter of the fund’s holdings.
The two other big U.S. defense-focused ETFs on the market― the equal-weighted SPDR S&P Aerospace & Defense ETF (XAR) and the cap-weighted PowerShares Aerospace & Defense Portfolio (PPA)―also outperformed, with returns of 20.3% and 16.7%, respectively, since the election. Both funds have about $515 million in assets.
http://www.etf.com/sections/features-and-news/trump-revs-defense-etfs-military-budget-plan/page/0/1
ITA-Aerospace and Defense ETF—Largest Sub-Sector ETF.

7.Start-Ups 7-8% of U.S. Companies Down from 12-13%


http://money.cnn.com/2016/09/08/news/economy/us-startups-near-40-year-low/
The Disturbing New Facts About American Capitalism
New research suggests U.S. companies are moving toward a winner-take-all system in which giants get stronger, not weaker, as they expand
By
JASON ZWEIG
New research by economists Gustavo Grullon of Rice University, Yelena Larkin of York University and Roni Michaely of Cornell University argues that U.S. companies are moving toward a winner-take-all system in which giants get stronger, not weaker, as they expand.
That’s the latest among several recent studies by economists working independently, all arriving at similar findings: A few “superstar firms” have grown to dominate their industries, crowding out competitors and controlling markets to a degree not seen in many decades.
Let’s look beyond such obvious winner-take-all examples as Apple or Alphabet, the parent of Google.
Consider real-estate services. In 1997, according to Profs. Grullon, Larkin and Michaely, that sector had 42 publicly traded companies; the four largest generated 49% of the group’s total revenue. By 2014, only 20 public firms were left, and the top four— CBRE Group, Jones Lang LaSalle, Realogy Holdings and Wyndham Worldwide—commanded 78% of the group’s combined revenue.
Or look at supermarkets. In 1997, there were 36 publicly traded companies in that industry, with the top four accounting for more than half of total sales. By 2014, only 11 were left. The top four—Kroger, Supervalu, Whole Foods Market and Roundy’s (since acquired by Kroger)—held 89% of the pie.
The U.S. had more than 7,000 public companies 20 years ago, the professors say; nowadays, it’s fewer than 4,000.
The winners are also grabbing most of the profits, according to the Leuthold Group, an investment-research and asset-management firm in Minneapolis.
https://www.wsj.com/articles/the-disturbing-new-facts-about-american-capitalism-1488580706?tesla=y
8.The boom in rents may finally be over
· Bill McBride, Calculated Risk Blog
Note: This is an update to a post I wrote in 2015.
It was almost 7 years ago that we started discussing the turnaround for apartments. Then, in January 2011, I attended the NMHC Apartment Strategies Conference in Palm Springs, and the atmosphere was very positive .
The drivers in 2011 were 1) very low new supply for apartments, and 2) strong demand (both favorable demographics, and people moving from owning to renting).
The move “from owning to renting” is mostly over, and demographics for apartments are much less favorable than 6 years ago. Also much more supply has come online. Slowing demand and more supply for apartments is why I think growth in multi-family starts will be flat or slow further this year (multi-family starts probably peaked in 2015).
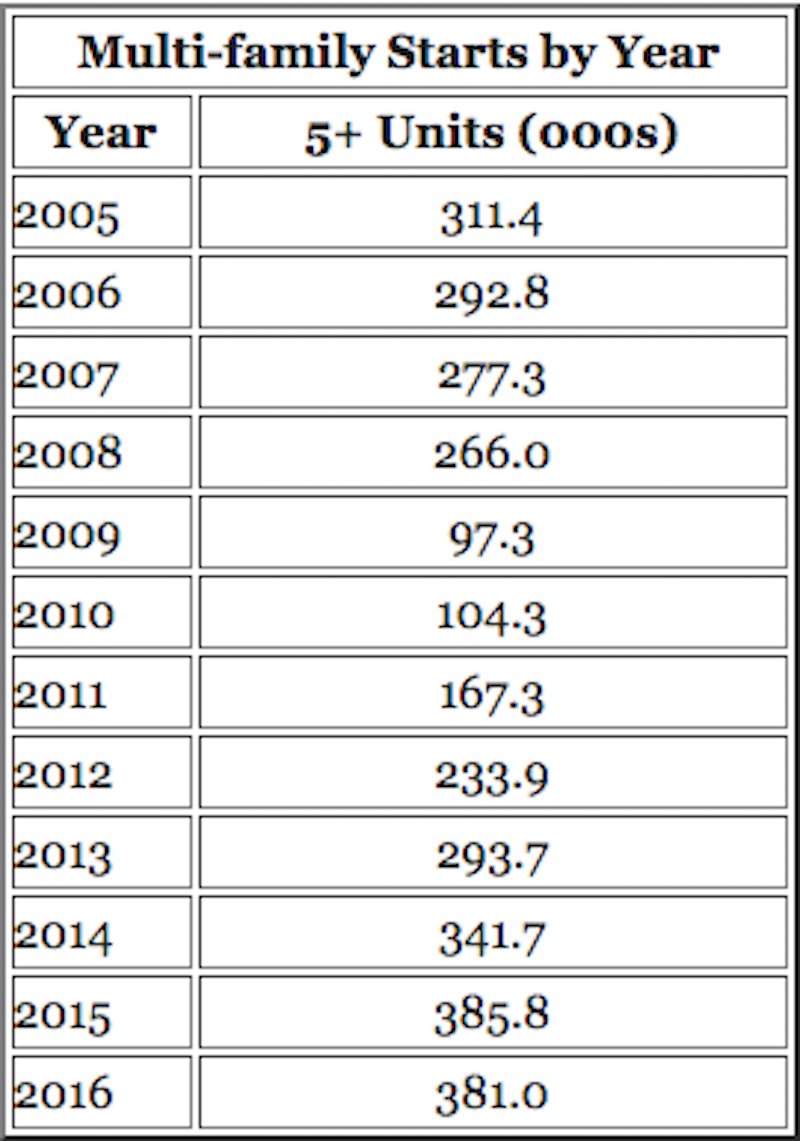
Calculated Risk Blog
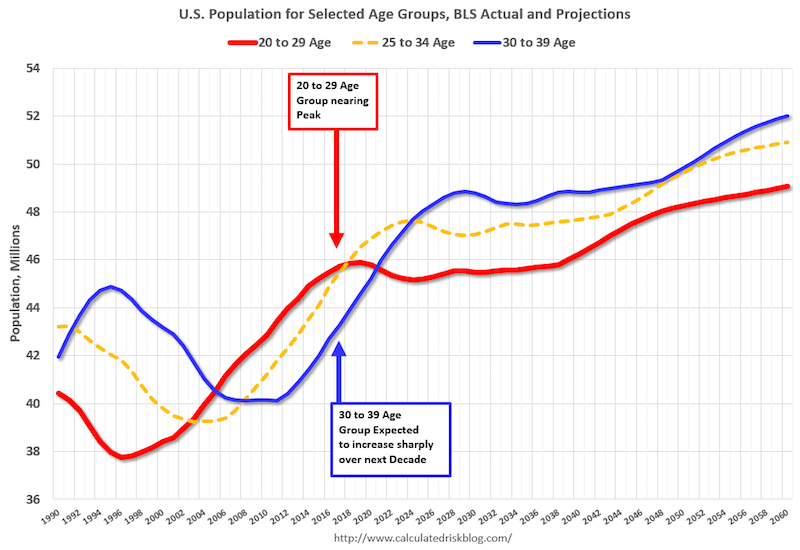
On demographics, a large cohort had been moving into the 20 to 29 year old age group (a key age group for renters). Going forward, a large cohort will be moving into the 30 to 39 age group (a key for ownership).
Note: Household formation would be a better measure than population, but reliable data for households is released with a long lag.
Calculated Risk Blog
This graph shows the longer term trend for three key age groups: 20 to 29, 25 to 34, and 30 to 39 (the groups overlap).
This graph is from 1990 to 2060 (all data from BLS: current to 2060 is projected).
We can see the surge in the 20 to 29 age group (red). Once this group exceeded the peak in earlier periods, there was an increase in apartment construction. This age group will peak in 2018 (until the 2030s), and the 25 to 34 age group (orange, dashed) will peak in 2023. This suggests demand for apartments will soften in a few years.
For buying, the 30 to 39 age group (blue) is important (note: see Demographics and Behavior for some reasons for changing behavior). The population in this age group is increasing, and will increase significantly over the next decade.
This demographics is positive for home buying, and this is a key reason I expect single family housing starts to continue to increase in coming years.
Read the original article on Calculated Risk Blog. Copyright 2017. Follow Calculated Risk Blog on Twitter.
http://www.businessinsider.com/demographics-renting-vs-owning-2017-3
9.Read of the Day….The Decline in US Public Companies
“For the past 20 years, public corporations in the United States have been disappearing. The number of U.S.-based companies listed on Nasdaq and the New York Stock Exchange has dropped by over half since 1996. The dot-com bust of 2000 and the financial crisis of 2008 account for some of this decline, yet the downward trend has continued with little let-up, even as the markets have reached record highs. The number of IPOs in the past five years is less than the number in 1996 alone. Something has gone wrong with the public corporation in the United States.”
So writes Gerald F. Davis at the start of “Post-corporate: The Disappearing Corporation in the New Economy,” written for the Third Way think tank (February 1, 2017). He continues:
“What industries have accounted for most of the decline? In the aftermath of the dot-com boom, there was an exit of many software and online service providers. A wave of exits and mergers in telecom industries soon followed. Since 2008, there has been a large reduction in the number of commercial and investment banks. The offshoring of electronics manufacturing and assembly led to closures and mergers of many US firms in these industries. The pharmaceutical industry has seen many closures and consolidations, too.”
Davis also points out that in the modern globalized economy, there is often less of a need to raise capital by selling stock for a large production facility. If a firm is largely based on information technology capital, it’s possible to lease or rent a lot of what is needed. If a firm is based on producing goods, it’s often possible to outsource production to facilities in other countries. And if you do need to raise capital for a US production facility, you can often turn to private equity firms, which now manages more than $4 trillion in assets, rather than needing to sell stock. Davis writes:
“Thus, Flip was the best-selling portable video camera in 2009, with 100 employees in San Francisco. Vizio was the best-selling television brand in the U.S. in 2010, with a staff of 200 in Irvine. If you can send your specifications to Alibaba, you can become a major electronics firm too, without having to leave your apartment. It’s not just in technology: if you want to launch a new beer, or pet food, or tomato sauce brand, there are generic vendors happy to produce your recipe and get it to store shelves. If you want to start an airline, there are used jets in the Arizona desert waiting to be leased and consultants eager to help you complete the government paperwork. If you want to start a bank, Infosys has a `bank in a box’ suite of software called Finacle, providing all the functionality people need through an online service
http://conversableeconomist.blogspot.com/2017/03/the-decline-in-us-public-companies.html
Found at Abnormal Returns
www.abnormalreturns.com
10. The Secret to Managing People
For 20 years I’ve been using a secret for managing people.
Early on, this management “trick” helped me overcome a lack of experience. It worked like a compass… always pointing me in the right direction and giving me tools for digging myself and my team out of holes.
Later, as I taught this trick to others, I came to better understand its subtle power. It helped me to better understand and manage myself as well.
The trick eventually became a habitual practice for me. Now, when I’m thrown into any leadership situation, I rely on this tool more than any other to find my way. I’ve wanted to share this trick with my team for years. Last month I had my chance, as we hosted a leadership workshop for 23 managers in our business.
My trick is something called Situational Leadership.
It’s not something you can fully learn in a 2-day seminar, let alone a short essay, but it will still be helpful to give you a brief overview…
The basic idea behind Situational Leadership is that there is no single perfect method of leadership. Instead, managers should be flexible and train to adapt their leadership style to the individual and the task. Whenever somebody starts talking about management, people wonder, “What does this mean for me? Is my life going to get harder? Is it going to be more work?”
Let me ease your worries. This approach to management makes your job better, not worse. Situational Leadership is about giving team members what they need to succeed and feel great about their work.
Have you ever felt micromanaged? Have you ever felt overwhelmed in your work and gone to your boss for help only to have your comments fall on deaf ears? Have you ever wondered what it is your boss does all day as you plug away, bored with the same old tasks you mastered long ago?
If so, your boss was not a Situational Leader.
Situational Leaders engage with their direct reports. They understand the work they do and the challenges they face. They provide encouragement. They teach new skills. They advocate for you and your career with their peers and supervisor. And Situational Leaders leverage their authority to overcome team challenges.
Being a Situational Leader begins with diagnosing the development level of a team member. This typically happens by asking questions and observing the work of the team member.
For example, imagine you’re responsible for planning the company’s holiday party this year. In order for me to use the right style of leadership, I might ask a series of questions like, “Have you ever organized an event before? If so, tell me about that event? What was the hardest part? What did you like about it? What would you do different next time?”
All of these questions give me insight into your level of competency and motivation related to event planning. This is important to understand.
People often get defensive when asked probing questions. It’s natural to feel this way, but it’s a mistake. You see, there is no wrong answer. There is no judgment. Instead, it is an effort to understand so we can serve you and our mission properly. It takes a leap of faith at first, but I implore you to try it. I’m certain you’ll see the benefits.
Situational Leaders identify the development level of their reports by asking questions and observing behavior over time.
From there, Situational Leaders adapt their management style to provide what’s needed to reach the goal and move the individual to the next stage of development.
There are four leadership styles: Coaching, Directing, Delegating, and Supporting. Each style is a different blend of support and direction.
Let’s return to our holiday party example. Consider these two scenarios.
Scenario A: During my questioning I learn you’re excited about the opportunity to plan the party. I also learn you have planned parties in the past for groups of 20 or fewer people.
Scenario B: During my questioning I learn you have organized several events in the past. One of those events was a friend’s wedding with 200 guests. I learn you planned all the details and managed all the vendors. You’re willing to take on the project, but you understand it won’t be easy.
If I tried to manage these scenarios using the same style, I’d be making a big mistake. Clearly my report in Scenario A needs more direction. On the other hand, the more-experienced report in Scenario B only needs my support. It’s likely my report would feel “micromanaged” or “hung out to dry” depending on how I handled the situation.
Despite the leader’s faults, a committed employee could still pull it off through hard work and dedication, but it would be unnecessarily miserable. Hard work and dedication is critical, but it’s only part of the answer.
Situational Leadership is our “trick” to unlocking the best in every team member and making their progress more visible so they find their job more enjoyable. That virtuous cycle is a win-win for everyone and is the best way to manage people.