1.Nasdaq 269% Off Bottom.
Chart of the Day
For some perspective on the post-financial crisis rally, today’s chart illustrates how much of the downturn that occurred as a result of the financial crisis has been retraced by each of the five major stock market indexes. For example, the Dow peaked at 14,164.53 back in October 9, 2007 and troughed at 6,547.05 back on March 9, 2009. The most recent close for the Dow is 19,855.53 — it has retraced 174.7% of its financial crisis bear market decline. As today’s chart illustrates, each of these five major stock market indices have retraced over 170% of their financial crisis decline. However, it is the tech-laden Nasdaq that leads the pack with a retracement of 269% — impressive considering the severity of the financial crisis bear market.
http://www.chartoftheday.com/20170111.htm?H
2.First 5 Days of Year Positive…..What does it Mean?
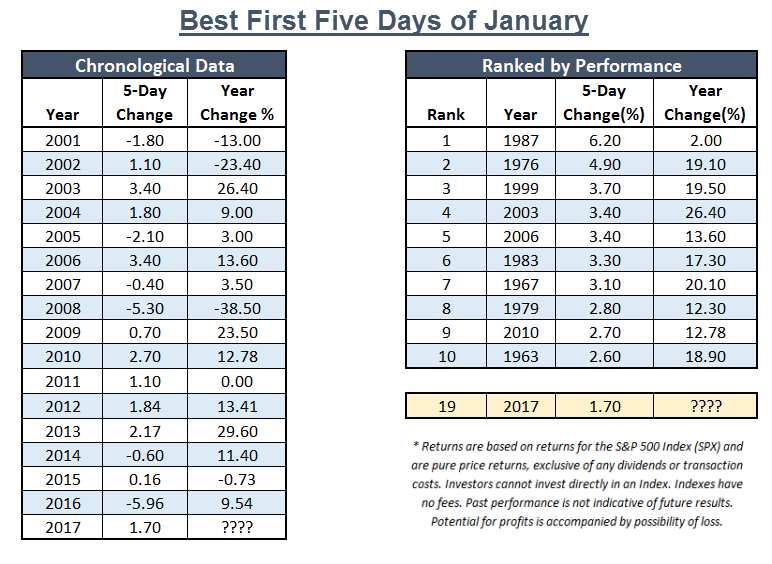
We have all heard the old market adage, “As January Goes, So Goes the Year,” but for those who haven’t heard, there is another saying that goes something like, ” As the First Five Days of January Goes, So Goes January, and So Goes the Year.”. According to the Stock Trader’s Almanac, the last 41 up “First Five Days” periods were followed by full-year gains 35 times, for an 85.40% accuracy ratio and a 14.00% average gain in all 41 years. In 2016, the market as defined by the S&P 500 Index SPX, was down -5.96% after the first five days, making it the worst first five trading days of any year in history (for data going back to 1950). However, when all was said and done, the SPX finished up for the year with a gain of 9.54%. With the close on Friday, January 6th, 2017, the first week of the year proved to be a positive one as the SPX gained 1.70%, making it the 19th best year going back to 1950 when ranked by first 5 day performance.
https://oxlive.dorseywright.com/research/bigwire/
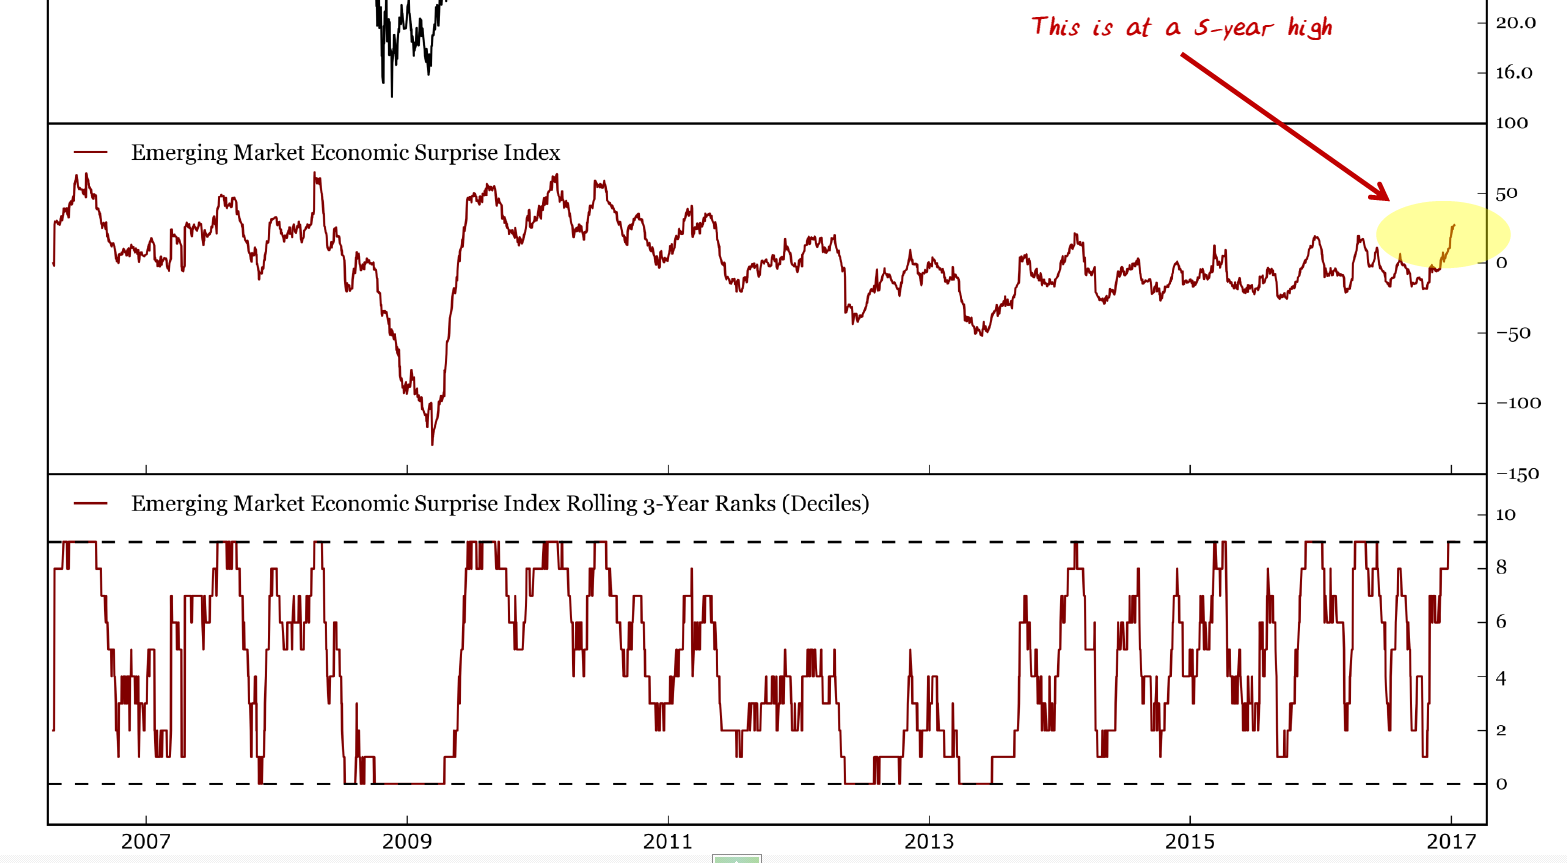
3..As All the Money Flows to the U.S. Post-Election….Emerging Market Economic Surprises Hit 5 Year High.
4.How are Advisors Allocating 2017?
Advisor asset allocation trends
A majority of survey respondents expect to continue to allocate to US equity, international equity, investment grade credit and emerging markets (EM) in 2017, with US and international equities ranking as the most popular asset classes.
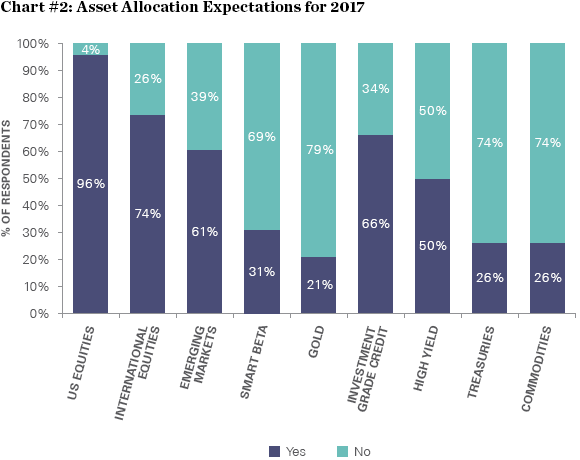
Source: State Street Global Advisors’ “2016 Year-End Survey,” as of 11/2016
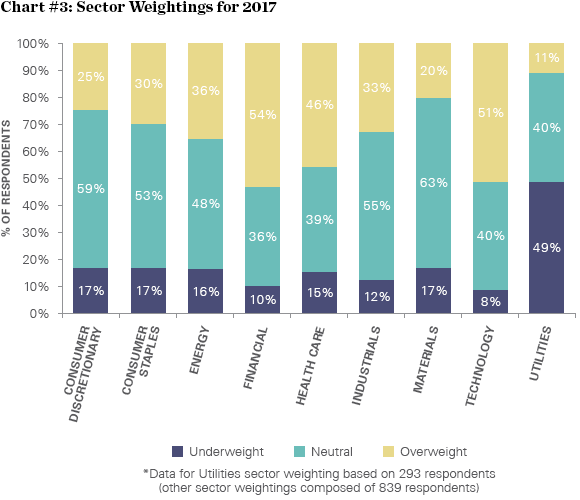
Sector investing intentions
Financial, technology and health care emerged as the bright spots among sectors. The chart below shows that roughly half of survey respondents are overweight in these sectors, while 15% or less are allocating an underweight position.
The financial sector saw the biggest jump in investor interest, going from a 33% overweight position at the time of our mid-year survey to 54% today. Expectations of a rising interest rate environment are spurring financials, while investors are turning to technology for growth.
Source: State Street Global Advisors’ “2016 Year-End Survey,” as of 11/2016
http://blog.spdrs.com/post/year-end-survey-profits-volatility-and-politics-are-top-concerns-for-2017
5.Follow up From Earlier in the Week….American Consumers are Feeling Really Good Right Now.
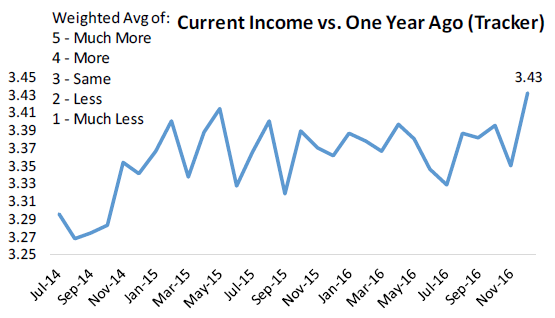
In today’s post we take a look at three charts that focus on consumers’ personal financial situations. The first chart shows our proprietary tracker for a question we ask respondents about how their current income compares to their income one year ago. After showing some deterioration last month, the quick improvement sequentially seems to have resolved itself and our reading for December hit its highest levels on record. While income growth is still relatively modest overall, the new high after years in a range is a huge move.
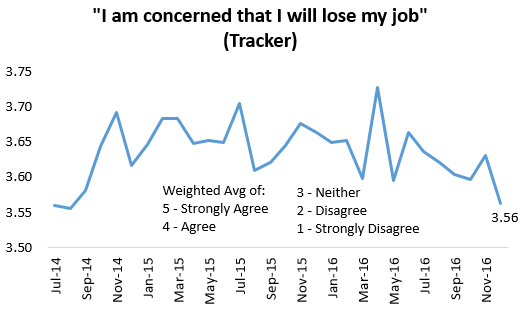
The second chart shows the results from a survey question asking consumers if they’re concerned that they will lose their job. As you can see, job loss concerns hit their lowest levels since August 2014 in our December Pulse survey.
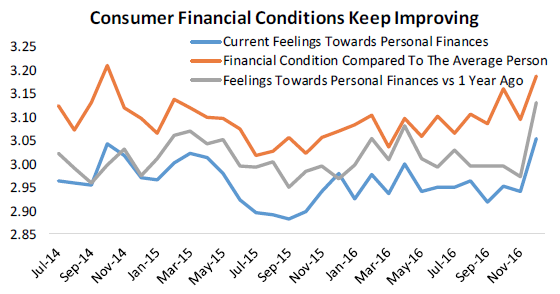
Finally, the last chart shows the results of three questions we ask regarding financial conditions. All of the financial condition series we track made a big positive turn in December, rising to either multi-year highs or the best levels we’ve ever recorded depending on the specific question. This is a significant turn of events that should have a positive impact on GDP in the coming quarters.
https://www.bespokepremium.com/think-big-blog/
6.Bombed Out Sector 2017? Uranium Down 90% Since 2010.
Uranium ETF URA
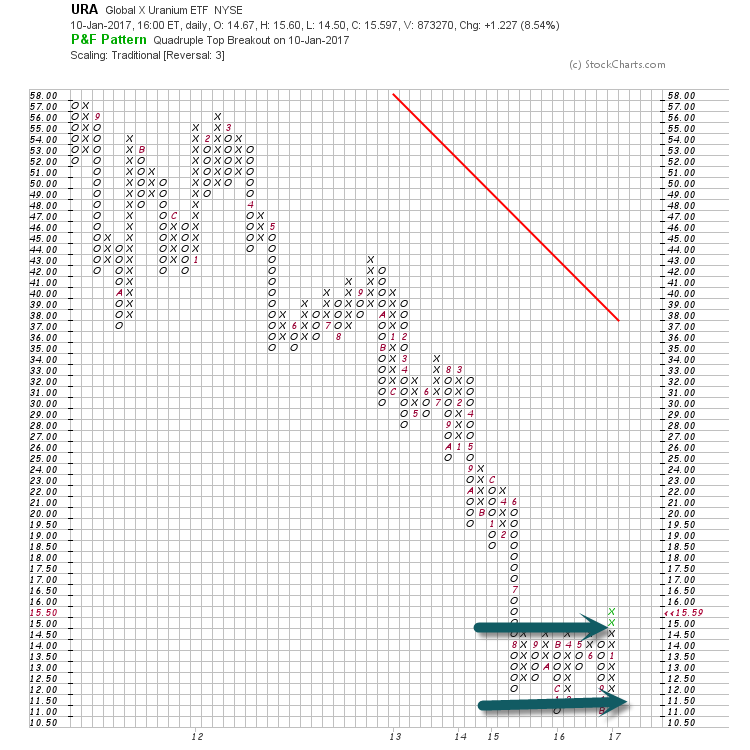
Uranium Since 2010.
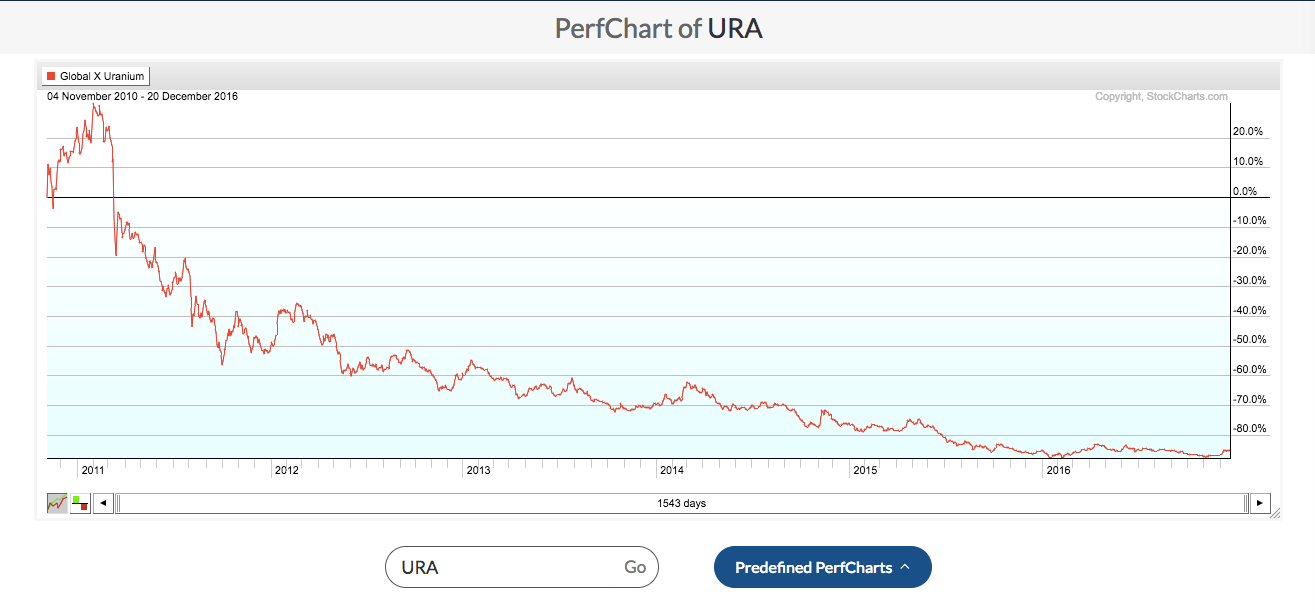
Chart from Meb Faber.
http://mebfaber.com/2016/12/21/ask-uranium-stocks-stocking-holiday-season/
7.60/40 in Rising Rates/Higher Inflation Market.
Now Bernstein is warning about passive *asset allocation* decisions, too
The team says investors should rethink the traditional strategy of ’60 per cent stocks, 40 per cent bonds’. Sure, that strategy worked pretty well for a while now (unless you retired in 2009). But they say there are a few trends that could mean a dimmer outlook for returns from both asset classes, and potential for higher volatility:
It also should be noted that having a passive long-only 60:40 allocation to equities and bonds over the last 30 years wasn’t a bad idea, presumably that is a reason why it has caught on as a simple benchmark for asset allocation. But things may be less rosy for such a strategy in future. The outlook for a passive 60:40 allocation in a low return but higher correlation world will be an important part of the active vs passive debate in coming years.
The team outlines a few reasons for that. You know how, whenever stocks go down these days, bonds tend to rally? Bernstein says you shouldn’t get used to that. The firm expects the correlation between equities and bonds to turn positive in coming years, which means it’d be tougher to get foolproof diversification by reallocating between the two asset classes.
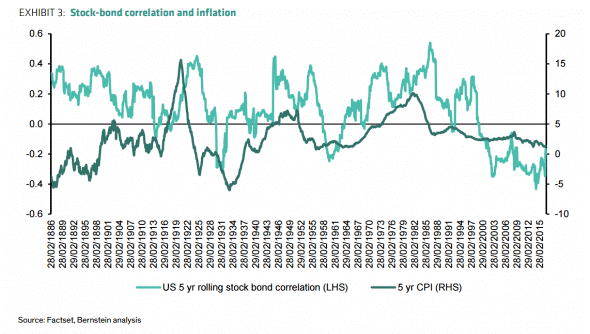
They say low inflation might’ve driving the tendency for bonds and stocks to move in opposite directions:
What does the empirical evidence show? There has been a link between stock-bond correlation and inflation that we can trace back over 130 years… Periods when inflation moved significantly higher, during WWI, WWII and the 70’s were all periods that saw rising stock-bond correlation, while the only period that has seem stock-bond correlations as close to the negative levels that we see today was the 30’s when there was deflation risk (note that in these slides we are using 5 year stockbond correlations as opposed to the 10 year windows in our earlier slide).
In short, Bernstein says that when inflation is low, any move higher in bond yields could be interpreted as the market seeing less deflation risk. And that would lead to higher equity prices as well. So, voila, there are your negative correlations between equities and bonds:
Click for full read
8.2017-First Week in Flows.
U.S. equity ETFs were again the preferred destination. That segment saw $8.7 billion worth of inflows. On Friday, the S&P 500 touched a record high above 2,282 after returning 12% in 2016.
For a full list of this week’s top inflows and outflows, see the tables below:
Top 10 Creations (All ETFs)
| Ticker | Name | Net Flows ($,mm) | AUM ($, mm) | AUM % Change |
| SPY | SPDR S&P 500 ETF Trust | 2,266.96 | 229,917.65 | 1.00% |
| VOO | Vanguard S&P 500 Index Fund | 911.12 | 58,208.45 | 1.59% |
| IWM | iShares Russell 2000 ETF | 721.83 | 39,893.88 | 1.84% |
| MDY | SPDR S&P Midcap 400 ETF Trust | 676.78 | 19,835.73 | 3.53% |
| VNQ | Vanguard REIT Index Fund | 589.51 | 33,740.35 | 1.78% |
| XRT | SPDR S&P Retail ETF | 482.09 | 882.47 | 120.41% |
| JNK | SPDR Barclays High Yield Bond ETF | 456.46 | 12,515.92 | 3.79% |
| XLF | Financial Select Sector SPDR Fund | 452.66 | 23,483.58 | 1.97% |
| VEA | Vanguard FTSE Developed Markets ETF | 387.31 | 41,252.48 | 0.95% |
| DIA | SPDR Dow Jones Industrial Average ETF Trust | 385.88 | 15,218.89 | 2.60% |
Top 10 Redemptions (All ETFs)
| Ticker | Name | Net Flows ($,mm) | AUM ($, mm) | AUM % Change |
| QQQ | PowerShares QQQ Trust | -1,237.42 | 41,400.32 | -2.90% |
| GLD | SPDR Gold Trust | -352.95 | 30,452.76 | -1.15% |
| DGAZ | VelocityShares 3X Inverse Natural Gas ETN | -192.93 | 133.81 | -59.05% |
| TLT | iShares 20+ Year Treasury Bond ETF | -167.07 | 5,153.30 | -3.14% |
| IGF | iShares Global Infrastructure ETF | -161.04 | 1,292.22 | -11.08% |
| EWC | iShares MSCI Canada ETF | -157.72 | 3,554.99 | -4.25% |
| NUGT | Direxion Daily Gold Miners Index Bull 3x Shares | -138.02 | 1,621.74 | -7.84% |
| EZY | WisdomTree LargeCap Value Fund | -129.86 | 82.35 | -61.20% |
| IEF | iShares 7-10 Year Treasury Bond ETF | -104.78 | 7,439.24 | -1.39% |
| EFAV | iShares MSCI EAFE Minimum Volatility ETF | -104.23 | 5,841.52 | -1.75% |
ETF Weekly Flows By Asset Class
| Net Flows ($, mm) | AUM ($, mm) | % of AUM | |
| U.S. Equity | 8,722.85 | 1,512,692.21 | 0.58% |
| International Equity | 1,614.45 | 517,596.27 | 0.31% |
| U.S. Fixed Income | 2,783.80 | 413,033.23 | 0.67% |
| International Fixed Income | 512.27 | 40,492.11 | 1.27% |
| Commodities | -303.43 | 60,519.72 | -0.50% |
| Currency | -69.14 | 3,138.13 | -2.20% |
| Leveraged | 60.03 | 24,875.55 | 0.24% |
| Inverse | -234.81 | 16,937.30 | -1.39% |
| Asset Allocation | -49.61 | 6,836.83 | -0.73% |
| Alternatives | 34.33 | 3,821.01 | 0.90% |
| Total: | 13,070.73 | 2,599,942.37 | 0.50% |
Top 10 Volume Surprises, Funds >$50 mm AUM
| Ticker | Name | Average Volume (30 Day) | 1 Week Average Volume | % of Average |
| PXMV | PowerShares Russell Midcap Pure Value Portfolio | 28,852 | 168,921 | 585.48% |
| EZY | WisdomTree LargeCap Value Fund | 87,407 | 740,674 | 847.38% |
| FYT | First Trust Small Cap Value AlphaDEX Fund | 55,296 | 311,129 | 562.66% |
| MLPC | C-Tracks Miller/Howard MLP Fundamental ETN | 12,969 | 55,542 | 428.28% |
| FNK | First Trust Mid Cap Value AlphaDEX Fund | 33,887 | 236,975 | 699.30% |
| MDYV | SPDR S&P 400 Mid Cap Value ETF | 56,343 | 245,720 | 436.12% |
| VCLT | Vanguard Long-Term Corporate Bond Index Fund | 369,502 | 1,263,734 | 342.01% |
| SMD | SPDR S&P 1000 ETF | 10,035 | 34,439 | 343.17% |
| SST | SPDR Barclays Short Term Treasury ETF | 43,860 | 180,883 | 412.41% |
| BLHY | Virtus Newfleet Dynamic Credit ETF | 288,777 | 823,136 | 285.04% |
Disclaimer: All data as of 6 a.m. Eastern time the date the article is published. Data is believed to be accurate; however, transient market data is often subject to subsequent revision and correction by the exchanges.
http://www.etf.com/sections/weekly-etf-flows/weekly-etf-flows-2017-01-05-2016-12-30
9.Home Building only 60% Back to Normal….Shortage of Lots, Labor and Loans.
Why home builders can’t — or won’t — meet housing demand
You’re finally ready to buy a house. Got a decent down payment in the bank, a solid credit history and even a preapproval from a lender. You’re golden.
Except you can’t find a house. At least not one you really love that’s in your price range. Something about a lack of inventory in your market. Apparently, there’s just not enough houses to meet the demand.
But why? If there are people looking to — and able to — buy, why won’t builders build?
It starts with lending
Robert Dietz, chief economist for the National Association of Home Builders, says that nationally, on average, there’s less than a five-month supply of single-family homes. That’s the number of months it would take for all the current homes on the market to sell. Redfin says four to five months’ supply is about average.
The thing is, in many metro markets, the supply of homes for sale is even tighter. For example, this year in San Francisco and Denver, inventory supplies have been less than three months and two months, respectively.
“The primary thing that’s holding back home builders is that they can’t get access to credit,” says Christopher Whalen, senior managing director and head of research for the Kroll Bond Rating Agency. “During the [housing] crisis a lot of banks around the country, especially in the Southeast from Georgia on down, got hurt very badly with construction and development loans on residential homes.”
That led to now-risk-averse lenders making fewer builder loans for land acquisition, lot development and construction.
“The predominant sector that the banks have been lending to, really since 2008, has been multifamily housing, which has done very well and has been relatively low-risk,” Whalen says. “[But] the developer that wants to do single-family homes really has a hard time — unless you’re in Texas, for example, where it’s been a boom. But other than that, in most areas of the country the banks just don’t want to lend on dirt.”
However, of all the factors hindering home-building, Dietz says lending is likely the most improved.
“Over the last few years, we’ve seen loan growth in excess of 15% on a year-over-year basis,” he says. While still challenging, strict lending conditions are easing.
But there are two other obstacles that builders need to overcome.
Land and labor are also issues
“It’s become more difficult and more expensive to develop land, and that’s restricted the pipeline for builders to buy in order to put up a home,” Dietz says. As proof, he points to an NAHB survey in which 64% of builders say lot supplies are “low” or “very low.”
Labor is another issue builders face. In fact, it’s the top business challenge for builders, according to NAHB surveys. Dietz notes the residential construction industry lost 1.5 million jobs during the Great Recession, and only 600,000 to 700,000 jobs have been replaced in recent years.
And the housing industry is struggling to replace an aging workforce. Dietz says the existing construction workforce has a median age over 40. He says the challenge is to attract the next generation of construction workers.
How long until we get back to normal?
So a shortage of lots, labor and loans are holding builders back, but things are getting better. The gap between available home inventory and demand is slowly shrinking.
“We’re effectively just shy of 60% of the way back to normal conditions,” Dietz says.
However, “normal” won’t be the level of building that existed during the prerecession housing boom. Dietz says the housing industry will be in good shape when it hits 1.3 million single-family starts a year — but that might take another three to four years.
By
HALBUNDRICK
This article is reprinted by permission from NerdWallet.
http://www.marketwatch.com/story/why-home-builders-cant-or-wont-meet-housing-demand-2017-01-11
7 Things the Smartest Leaders Do at the Start of Every Year
Hint: It’s not about you.
By Marcel Schwantes
When we look at the major priorities and initiatives for growing your business in 2017, we need to take a cue from the Global Leadership Forecast study, conducted by DDI and the Conference Board.
Their crystal ball is clear: Leaders just aren’t ready to lead. In the research, four of the top 10 human capital strategies CEOs selected as crucial for their companies’ success should be focused on, what else, leadership!
This is no joke. Looking ahead, organizations will have to rethink their existing leadership development efforts in order to minimize the risks brought on by unprepared leaders.
As a founder, executive, or manager in charge of your most precious commodity–people–it’s time to take inventory of your skills and key behaviors compared with what you’ll find the smartest leaders doing in the next 90 days.
- Smart leaders promote the big picture.
In the traditional top-down leadership world, bosses at the top of the food chain will cast a vision, and then use their power and control to move people to carry out the vision. In today’s social economy, smart leaders begin the year by casting a vision and enrolling their followers to express their voices as co-creators and co-contributors to the vision.
Your first priority in making that happen? Pump the fear out of the room and liberate your people to collaborate, innovate, and express their ideas.
- Smart leaders know what’s needed to keep their most talented employees happy and engaged.
So you liberated them. They’re inspired and feel empowered. Now what?
Smart leaders will be spending considerable time developing culture and equipping their tribe for battle the rest of the year. In your case, you want to measure the core elements needed to attract, focus, and keep your most talented employees. It’s as simple as asking yourself questions like:
- Do my employees know what is expected of them?
- Do my employees have the materials, tools, and equipment they need to do their work right?
- Do my employees have the opportunity to do what they do best every day?
- In the past seven days, have my top performers received recognition or praise for doing good work?
- Do immediate managers, supervisors, or others at work seem to care about them as people?
If these questions look familiar, that’s because Gallup has been using them for more than 30 years as part of its rigorous employee engagement research. The company identified 12 core elements–the Q12–that best predict employee and team performance.
- Smart leaders develop self-awareness.
Self-awareness is one of the most important capabilities for leaders to develop, to understand not only themselves better but also the people around them. And it is a learned trait.
And a self-aware leader is a resilient leader. For example, instead of approaching a problem with a self-defeated attitude of “why me,” self-aware leaders probe and ask themselves questions like:
- Why do the same issues keep coming up over and over?
- Why do I respond to situations with [insert your negative or counterproductive emotion]?
- What makes me think, act, and feel the way I do?
- What makes me tick? What pushes my buttons?
4. Smart leaders begin the year by accepting feedback.
Many leaders don’t want to listen to the ideas, opinions, and constructive feedback of others. They operate in an ego system, not an ecosystem. Unfortunately, if you’ve ever worked with this type of leader, it can be exhausting.
A smart leader who listens well does so with active, not reactive, listening. This helps him or her to filter any criticism, cut the drama, and find the facts for an appropriate response.
Smart leaders ask the tough question, “How am I doing as a leader?” And then they listen. They are interested in receiving honest feedback so they can grow further.
In Seven Pillars of Servant Leadership, authors Don Frick and James Sipe describe nine helpful approaches when receiving feedback:
- Open. Listen without interruption, objections, or defensiveness.
- Responsive. Be willing to hear the speaker out without turning the table. Ask questions for clarification.
- Thoughtful. Seek to understand the effects and consequences of your behavior.
- Calm. Be relaxed, breathe. Assume a comfortable body posture. Be aware of your emotional reactions.
- Explicit. Make it clear what kind of feedback you are seeking and why it is important to you. Offer a structure for the feedback–questions, rating scales, stories.
- Quiet. Refrain from making or preparing to make a response. Do not be distracted by the need to explain, defend, or fix.
- Clear with your commitment. Describe how you have benefited from the feedback and what specific steps you will take toward improvement.
- Accepting. Be open to assuming the speakers’ goodwill.
- Clarifying. Make sure you are clear about what the speakers are seeing, saying, and recommending
5. Smart leaders start off the year with a commitment to authenticity.
Brené Brown’s now historic and viral TED Talk The Power of Vulnerability has already solidified the importance of authenticity in the workplace, and how critical it is for leaders to connect with and inspire others.
So what do you gain by being authentic? A lot–such as saving your whole company from going under, as was the case of India-based technology startup Hubbl.
Harvard Business Review tells the story: Hubbl ran out of funds, and founder Archana Patchirajan (now founder of Sattva) broke the news to her staff that they had to be let go.
Instead of packing, as HBR tells it, they refused and committed to working for 50 percent of their pay instead of leaving their boss. A few years later, Hubbl was sold for $14 million.
What drove them to stay? Employees cited being treated like family, having a personal relationship with the founder, and having the freedom to make mistakes and learn from them.
When you boil it down, Patchirajan was authentic with them, even during the worst of times.
As hard as it is to get to that level of authenticity, it is totally doable. While some teams will work together for years and still distrust one another, others who have been together just a few weeks or months develop an amazing amount of trust.
The key? In one word: courage.
- Smart leaders have the courage to show up with emotional honesty.
- Smart leaders have the courage to accept their shortcomings.
- Smart leaders have the courage to be human and make mistakes, allowing others to see them in vulnerable moments.
- Smart leaders have the courage to open dialogue about failures and take accountability for them.
- Smart leaders have the courage to admit uncertainty in troubled times, and that they don’t have all the answers.
6. Smart leaders start and finish with integrity.
How’s your reputation? When people run a Google search on your name or company, do you get worried? Is there anything you don’t want revealed about your culture or brand?
Listen, the leadership journey is not for wimps. There will be scrutiny from all sides. That’s why smart leaders have integrity running through their veins. Without it, as history will tell us (Enron, Worldcom, etc.), you can count on massive failure and public shame.
Integrity is something you can guarantee smart leaders will choose throughout the year, not just to start off. It is based on character and values in their daily decisions and observed in how they treat their people (think respect and dignity, for starters).
Quick story: Early in my career, more than two decades ago, while working for a career conferences company, I was asked to lie to a client–a Fortune 500 pharmaceutical giant.
My manager’s attitude was, “The client doesn’t need to know the truth of what happened, because if they did, it would cost us this account. So we need to give them our version of the story.”
I refused, and by doing so, challenged the company’s unethical leadership status quo. I was soon released. Two years later, the company went out of business.
Many of us have to make decisions that define who we are and what we believe in. We arrive at a crossroads and must choose between towing the line or taking the higher road and doing the right thing, even when no one is looking, as the saying goes.
Integrity is a choice we make, and must keep making over and over again.
7. Smart leaders will create the environment for retaining top talent.
Instead of spending an arm and a leg to recruit rock stars, farm your own talent. As you develop them, and they become internal rock stars, your challenge will be to create the environment that pushes them forward and upward.
Look for diversity to drive your culture. Smart leaders cannot succeed on their own. They know that they need to surround themselves with great support and advice.
Smart leaders hire diverse talent of different backgrounds and personality types, and with different strengths and gifts to provide them with new perspective, counsel them when appropriate, and debate ideas that challenge their team to grow.
If that sounds counterintuitive because you’re the boss, here’s some truth: This mix creates more innovation and a more productive team. You should be breathing a sigh of relief. Such talent will take the burden off you and make you better.
Smart leaders will make sure that their staff, especially Millennials, have purpose to their work and opportunities to make a real difference.
For the next 90 days, think how you are going to address the things that Millennials value the most in a work environment:
- They want to know that they will have opportunities to learn and advance their careers.
- They want to know that they’ll belong to a community with shared values. The question in the back of their minds is, “Will my surroundings be supportive, flexible, fun, and engaging?”
- They want to know that their prospective employer is inclusive. This means it’s safe to challenge the status quo, share ideas, and provide input because management doesn’t lead by fear.
- They want to know that their future bosses will praise, recognize, and reward them for a job well done.