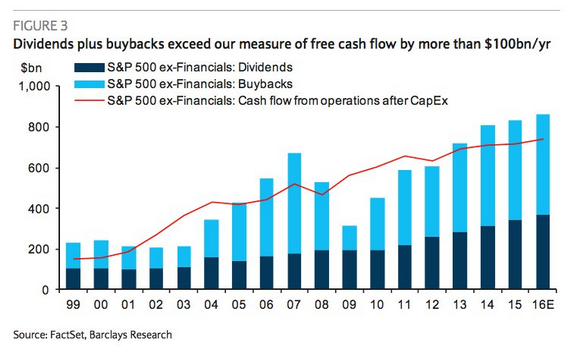
1. We have discussed at length about the Dividend/Buyback Boom…Dividends plus buybacks have exceeded Barclays Research’s estimate of free cash flow by $100bn/yr.
Source: Barclays, @joshdigga, @NickatFP
Q3 is 9 Quarter Low…
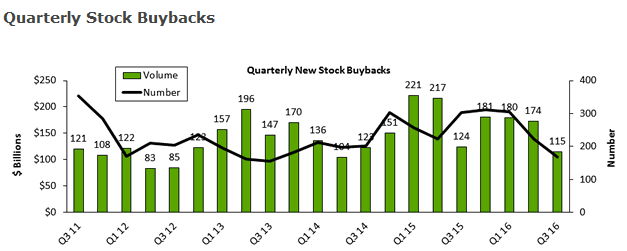
Stock buybacks are at a nine-quarter low according to TrimTabs – Most companies enter the “Buyback Blackout” season around Earnings.
Dave Lutz at Jones
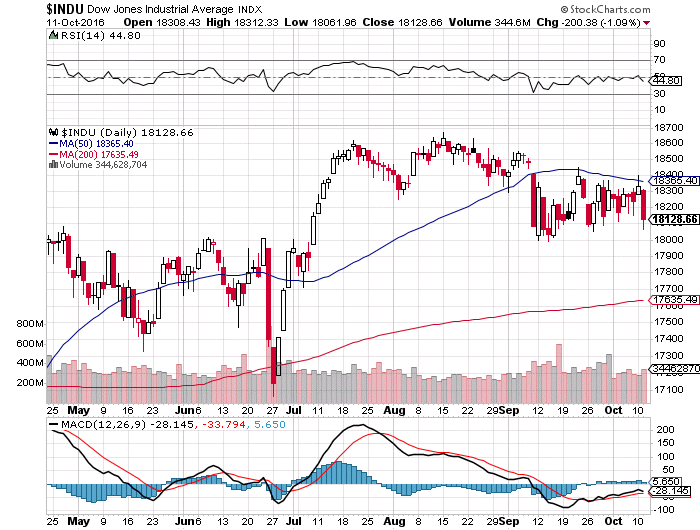
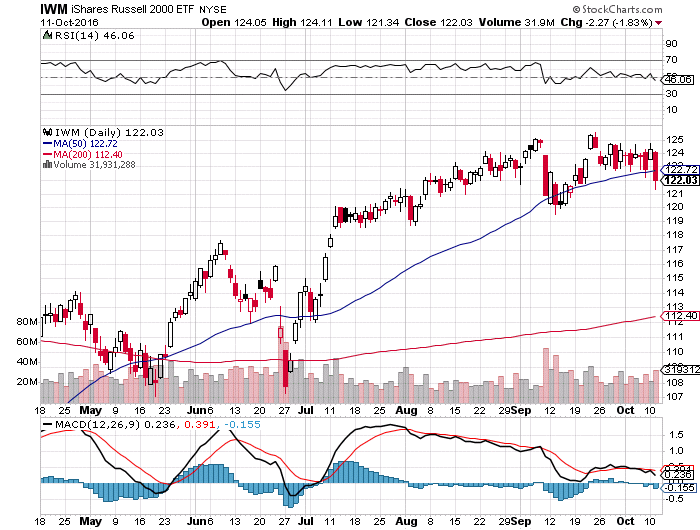
2. S&P, Dow and Small Cap Now All Trading Below 50day Moving Average.
S&P
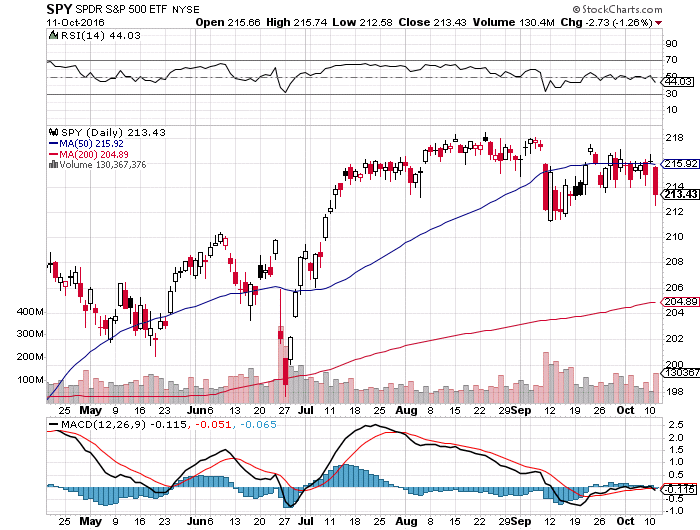
Dow Jones
Russell 2000 small cap
3. Strong Dollar is a Major Factor for Earnings Season…Dollar +2.3% this month.
Dollar Bull Chart Moves Above 50day
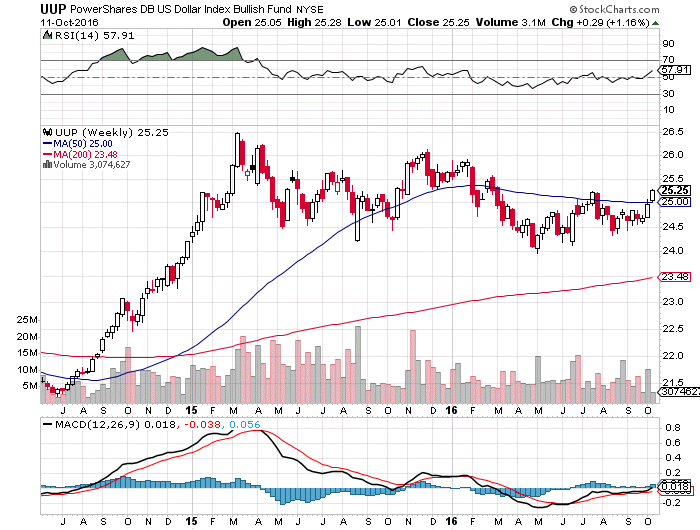
The ICE U.S. Dollar Index DXY, +0.09% — a gauge of the buck against a basket of six currencies—was up 0.8% in recent trade to 97.6860 on Tuesday. That is the highest level for the gauge in more than 7 months, according to FactSet data. The dollar indicator is up 2.3% so far this month, putting it on track for its best monthly gain since May.
However, the extended rise in the greenback may prove a headwind for major multinational companies that export products overseas, making their products more expensive to buyers using other monetary units. Technology companies, in particular, tend to draw the vast majority of their revenue overseas. Revenues in other currencies can be worth less when converted back into dollars.
As the following chart shows, a strong dollar recently has coincided with the S&P 500 index trading lower.
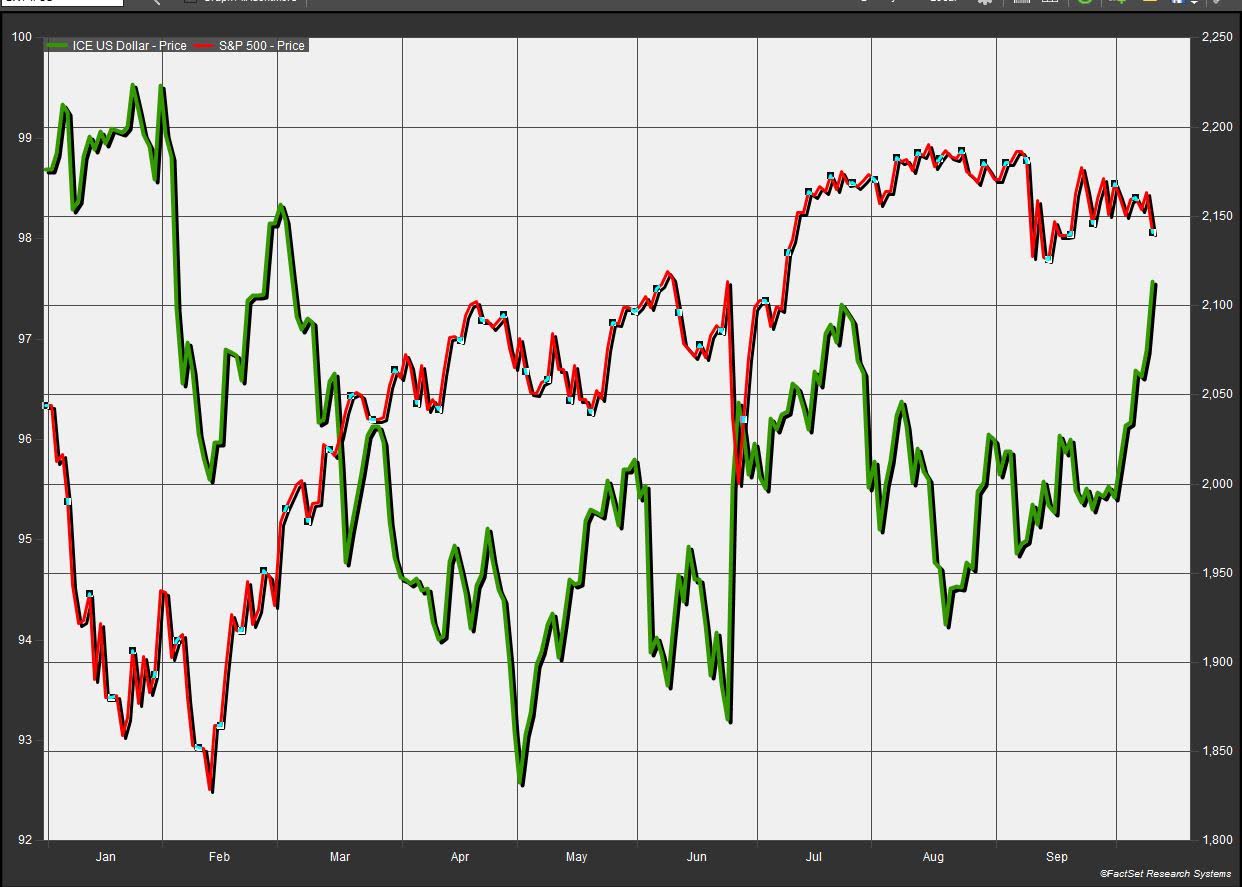
Source: FactSet
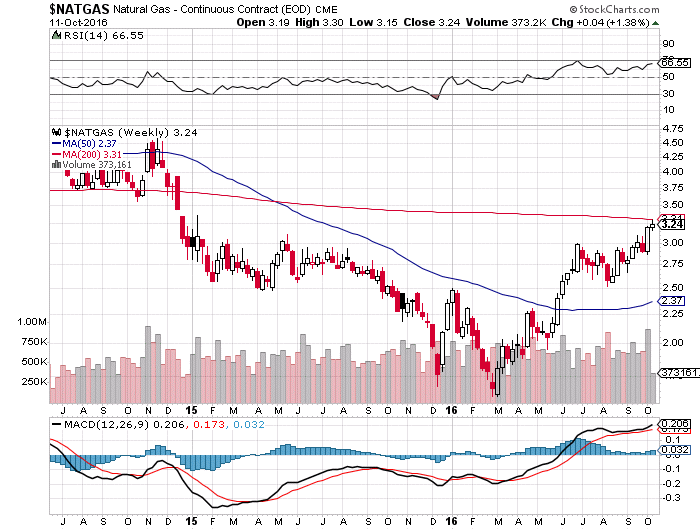
4. Cold Winter? Natural Gas About to Close Above 200 Day.
The decline in production along with an unusually hot summer has helped to shrink a record gas glut that had been pressuring prices. U.S. gas production in September was about 2.4% lower than a year earlier and down 3.5% from its peak in February, according to Platts.
Natural gas for November delivery on Tuesday closed down 1.2% at $3.2370 per million British thermal units, but prices are up 38.5% for the year and at their highest level since December 2014.
Gas prices have rallied 11.4% this month alone. That is during a time of the year when demand is soft, after air conditioners are powered down and before furnaces are fired up.
Power producers and gas suppliers often pass on higher fuel charges to consumers.
Though analysts say prices still could turn lower before heating season begins, Jeff Moore, a Platts Bentek analyst, said he expects it won’t be long before gas prices top $4/MMBTU, or twice the levels of last winter, the warmest on record, when stockpiles swelled.
“That’s not even a bold call in my opinion if we have a cold winter,” he said.
Elsewhere in the U.S., gas-drilling activity has essentially slowed to a stop as prices have made many wells uneconomical. There were 94 rigs drilling gas wells in the U.S. last week, half the tally from a year ago and just a sliver of the 1,600 that were running in 2008 when the shale boom was in full throttle and prices were above $10/MMBTU, according to oil-field-services company Baker Hughes Inc.
http://www.wsj.com/articles/natural-gas-prices-heat-up-as-oil-drilling-cools-off-1476226086
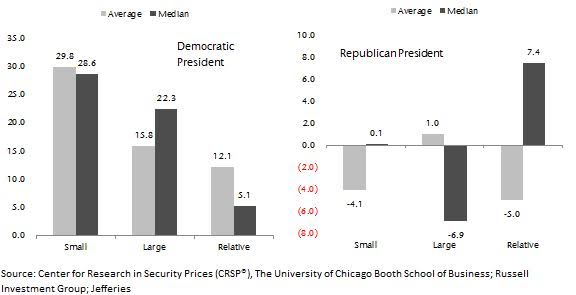
5. Jefferies-Interesting Historical Data Post Election.
Key TakeawayWith election day closing in, we will see a first-term presidency regardless of which candidate wins. We decided to analyze trends in absolute & relative performance in post-election years going back to 1928. Small caps have outperformed large by 12.1% on average in the year after a Democrat is elected and underperformed by 5% if it has been a Republican. Staples, Energy, and Industrials outperformed regardless, while Utilities lagged under both regimes. Although we don’t tend to use trivia to determine our size and sector preferences, we reviewed the performance of twenty-two post-election years. Both size segments tend to perform significantly better after a Democrat wins, thanks to big bounces in 1933, 1945, 2009, and 2013 with the average return for small at 29.8% and large 15.8%. On the other hand, small caps are down 4.1% on average in the first year after a Republican is elected thanks to 1929, 1969, and 1973. Thinking these results might be skewed by years in which a president gets reelected, we also examined performance only looking at years in which first term presidencies began, and we found the outperformance by small caps to be even more exaggerated at 17.8% with the size segment up an average of 40.1% thanks to the 116% return in 1933. We also reviewed Russell 2000 sector performance in these years, but it is worth noting our sector-level data set is smaller with only seven observations. Energy performs the best post-election regardless of who wins but does better in Republican presidencies at 46.3% on an absolute basis and 33.4% relative to the Russell 2000. Interestingly, Tech had the biggest variance based on the political party, as it is up 35.3% when a Democrat is elected versus down 1.7% for Republicans.
|
| Steven G. DeSanctis, CFA *, Equity Strategist (212) 284-2056 sdesanctis@jefferies.com Miles Bredenoord *, Equity Associate * Jefferies LLC |
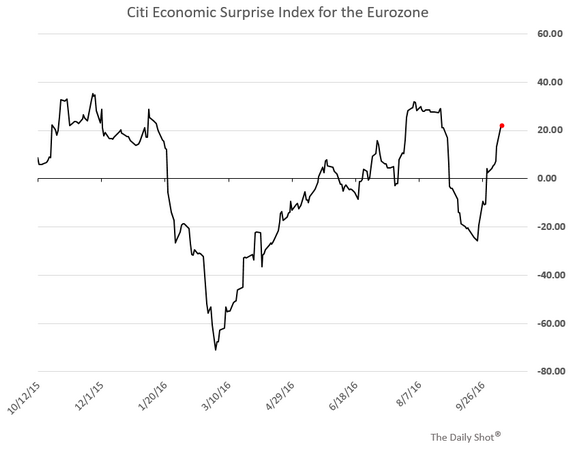
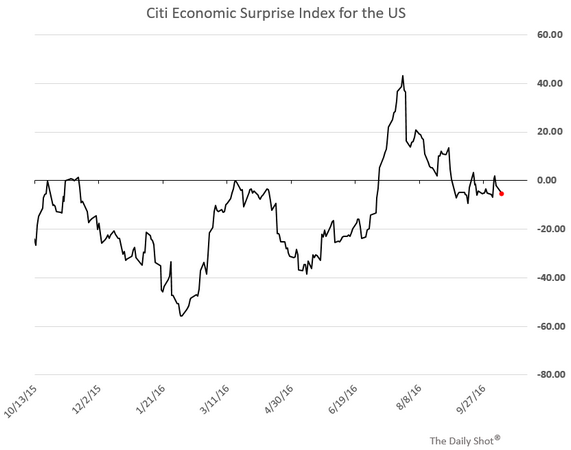
6. Eurozone Economic Surprise Index Goes Positive While U.S. Goes Negative.
Economic data from the euro area remains broadly better than expected as the Citi economic surprise index recovers.
Unlike the situation in the Eurozone, US economic reports remain relatively soft, sending the economic surprise index below zero again.
7. The World has Gorged on Low Rates…Global Debt Now 225% of World GDP…2/3 is now private debt.
The Debt Hangover
This week, the International Monetary Fund (IMF) released an eye-opening report on the ticking time bomb that is global debt, warning the nations of the world that if they don’t deleverage—and soon— there could be grave consequences. At the very least, we could continue to see sluggish growth. In 2015, global debt of the nonfinancial sector, including governments, households and nonfinancial firms, stood at a mind-boggling $152 trillion, or 225 percent of world GDP, an all-time high.
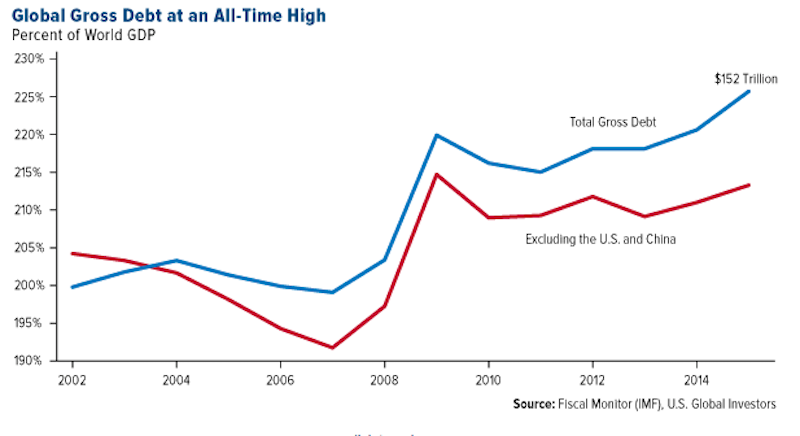
Source: US Global Investors
Two-thirds of this amount, according to the IMF, comes from the private sector, which has lately gorged on cheap credit, especially since rates were slashed following the recession. This not only raises the possibility of another financial crisis, “but can also hamper growth even in its absence, as highly indebted borrowers eventually decrease their consumption and investment.”
In other words, debt plus slow growth leads to even more debt and even slower growth, creating a “vicious feedback loop” that becomes harder and harder to escape, the IMF writes.
http://www.businessinsider.com/investors-staying-away-from-gold-2016-10
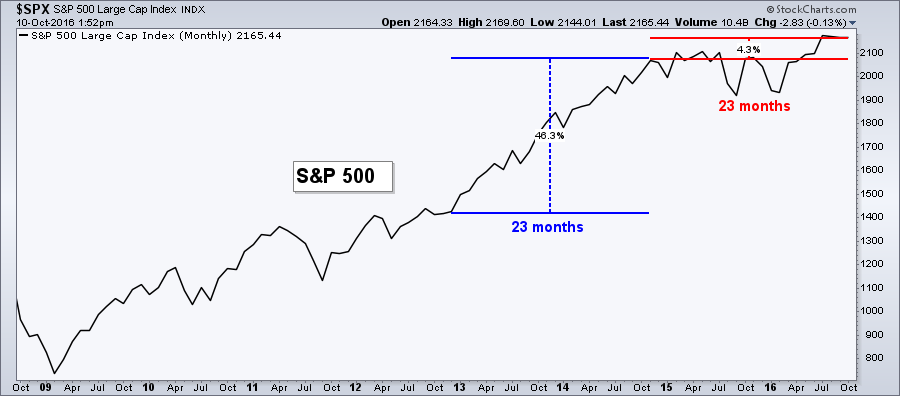
8. 2 years Stock Market “only” 5% Growth.
The chart below is a simple monthly line chart of the S&P 500 ($SPX). I’ve marked with a blue performance line the 23 month period that ended in October 2014, which shows the market rose 46% during that time period. While the last roughly two years has seen less than 5% growth for the U.S. stock market. Investors grew accustom to seeing double-digit gains on their annual statements, requiring practically no outside diversification away from large cap U.S. companies. That market environment has dissipated and a little more effect has been required. And if there’s anything Americans hate, it’s the need for more effort (which is why we’ve invented self-driving cars, shoes that don’t require laces, and voice-activated text messaging).
http://www.athrasher.com/recency-bias-creates-frustration-stocks/
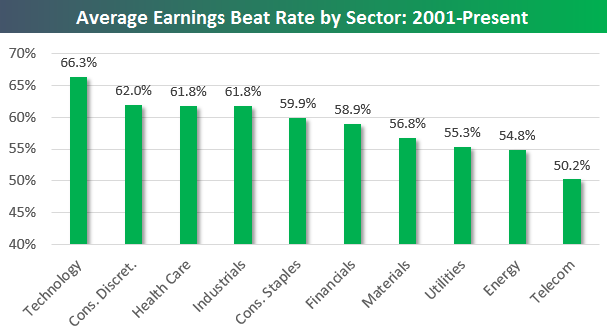
9. Earnings and Revenue Beat Rates by Sector.
Below is the historical earnings beat rate (% of companies that beat consensus analyst earnings per share estimates) by sector going back to 2001. While Technology stocks are the most volatile on their earnings reaction days, they also beat earnings estimates at the highest rate (66.3%). That’s more than four percentage points better than the 62% beat rate for Consumer Discretionary in second place. On the flip side, even though they’re still above 50%, Utilities, Energy, and Telecom have the lowest earnings beat rates.
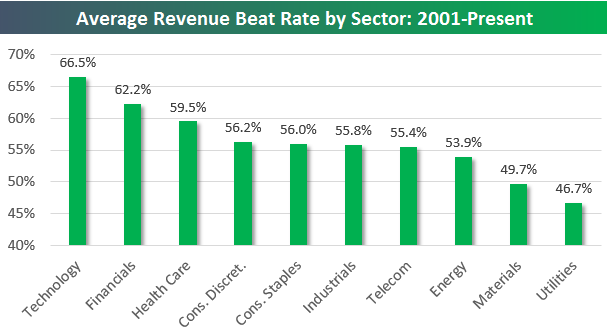
The Technology sector also has the highest top-line revenue beat rate at 66.5%, but it’s Financials — not Consumer Discretionary — that have the second highest revenue beat rate at 62.2%.
Start a 14-day free trial to see all of Bespoke’s in-depth, actionable research.
https://www.bespokepremium.com/think-big-blog/
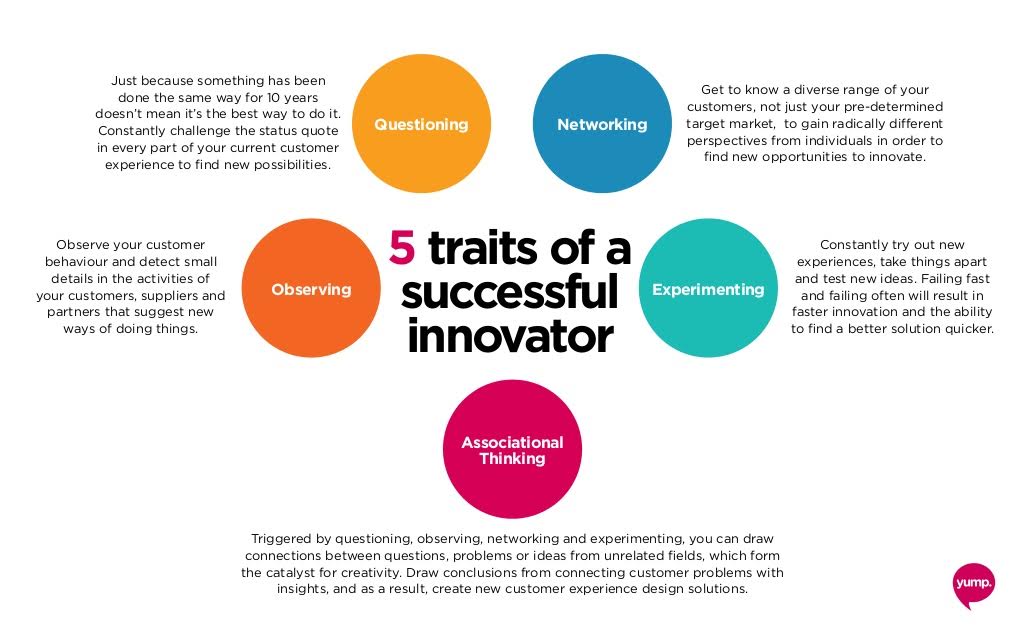
10. Five Traits of a Successful Innovator.