1.Read of the Day….Josh Brown with a Look at Why it’s Impossible to Time Markets Based on Fundamentals.
Candidate for Read of the Year.
The one thing you need to understand about stock market valuation
Published on December 19, 2016CEO at Ritholtz Wealth Management
Last week, we held our quarterly conference call for Ritholtz Wealth Management, in which Chairman and CIO Barry Ritholtz tackled a host of topics – from presidents’ impact on stock markets to interest rates to annual returns. The call was accompanied by our regular quarterly letter.
One section I found to be very helpful for clients had to do with the CAPE ratio and the concern that valuations on US stocks are elevated relative to history right now. Here’s what Barry and our director of research, Michael Batnick, had to say on the subject:
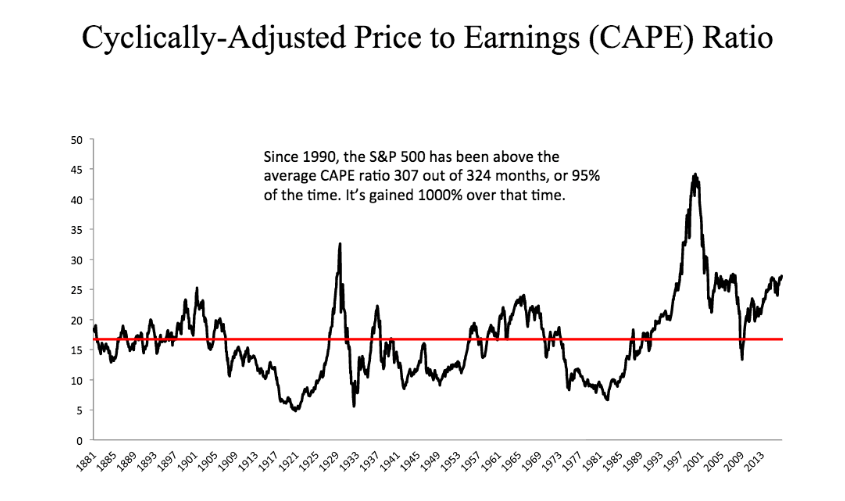
Let’s start with CAPE – the Cyclically Adjusted Price to Earnings ratio. Think of it as the 10-year P/E. It is high for US equities by historical averages, elevated for Japan, moderate for Europe, and low for emerging markets. If we wanted to scare people, we would selectively pull data out showing at present we have the highest reading outside of 2000 (43.2), 1929 (32.5) and 2007 (27.6). But we don’t cherry pick dates to scare people, instead we use data to look for evidence.
Since 1990, the S&P 500 has been trading above the average CAPE ratio during 307 out of 324 months – that’s a total of 95% of the time. If you exited US equities when the CAPE ratio was overvalued, you would have missed gains of more than a 1000% over that time. In fact, had you only invested when the CAPE was 25% overvalued – i.e. when stocks were “very expensive” – your total returns since 1990 would have been 650%. This is one of the many reasons why it is ill advised to use valuation as a timing mechanism.
The most we can really say about a higher than average CAPE is that when it is significantly above its long-term average, we should lower our expectations for future returns. When we look around the world, we see the United States is more expensive than Europe, or emerging markets, or Japan on nearly every single valuation metric. This should not be surprising, given how much the United States has outperformed other countries since the financial crisis ended in 2009. The good news is that our portfolio is exposed to global equities, and as the equity leadership shifts – whenever that might be – our portfolios will benefit from it.
Josh here – one interesting thing to keep in mind is that, while the CAPE for US stocks is currently 25.5, the CAPE for Europe is a more reasonable 15.6 and just 14.4 for Emerging Markets stocks. Additionally, the massive profit wipeouts from 2009, which are obviously biasing the ratio higher, will be rolling off in 2020. Finally, as Professor Jeremy Siegel has pointed out, we’re comparing apples to oranges to some extent, given the fact that the accounting treatment of earnings and losses has changed from one era to the next, which changes the composition of as-reported numbers.
Rather than dismissing valuation concerns out of hand, we prefer to think about them in the context of an overall asset allocation plan. For as long as you will be an investor, there will always be valuation concerns for one asset class or another.
If you’re interested in learning more about how we work with clients on their financial plans and investment portfolios, talk to us here:
Ritholtz Wealth Management
http://thereformedbroker.com/
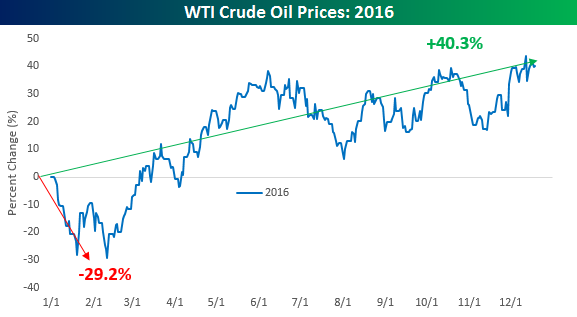
2.Crude Oil was Down -30% in Feb…..Now Looking to Close Year +40%
Crude Oil’s Wild Ride
As 2016 winds down and we look back at what transpired over the course of the year, one of the biggest standouts has to be the turnaround in crude oil prices. After starting 2016 just like it finished 2015, crude oil prices were down close to 30% on the year as of early February. However, like the equity market in 2016, crude oil prices staged a major rally and turned big YTD losses into big YTD gains. At current levels, crude is on pace for an annual gain of over 40% and nearly a double from its intra-year low.
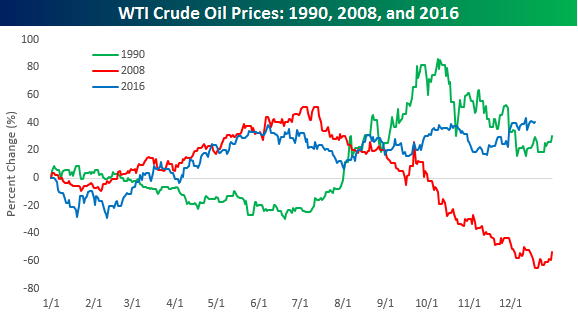
Looking back over the last 30+ years of annual returns for crude oil, there have only been two other years where the commodity has been both up 25%+ YTD and down 25%+ YTD in the same year. Those two years were 1990 and 2008. As shown in the chart below, however, both years saw entirely different paths. Like 2016, in 1990 crude oil prices were weak to start the year and then rallied strongly. Obviously, the circumstances were a lot different between now and then as the late year spike in 1990 was driven by Iraq’s invasion of Kuwait. In 2008, the swings occurred in the opposite order where the 25%+ YTD gain occurred ahead of the 25%+ YTD decline.
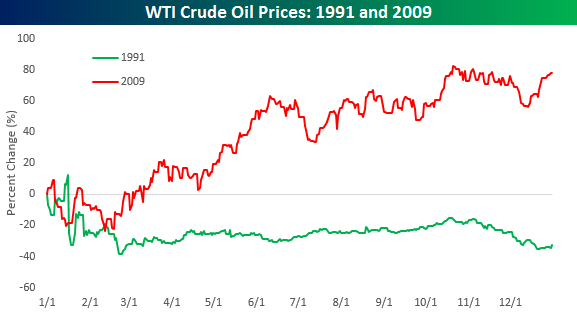
So what happened after these wildly volatile years for crude oil in the past? Did the commodity start to settle down, or did the volatility continue? The chart below shows the performance of crude oil prices in the year after both of the prior years cited below (1991 and 2009). As shown, the year that followed these two prior years was almost as volatile but in two completely directions. In 1991, oil prices continued the declines they saw in the fourth quarter of 1990 and traded sharply lower in the first quarter of 1991 before settling down for the remainder of the year but still finishing down over 30%. More recently, in 2009 crude oil also started off the year relatively weak before turning around and finishing the year sharply higher with a gain of over 75%. Whichever way it goes next year, one thing you can probably count on with crude oil is that like 2016, the magnitude of the move is likely to be large.
https://www.bespokepremium.com/think-big-blog/
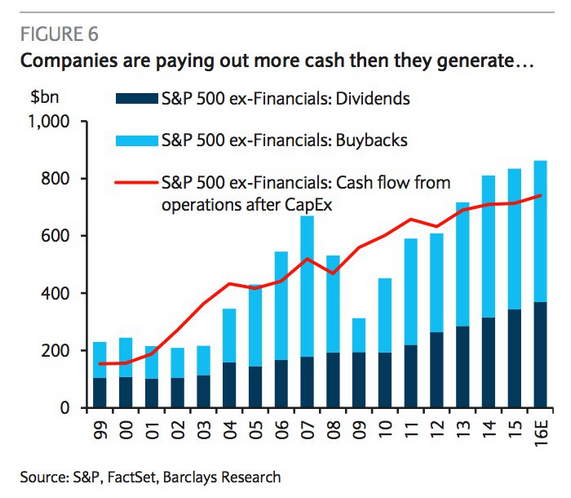
3.What Will Happen with Buyback and Dividend Boom with Interest Rates Rising?
We have talked about this at length for 2 years….Companies paying out more cash than they generate.
From our Equity Markets section: US companies are paying out more in dividends and buybacks than the cash they generate. That’s why corporate debt levels continue to rise. Is this sustainable?
4.Post-Election….ETFs Received Flows in 6 Weeks Higher than the Rest of 2016 in Total.
Investors have plowed money into equity-based exchange-traded funds in historic fashion since last month’s U.S. presidential election, but the sheer size of the move may end up being a warning sign.
According to TrimTabs Investment Research, U.S. stock ETFs have received $97.6 billion in inflows between Nov. 8 and Dec. 15. By itself, that’s about 150% of the $61.5 billion that went into the category over all of 2015.
The buying has been essentially nonstop, with the ETFs only seeing outflows in three sessions since the election, and the inflows comprising about 6.3% of their assets.
David Santschi, chief executive officer at TrimTabs, said the “stampede” into the funds “has been nothing short of breathtaking.” He added, “one has to wonder who’s left to buy.”
http://www.marketwatch.com/story/stampede-into-stock-etfs-may-signal-losses-ahead-2016-12-19
Top Gainers (November 2016)
| Ticker | Name | Issuer | Net Flows ($,mm) | AUM ($M) | % of AUM | YTD 2016 Net Flows($,M) |
| SPY | SPDR S&P 500 ETF Trust | State Street Global Advisors | 7,530.26 | 208,669.69 | 3.74% | 8,800.15 |
| IWM | iShares Russell 2000 ETF | BlackRock | 6,105.22 | 36,590.58 | 20.03% | 4,362.38 |
| XLF | Financial Select Sector SPDR Fund | State Street Global Advisors | 5,467.63 | 20,700.60 | 35.89% | 1,750.42 |
| IVV | iShares Core S&P 500 ETF | BlackRock | 3,838.50 | 86,951.76 | 4.62% | 10,531.07 |
| TIP | iShares TIPS Bond ETF | BlackRock | 2,174.08 | 21,292.45 | 11.37% | 6,743.46 |
| XLI | Industrial Select Sector SPDR Fund | State Street Global Advisors | 1,915.52 | 9,857.10 | 24.12% | 2,760.28 |
| XLV | Health Care Select Sector SPDR Fund | State Street Global Advisors | 1,604.00 | 13,663.81 | 13.30% | 197.88 |
| IJR | iShares Core S&P Small Cap ETF | BlackRock | 1,442.39 | 24,757.87 | 6.19% | 3,782.47 |
| VOO | Vanguard S&P 500 Index Fund | Vanguard | 1,232.42 | 54,629.49 | 2.31% | 10,333.03 |
| VTV | Vanguard Value Index Fund | Vanguard | 1,230.87 | 25,710.59 | 5.03% | 4,528.70 |
Top Gainers (Year-to-Date)
| Ticker | Name | Issuer | Net Flows ($,mm) | AUM ($M) | % of AUM | November 2016 Net Flows($,M) |
| AGG | iShares Core U.S. Aggregate Bond ETF | BlackRock | 10,943.09 | 41,437.66 | 35.89% | 354.03 |
| IVV | iShares Core S&P 500 ETF | BlackRock | 10,531.07 | 86,951.76 | 13.78% | 3,838.50 |
| VOO | Vanguard S&P 500 Index Fund | Vanguard | 10,333.03 | 54,629.49 | 23.33% | 1,232.42 |
| GLD | SPDR Gold Trust | State Street Global Advisors | 9,592.67 | 33,706.48 | 39.78% | -2,291.90 |
| VEA | Vanguard FTSE Developed Markets ETF | Vanguard | 8,814.22 | 37,578.91 | 30.64% | 262.02 |
| SPY | SPDR S&P 500 ETF Trust | State Street Global Advisors | 8,800.15 | 208,669.69 | 4.40% | 7,530.26 |
| TIP | iShares TIPS Bond ETF | BlackRock | 6,743.46 | 21,292.45 | 46.35% | 2,174.08 |
| IEMG | iShares Core MSCI Emerging Markets ETF | BlackRock | 6,498.14 | 16,987.41 | 61.95% | 27.03 |
| VWO | Vanguard FTSE Emerging Markets ETF | Vanguard | 6,317.12 | 43,700.04 | 16.90% | 1,119.39 |
| LQD | iShares iBoxx $ Investment Grade Corporate Bond ETF | BlackRock | 5,194.08 | 29,685.24 | 21.21% | -310.53 |
Biggest Losers (Year-to-Date)
| Ticker | Name | Issuer | Net Flows ($,mm) | AUM ($M) | % of AUM | November 2016 Net Flows($,M) |
| HEDJ | WisdomTree Europe Hedged Equity Fund | WisdomTree | -7,991.63 | 8,475.77 | -48.53% | -390.93 |
| EZU | iShares MSCI Eurozone ETF | BlackRock | -6,703.67 | 6,808.35 | -49.61% | 64.79 |
| DXJ | WisdomTree Japan Hedged Equity Fund | WisdomTree | -5,923.46 | 7,530.62 | -44.03% | -94.32 |
| DBEF | Deutsche X-trackers MSCI EAFE Hedged Equity ETF | Deutsche Bank | -5,282.66 | 7,435.34 | -41.54% | -236.52 |
| EWJ | iShares MSCI Japan ETF | BlackRock | -4,843.50 | 14,865.36 | -24.58% | 709.14 |
| VGK | Vanguard FTSE Europe ETF | Vanguard | -3,642.91 | 10,194.98 | -26.33% | -93.58 |
| QQQ | PowerShares QQQ Trust | Invesco PowerShares | -2,464.89 | 41,505.52 | -5.61% | 144.31 |
| EWG | iShares MSCI Germany ETF | BlackRock | -2,267.18 | 3,387.04 | -40.10% | 39.45 |
| FXH | First Trust Health Care AlphaDEX Fund | First Trust | -2,237.88 | 926.65 | -70.72% | -78.84 |
| FXG | First Trust Consumer Staples AlphaDEX Fund | First Trust | -2,014.86 | 945.72 | -68.06% | -1,123.13 |
http://www.etf.com/sections/monthly-etf-flows/etf-monthly-fund-flows-november-2016/page/0/1
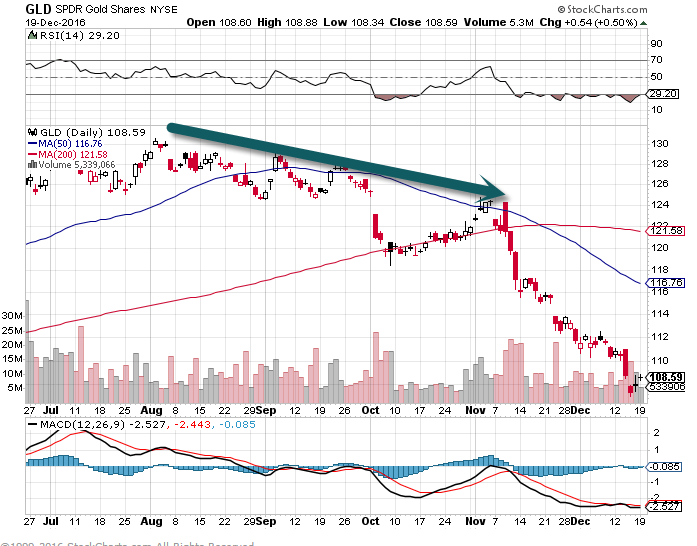
5.Gold Started its Downtrend Well Before Election.
GLD was selling off starting in Aug.
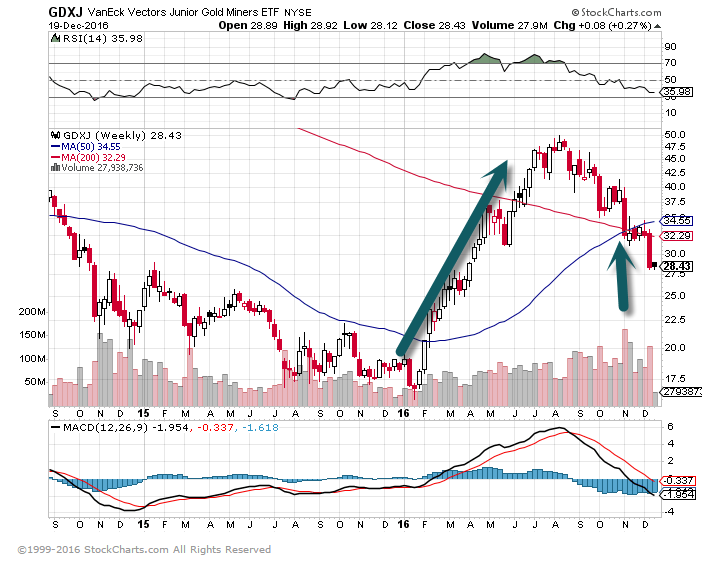
GDXJ-Junior Miners…41% off highs…Still up 62% for the year.
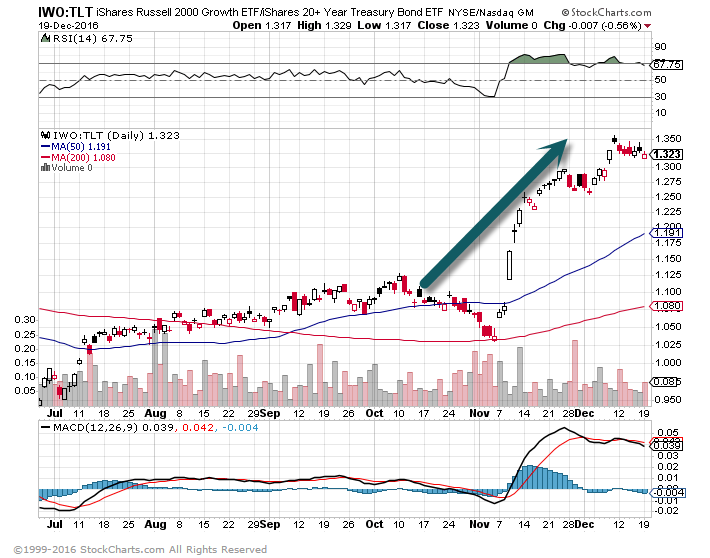
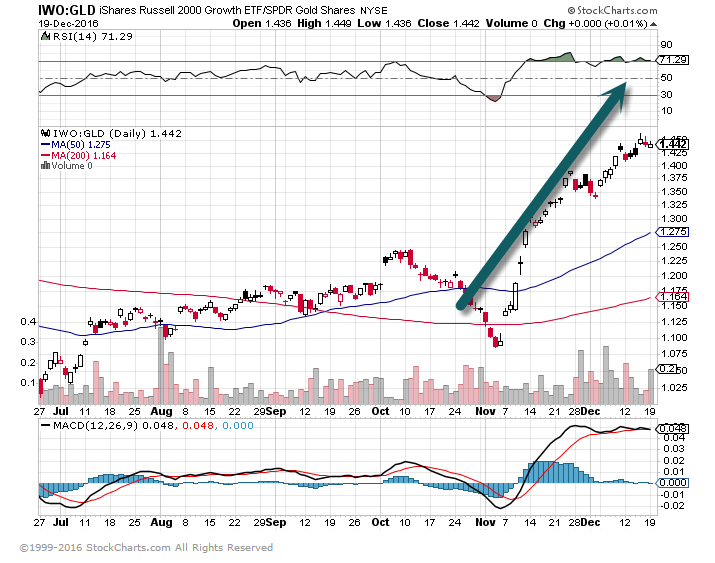
6.Post Election Comparisons.
This chart shows small cap versus Treasury Bond post election
This chart shows small cap versus Gold post- election
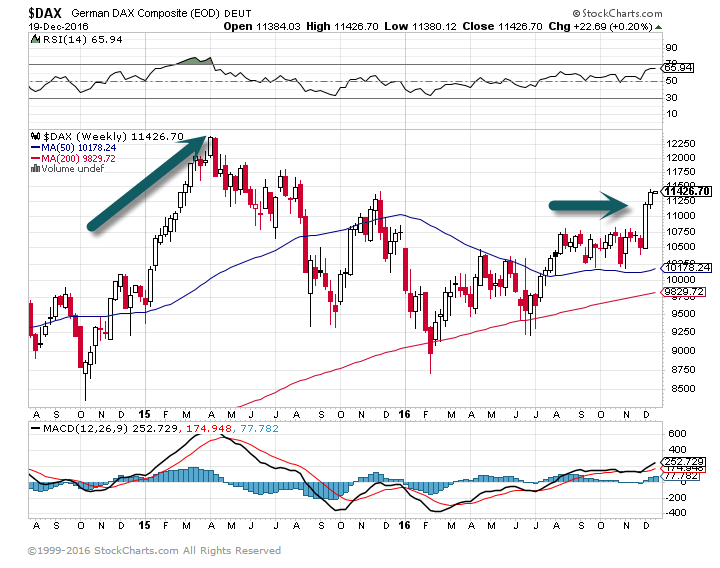
7.The Leading Indicator of Europe—Germany.
DAX still below 2015 highs.
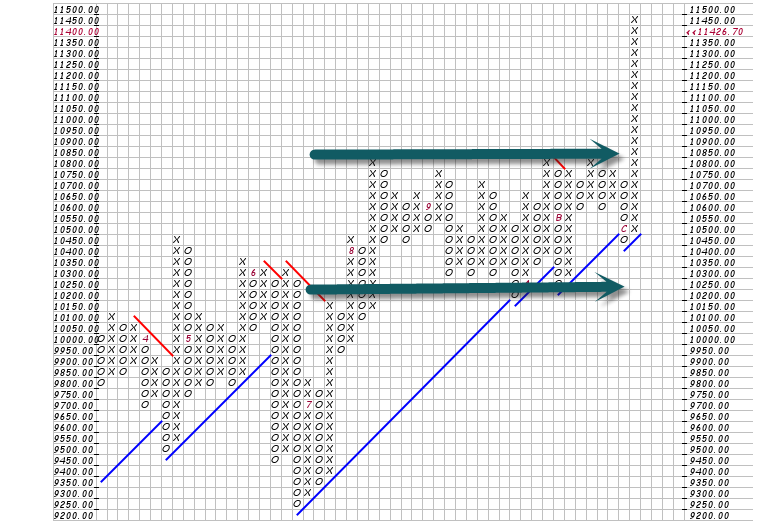
8.I Don’t Think this Indicates a Short but Interesting Chart.
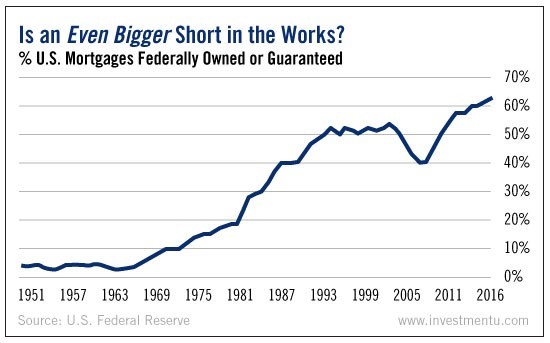
9.The lopsided recovery in the housing market …Working People not Seeing Housing Recovery.
The quarterly economic treasure trove known as the Federal Reserve’s financial accounts of the United States, released in early December, painted a rosy picture of Americans’ finances. Household net worth rose to a new all-time high and home equity rose to just a hair below its level in 2006, before the housing bubble burst, the Federal Reserve data showed.
But missing from the 200 pages of statistics is another story: one that goes much deeper than the usual caveats about national level data failing to capture the granular detail in the real economy lived by ordinary Americans.
“It’s two markets,” Redfin Chief Economist Nela Richardson told MarketWatch.
“There’s some homeowners doing well but there’s a hollowed-out middle class and the homeownership rate is at historical lows. There are some enjoying record levels of equity and some who are locked out altogether. There’s another class who aren’t underwater but are hovering around break-even and weren’t able to refinance.”
Sam Khater, deputy chief economist for CoreLogic, agrees. “What’s unusual about this recovery is that it’s been lopsided. Wealth — home equity and financial equity — have recovered. Incomes have not. One-half of all households have participated in the massive run-up of stocks, two-thirds have participated in the gains from home ownership. The flip side is the inverse, the people who have not participated. How has their recovery been?”
For economists like Richardson and Khater, the Fed’s data does confirm some of the type of recovery housing watchers could only dream about in the depths of the financial crisis.
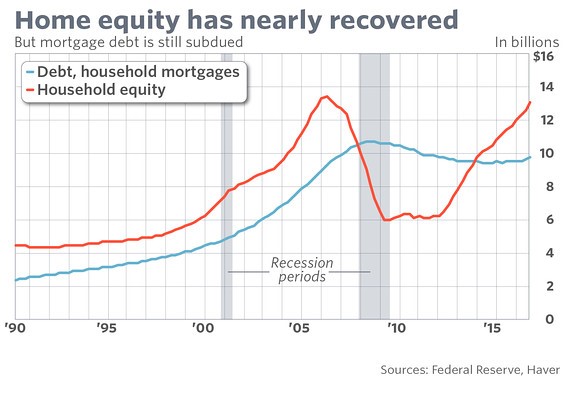
Most importantly, nationwide home equity has nearly recovered, but mortgage debt levels haven’t, a signal that the housing market isn’t allowing lots of borrowers to become as dangerously leveraged as during the bubble years.
Also read: Homeownership is at an all-time low – and good luck getting a mortgage
But while that’s healthy for the overall market, it may mask the many ways individual homeowners and micro economies are being stifled.
It’s worth noting that nearly 4 million homeowners are still in negative equity, according to CoreLogic data.
Also, as Regions chief economist Richard Moody pointed out in a research note, 30% of all owner-occupied households have no mortgage debt at all, meaning that the 50 million households that do have mortgages have less than the 57% equity that’s presented in the flow of funds data roll-up.
Richardson believes some of the twists the mortgage market has taken in trying to address the new reality may not be having the intended effect.
Redfin agents find that low-down payment mortgages are often going not to lower-income people, but high earners who simply don’t have enough savings scraped together yet — or have savings offset by massive levels of student debt, like early-career doctors and lawyers.
That means lower-income people for whom those products would be ideal must compete with buyers who have other advantages, Richardson said.
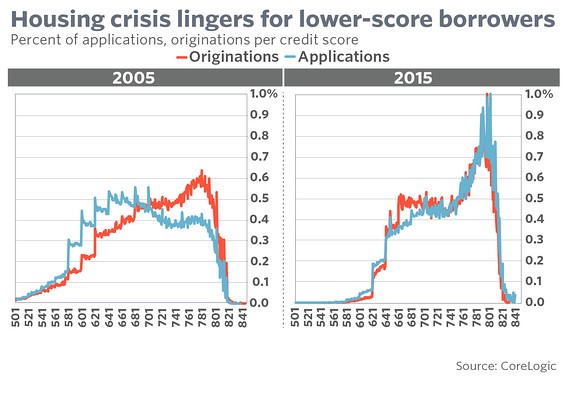
And CoreLogic data shows fewer people with lower credit scores even bothering to apply, Khater said. He believes the impacts of the financial crisis and economic downturn scarred many Americans emotionally – and that’s not going to heal itself any time soon.
“We’ll have a long tail to the most recent recession. It will have a legacy. It will linger in our minds.”
10. 18 ‘healthy habits’ you should give up in 2017
We all have them — habits we think are healthy because we heard them somewhere on the news or from a health-conscious friend. And no matter how much we hate them, we just keep doing them because we think they’re good for us.
Take using BMI to tell whether you’re a healthy weight. Is it really the best measure of fitness?
Or taking a daily multivitamin. Healthy habit or a little bit of nonsense?
The answers to these questions might surprise you.
Using a standing desk
A recent long-term study looking at data on nearly 4,000 US adults found no benefit in terms of overall risk of dying from standing as opposed to sitting.
In the short term, however, standing does burn more calories per minute; so if losing weight is all you’re worried about, stand on!
Using toilet-seat liners
Viruses like HIV and herpes are fragile, meaning they don’t survive very well outside a nice, warm human body. By the time you sit down on a public toilet seat — even one that was recently used by someone else — most harmful pathogens probably won’t be able to infect you.
Plus, your skin is an effective block against any microbes. (Unless, of course, you have a cut or open wound there, which could allow the bacteria to get in.)
Eating only low-fat foods
Your avocado toast misses you.
According to recommendations from the USDA in the 1990s, millions of Americans seeking to lose weight opted for a low-fat, high-starch diet. They chose margarine over butter and “fat-free” instead of “regular,” and they curbed their indulgence on rich, creamy foods. But it didn’t work.
An eight-year trial involving almost 50,000 women, roughly half of whom went on a low-fat diet, found that those on the low-fat plan didn’t lower their risk of breast cancer, colorectal cancer, or heart disease. Plus, they didn’t lose much weight, if any. New recommendations show that healthy fats, like those from nuts, fish, and avocados, are actually good for you in moderation! So add them back into your diet if you haven’t already.
Using BMI to tell whether you’re a healthy weight
Sometime during your most recent doctor’s visit, your physician probably had you hop on a scale to determine whether you were a healthy weight. After weighing and measuring you, he or she might have shown you a colorful body-mass-index chart.
In reality, the BMI, which was invented in the 1830s, is not a great measure of fitness when used on its own. Obesity experts say the BMI has several major problems, including the fact that it ignores two important factors: 1) how much body fat you’re carrying around, and 2) your waistcircumference, which can be a good measure of your risk for certain diseases, including heart disease and Type 2 diabetes.
Avoiding gluten
Unless you’re among the 1% of Americans who suffer from celiac disease, gluten probably won’t have a negative effect on you. In fact, studies show that most people suffer from slight bloating and gas when they eat, whether they consume wheat or not. So go ahead and eat that bagel.
Swapping dairy for almond milk
Alternatives to dairy milk have been surging in popularity in the past few years, chief among them almond milk. Yet almond milk is practically devoid of nutrients.
By themselves, almonds are protein powerhouses. But a typical glass of almond milk, by volume, is just about 2% almonds and contains almost no protein. And all the vitamins inside are added. So if you’re looking for a truly healthy alternative, opt for soy, skim, or low-fat milk.
Juicing
When you juice fresh fruits and veggies, you remove all of their fiber, the key ingredient that keeps you feeling full and satisfied until your next meal.
What you keep is the sugar. In the short term, a high-sugar, low-protein diet means constant hunger pangs, mood swings, and low energy. In the long term, you can lose muscle mass since muscles rely on protein.
Slathering on hand sanitizer
If you wash your hands regularly throughout the day, hand sanitizer is almost entirely unnecessary. Plus, it can’t kill all the germs that plain old soap and water can.
Norovirus and C. difficile, for example, are immune to sanitizing gels.
Eating egg whites instead of whole eggs
An egg-white omelette. Ew.
Lots of people began avoiding egg yolks when nutrition experts came out with a recommendation that eating cholesterol was bad for you because it raised your cholesterol.
But there’s good news: A growing body of research shows that for the vast majority of people, dietary cholesterol (from foods you eat) doesn’t really have much of an effect on your blood cholesterol. So unless you have high cholesterol, ditch those nasty egg-white-only alternatives. Good morning, eggs Benedict!
Holding your breath after someone sneezes or coughs
When people sneeze or cough without covering their mouth or nose, bacteria enter the air at speeds approaching 50 to 200 mph.
If you’re nearby, holding your breath won’t do much good in preventing them from landing on your mouth, nose, or eyes. It’ll stop you from pulling in any bacteria hanging directly in front of your face, but that’s about it.
Taking tons of vitamin C to ward off a cold
While a little extra vitamin C can boost an underperforming immune system, taking too much will make you sick.
The upper limit for an adult is 2,000 milligrams a day. Any more than that will most likely cause diarrhea, nausea, vomiting, heartburn, headaches, and other side effects.
Ear candling
The practice of ear candling — yes, ear candling — involves putting a lit, cone-shaped candle inside your ear. People who do it say it’s helpful for relieving earwax and treating some infections. According to the Mayo Clinic, not so much.
“Research shows,” they write, “that ear candling is ineffective at removing earwax and is also not an effective treatment for any other conditions.” Plus, the practice can end up pushing earwax deeper into your ear. Even worse, you can burn your face, hair, scalp, or ear. So don’t.
Taking multivitamins
Close to half of American adults take vitamins every day. Yet decades’ worth of research hasn’t found any justification for our pill-popping habit.
That isn’t to say we don’t need small amounts of vitamins to survive — without vitamins like A, C, and E, for example, we have a hard time turning food into energy and can develop conditions like rickets or scurvy. Here’s the thing: Research shows we get more than enough of these substances from what we eat, so no need for a pill!
Avoiding MSG
Monosodium glutamate is an ingredient added to many foods to enhance their flavor. It’s safe to ingest.
MSG is often associated with a series of symptoms including numbness at the base of the neck and a general sense of fatigue that are commonly lumped together and called “Chinese Restaurant Syndrome.” Eating too much, regardless of the amount of MSG, is the more likely culprit here.
Not cracking your knuckles
Until recently, it was common knowledge that knuckle cracking was not only annoying but also terrible for your joints. Several new studies have upended that idea, however. Some suggest it might serve as a good indicator that a joint is well lubricated.
Commenting on a recent study in PLOS One, Greg Kawchuk, the lead researcher and professor of rehabilitation medicine at the University of Alberta, said: “Although speculative, we wonder if being able to crack ones joints is a sign that the joint is actually healthy and that the inability to do so could be a sign of joint problems to come.”
Going on a “detox” diet
No one needs to detox. Unless you’ve been poisoned, you already have a superefficient system for filtering out most of the harmful substances you eat. It’s made up of two toxin-bashing organs: the liver and the kidneys.
While our kidneys filter our blood and remove any waste from our diet, our livers process medications and detoxify any chemicals we ingest. Paired together, these organs make our bodies natural cleansing powerhouses.
Using a recumbent bike instead of a regular one
You’ve seen these at the gym — stationary bikes that’ve been revamped to position your body so that it’s leaning slightly backward with your legs outstretched.
Unless you have a specific injury, though, like a shoulder, knee, or hip injury, these types of bikes are unnecessary.
Avoiding the microwave
Desperate times call for stove-top popcorn.Flickr/Bluedot Creations
We’ve all heard the rumors about how “nuking” foods robs them of their nutrients. Fortunately for most of us, this is entirely false. Microwave ovens cook food using energy waves. The waves cause the molecules in food to vibrate quickly, building up their energy as heat.
Of course, some nutrients begin to disintegrate when heated, whether from a microwave, a stove, or something else. But since microwave-cooking times are typically much shorter than oven-cooking times, microwaving something often does a better job of keeping its vitamins intact than other cooking methods.
Bonus: flossing
Flossing became controversial in 2016 after a report from the Associated Press found that the effectiveness of flossing had never been researched.
The US government has recommended flossing for nearly four decades. But according to the Dietary Guidelines for Americans, a set of recommendations the agency sends out every five years, all of the recommendations have to be grounded in scientific evidence.
And flossing is, well, not.
In its report, published in August, the AP says it used the Freedom of Information Act to request evidence for the benefits of flossing from the Department of Health and Human Services. AP never received that evidence. Instead, it got a letter from the government acknowledging that the effectiveness of flossing had never been studied.
http://www.businessinsider.com/health-myths-misconceptions-2016/#using-a-standing-desk-1