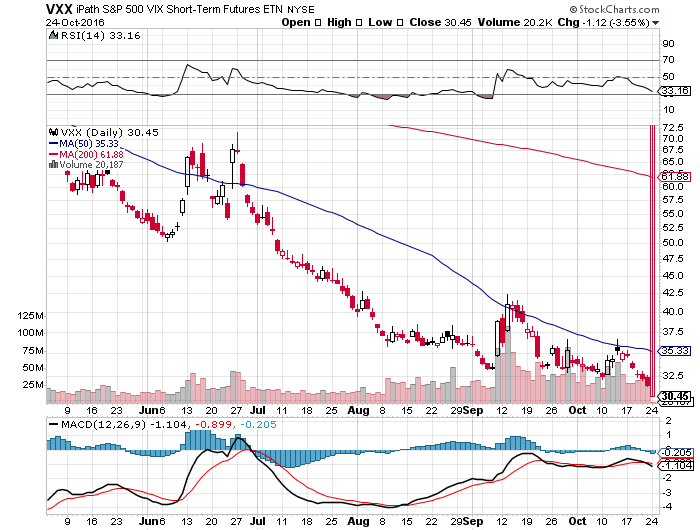
1. VXX Intermediate Term Volatility New Lows….-57% YTD
Fund Summary
The iPath® S&P 500 VIX Short-Term Futures™ ETN is designed to provide investors with exposure to the S&P 500 VIX Short-Term Futures™ Index Total Return. The S&P 500 VIX Short-Term Futures™ Index Total Return (the “Index”) is designed to provide access to equity market volatility through CBOE Volatility Index® futures. The Index offers exposure to a daily rolling long position in the first and second month VIX futures contracts and reflects the implied volatility of the S&P 500® at various points along the volatility forward curve.
https://finance.yahoo.com/quote/VXX?p=VXX
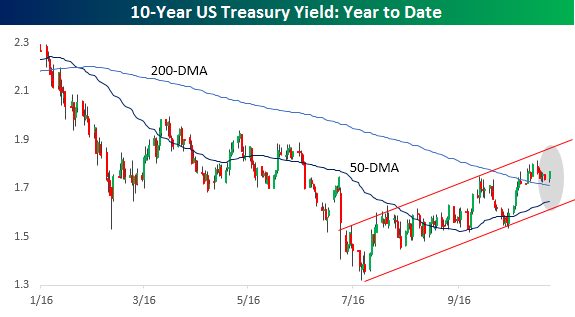
2. Follow up to my 10 Year Comments Yesterday….Watch 1.81% October High.
10-Year Yield Bouncing at Support
Oct 24, 2016
Earlier this month, the yield on the 10-year US Treasury broke above its 200-DMA for the first time since the opening days of 2016. In the days that followed, the yield on the 10-year continued to rise, hitting its highest level since the Spring nearly two weeks ago. Since then, rates have moved sideways with a downward bias. After holding above the 200-day moving average for several days, though, rates are back on the rise today, with the 10-year yield seeing its largest one-day increase in nearly two weeks, rising to 1.77%. If October’s high of 1.81% gets taken out in the next few days, the uptrend in rates will only become more firmly established.
 https://www.bespokepremium.com/think-big-blog/
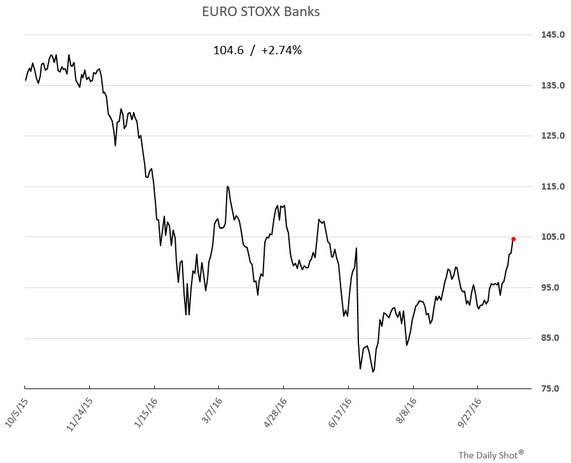
3.European Bank of Day….Banca Monte Lays Off 10% of Work Force….Drops 27% in 20minutes Last Night. Banks in Europe Continue Rally….
The cuts are part of a plan to turn around MPS and attract investments into a €5 billion recapitalisation plan for the lender. The lender’s bad loans have concerned investors, pushing the bank to the brink of collapse. As a result of the new cuts, MPS’ management says it is aiming for a net profit of more than €1 billion by 2019, and a return on equity of around 11%.
As a result of the new plans, the bank’s shares took off in early trade, before crashing sharply mid-morning, moving from +14% to -13% in around 20 minutes. Here’s the chart:
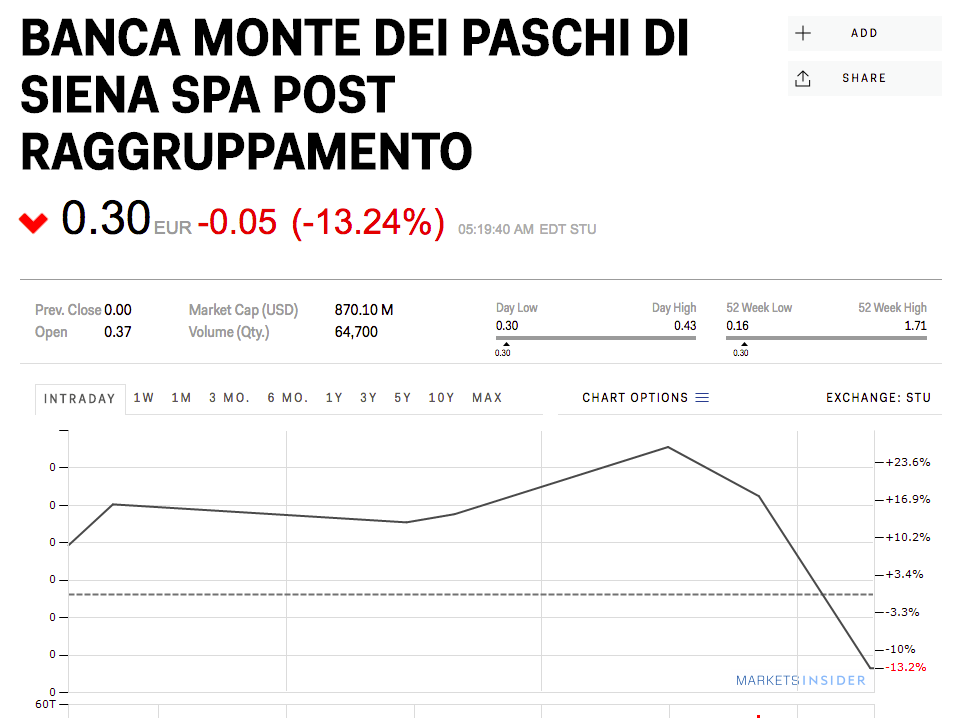
Markets Insider
www.businessinsider.com
Banks across Europe continue to rally – up seven days in a row.
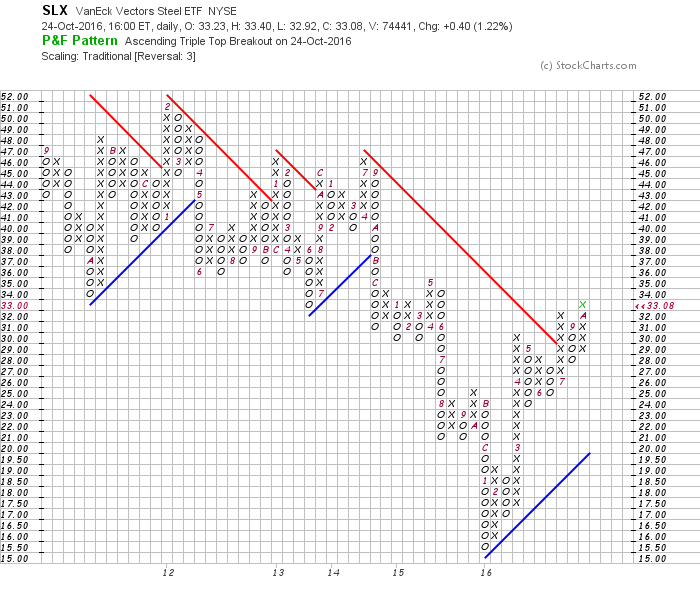
4. Steel ETF +112% Off January Lows….Will we finally see some inflation?
What is this saying about global economy? China?
Iron Ore Limit Up Last Night.
At the lunchtime break, the most active January 2017 iron ore future on the Dalian Commodities Exchange currently sits up a whopping 6%, it’s “limit up” level for the session.
Put another way, it cannot move any higher today based off established market rules — that’s it for the upside until the evening session begins tonight, leaving the only option in the afternoon for prices to go lower.
That is, of course, presuming there’s any brave souls willing to sell into the enormous surge in buying momentum.
It now sits at the highest level since late August.
The moves in iron ore futures are being replicated in other steel-related futures, albeit on a fractionally smaller scale.
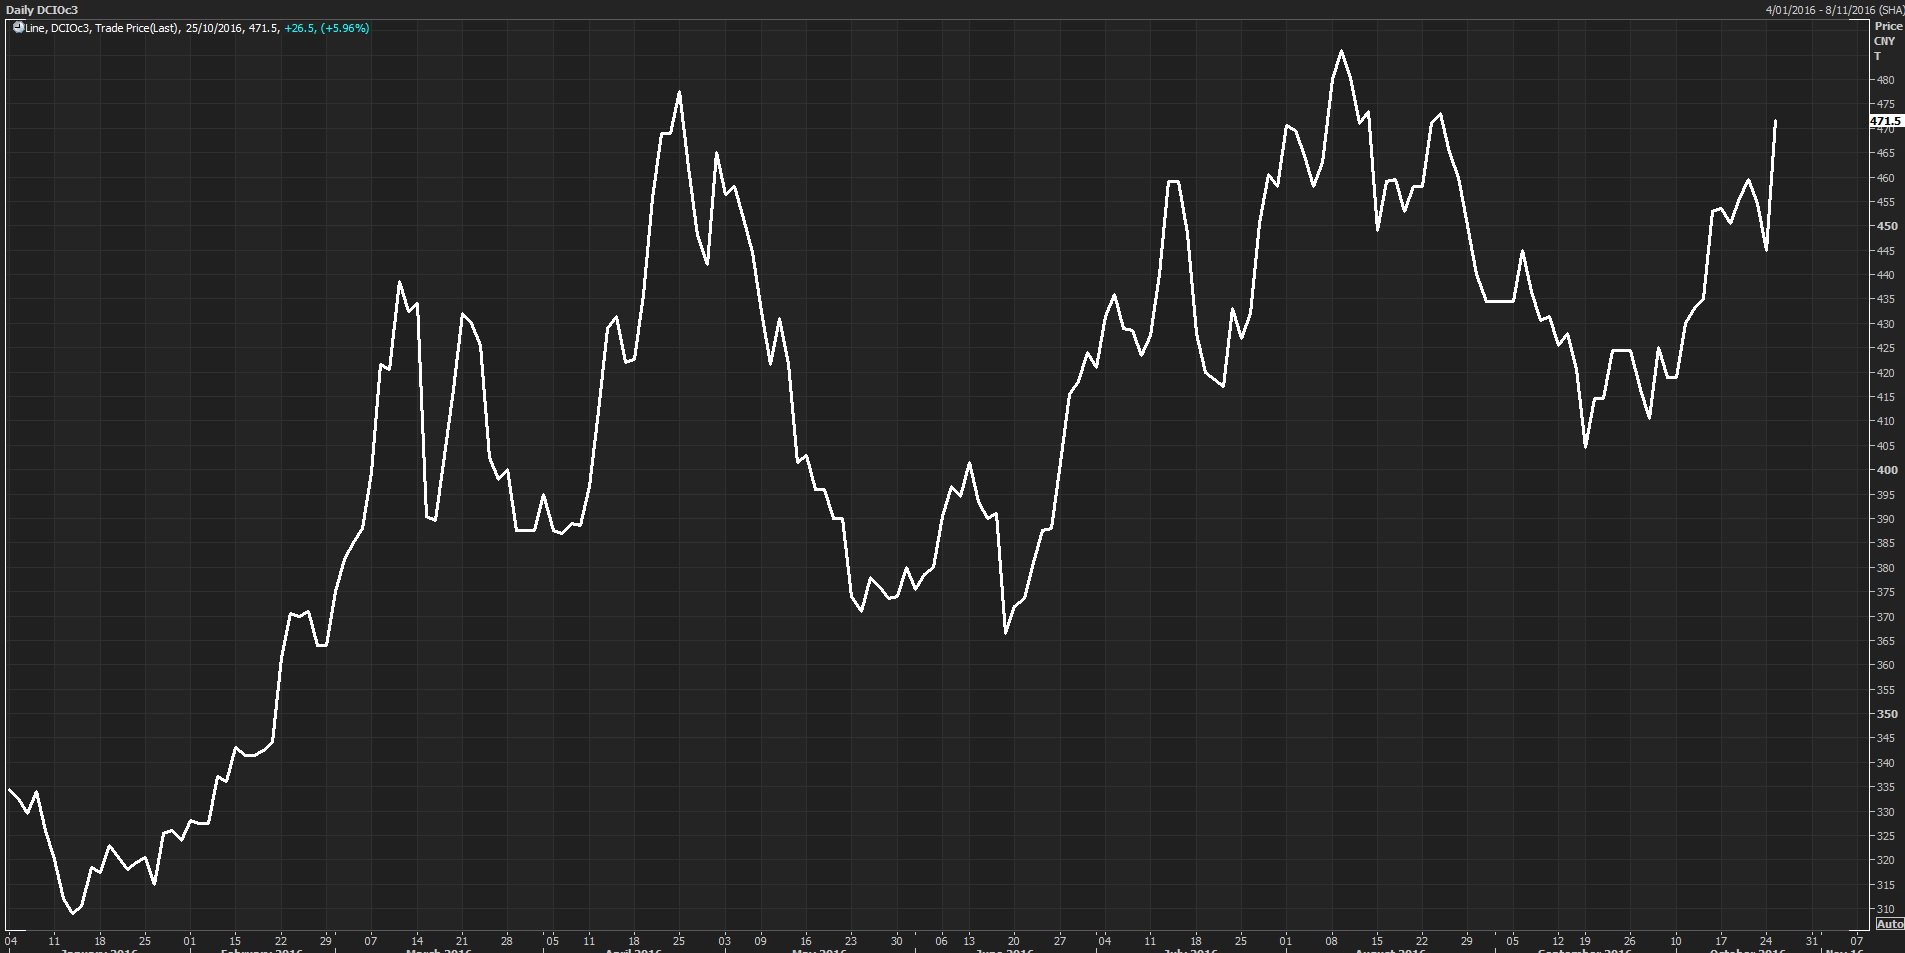
Dalian Iron ore January 2017 Future. Source: Thomson Reuters
5. We Now have 6000 ETFs.
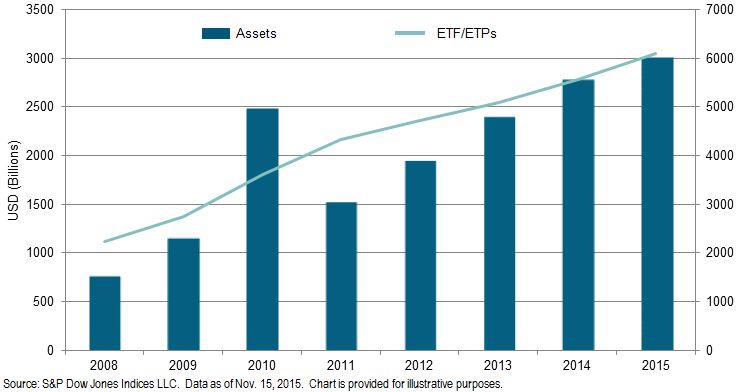
ETF Flows.
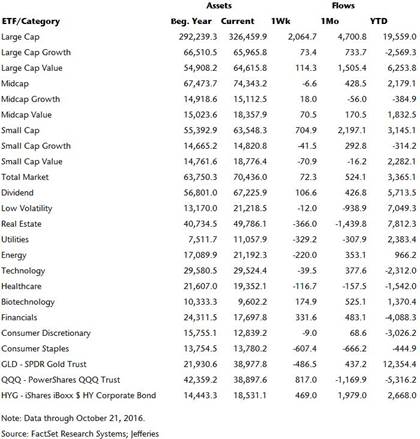
Key Takeaway
Large Cap ETFs continued to see money coming in, taking in over $2B this past week and running up the YTD total to $19.6B. Small Cap ETFs were also popular this week at $705 million and now over $3 billion has come in YTD. We continued to see money come out of Real Estate and Utilities ETFs, but Dividend strategies continue to have inflows. GLD hasn’t moved much since peaking at the end of June with $13.5B of inflows.
What’s Hot:
Over the past week, Small-Cap ETFs had another good week taking in $705 million and QQQ reversed its withdrawals from the previous week taking in $817 million. Over the past month, investors have moved into Large Cap, Small Cap and HYG with inflows of $4.7B, $2.2B, and $1.98B respectively. So far this year, Large Cap and GLD have seen the biggest inflows at $19.6B and $12.3B each.
What’s Not:
Over the past week, we have seen withdrawals out of GLD and Consumer Staples ETFs at $487M and $607M each. Over the past month, the yield trade seems to be reversing with Real Estate, Low Vol, and Utilities ETFs seeing withdrawals of $1.4B, $939M, and $308M come out. So far this year, we have seen the most come out of Financials at $4.1B in outflows.
Steven G. DeSanctis, CFA *, Equity Strategist
(212) 284-2056 sdesanctis@jefferies.com
Miles Bredenoord *, Equity Associate
(212) 336-7341 mbredenoord@jefferies.com
* Jefferies LLC
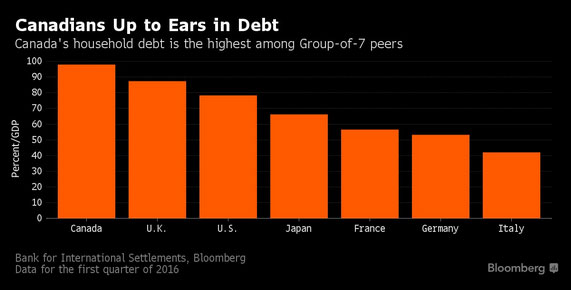
6. Canadian Housing Market Finally Starting to Stumble Hey! Leading not just in Hockey Anymore.
Canada
All is well.
Source: @business; Read full article
7. Past Historical Correlations Get Arbed Away…..
One of the worst things you can do in this business
Posted October 24, 2016 by Joshua M Brown
Your favorite stock; see if it’s a buy, sell or hold opportunity
Investing is hard. This is partly because there is no bedrock to stand upon. Historical relationships between valuation and prices are not firm. Nor are the correlations between Thing A and Thing B.
The ground below our feet is constantly shifting and only the open-minded can make the mental leaps from one regime to the next. Those who choose their one or two Most Important Things to follow religiously and base their views upon (CAPE Ratio, Fed Model, Seasonality, Economic Outlook) are going to find themselves consistently run over in The Street.
One of the worst things you can do in this business is take a given correlation and then extrapolate it out to infinity. Correlations – especially between markets and asset classes – are ephemeral. Sometimes they exist and sometimes they don’t. Sometimes perfectly correlated markets become perfectly inversely correlated.
Think about the stocks / crude oil relationship from earlier this year. Now you see it (and it dominates every day’s discussions), now you don’t (…..and it’s gone).
And no one waves a flag when these relationships are about to shift.
This spring, I posted the below chart – a ratio between emerging market stocks and the S&P 500 vs the US dollar index. You can see how powerful the inverse relationship had been – strong dollar meant weak EM relative to US large caps:
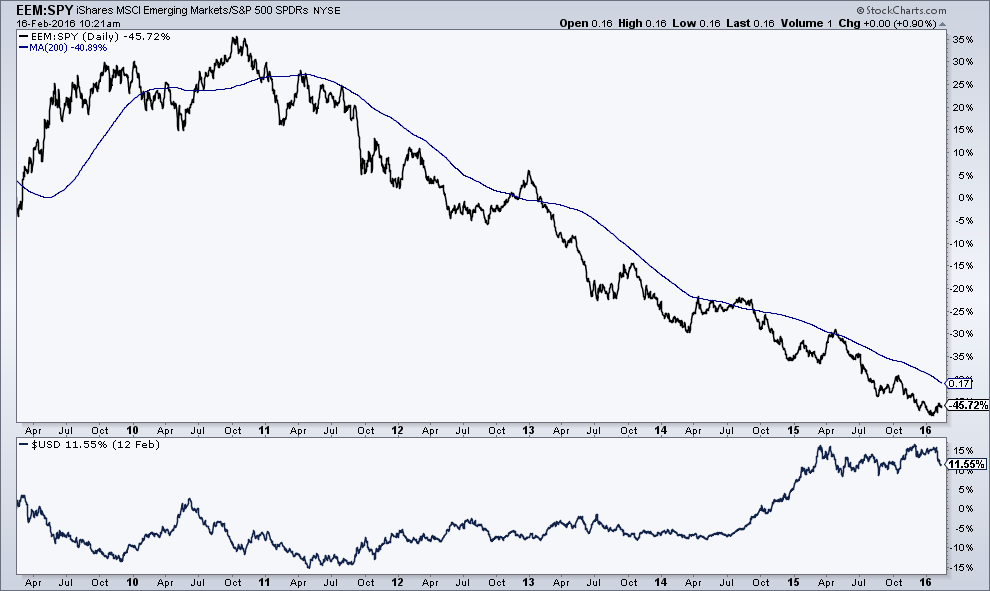
Right after I wrote that, as if on cue, the dollar peaked and then sold off, and EM stocks went crazy to the upside. The relationship held and traders were rewarded for recognizing its power.
Now that’s a trend that seems pretty indefatigable, right?
Except here’s the problem – as too many people become aware of it or start to place their bets on it, the relationship between one thing and the other begins to price all of this “certainty” in. This “common knowledge” then serves to change the relationship or even completely invert it until the prior correlations become unrecognizable.
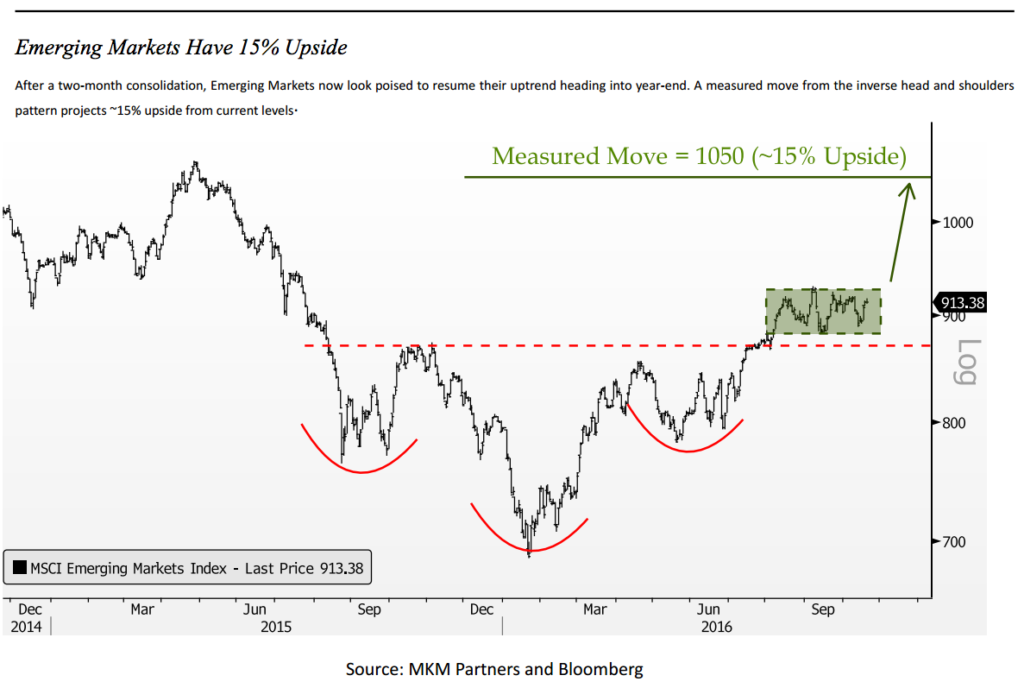
My friend Jon Krinsky at MKM Partners takes a look at the emerging markets rally – now up almost 20% from the May lows – and says that it could have legs regardless of what happens with the US dollar. In other words, the inverse relationship may not necessarily hold as steadily as it has all these years.
Here’s Jon:
 Read Full Story at Josh Brown Blog.
http://thereformedbroker.com/2016/10/24/one-of-the-worst-things-you-can-do-in-this-business/
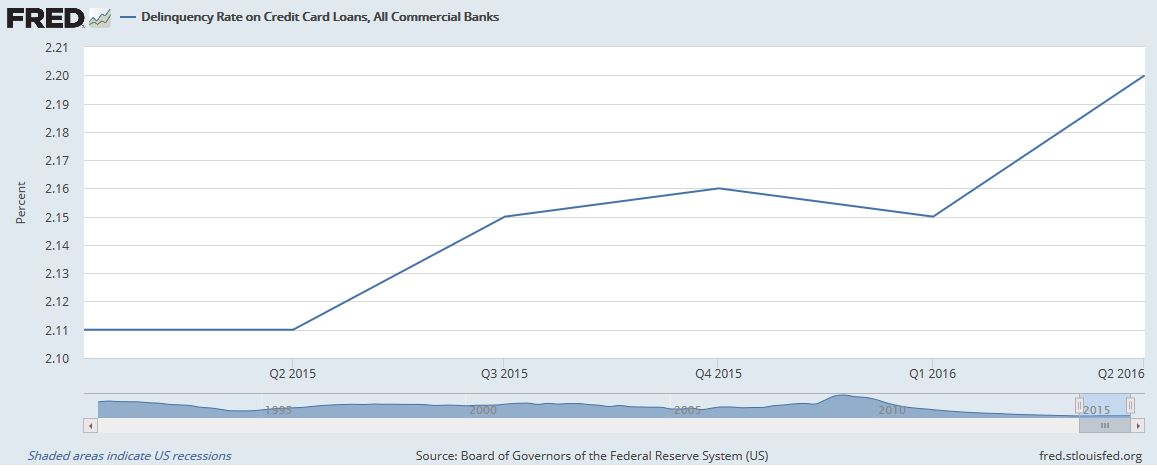
8. Credit Card Delinquencies Tick Up, but they are Coming Off 10 Year Low.
Meanwhile, FRED data reveals that while overall credit card delinquency rates remain at 10-year lows, the trends has been higher over the past several quarters.
Of course, as we’ve noted before, part of the problem is that credit card companies have been forced to compete with the “peer-to-peer” loan providers whose volume has grown exponentially
since tapping into the Wall Street securitization machine
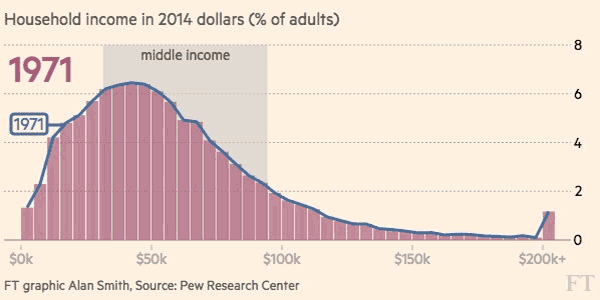
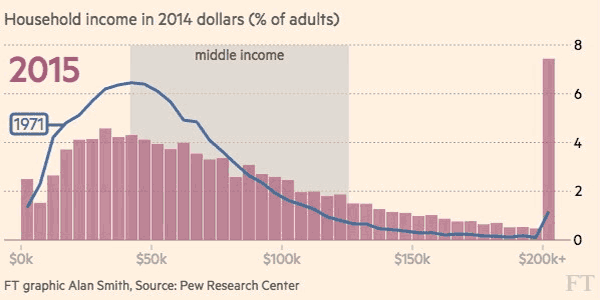
9. The Middle Class Core of American Society Now Represents 50 Percent or Less of Adult Population.
America’s Middle-class Meltdown: Core shrinks to half of US homes
Society splinters as bedrock of postwar economy is ‘hollowed out’
America’s middle class has shrunk to just half the population for the first time in at least four decades as the forces of technological change and globalisation drive a wedge between the winners and losers in a splintering US society.
The ranks of the middle class are now narrowly outnumbered by those in lower and upper income strata combined for the first time since at least the early 1970s, according to the definitions by the Pew Research Center, a non-partisan think-tank in research shared with the Financial Times.
The findings come amid an intensifying debate leading up to next year’s presidential election over how to revive the fortunes of the US middle class.
The prevailing view that the middle class is being crushed is helping to feed some of the popular anger that has boosted the populist politics personified by Donald Trump’s candidacy for the Republican presidential nomination. “The middle class is disappearing,” says Alison Fuller, a 25-year-old university graduate working for a medical start-up in Smyrna, Georgia, who sees herself voting for Mr Trump.
Pew used one of the broadest income classifications of the middle class, in a new analysis detailing the “hollowing out” of a group that has formed the bedrock of America’s postwar success.
The core of American society now represents 50 per cent or less of the adult population, compared with 61 per cent at the end of the 1960s. Strikingly, the change has been driven at least as much by rapid growth in the ranks of prosperous Americans above the level of the middle class as it has by expansion in the numbers of poorer citizens.
https://www.ft.com/content/98ce14ee-99a6-11e5-95c7-d47aa298f769
Found on Barry Ritholtz Blog
http://ritholtz.com/2016/10/sunday-reads-65/
10. 20 Good Habits.