Topley’s Top 10 – October 30, 2020 October 30, 2020 Matt TopleyQuarterly No Comments 1. Earnings Per Share Beats are not Being Rewarded. Goldmannotesearnings beats are not being rewardedand misses are getting sold Continue reading →
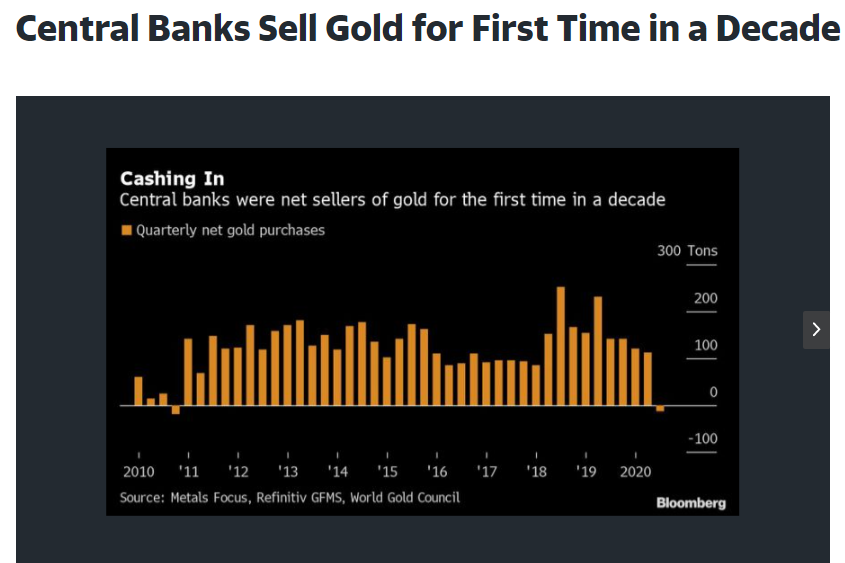
Topley’s Top 10 – October 29, 2020 October 29, 2020 Matt TopleyQuarterly No Comments 1. Central Banks Sell Gold for the First Time in a Decade Eddie Spence Continue reading →
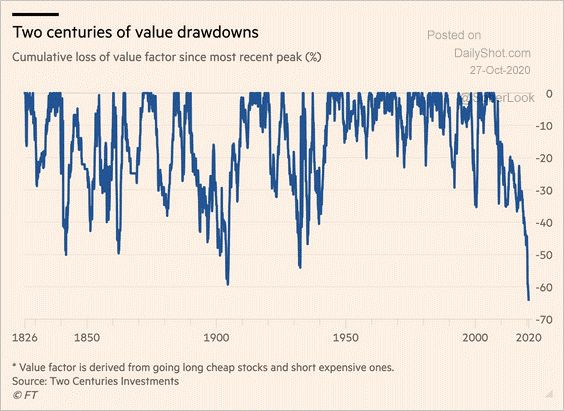
Topley’s Top 10 – October 28, 2020 October 28, 2020 Matt TopleyQuarterly No Comments 1. 200 Years of Value Stock Returns….Biggest Disparity Ever. Continue reading →
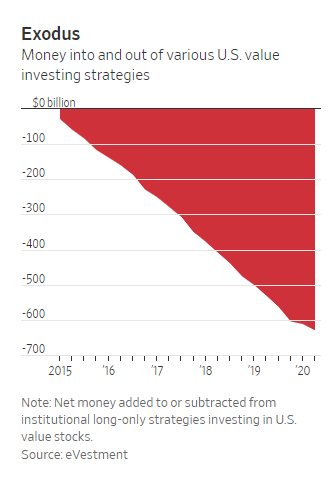
Topley’s Top 10 – October 27, 2020 October 27, 2020 Matt TopleyQuarterly No Comments 1. Money Out of U.S. Value Strategies -600B and Counting. WSJ-By Jason Zweig Continue reading →
Topley’s Top 10 – October 26, 2020 October 26, 2020 Matt TopleyQuarterly No Comments 1. Market Cap of FANGMAN Doubled from March Low Continue reading →