1. VIX Drops 38% Election Week…The Largest Weekly Drop Since Last Presidential Election.
VIX 4thLargest Weekly Drop on Record
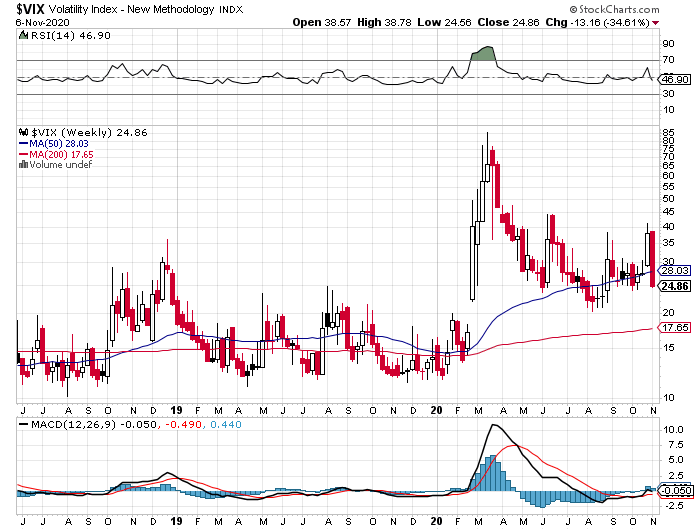
VIX 4thLargest Weekly Drop on Record
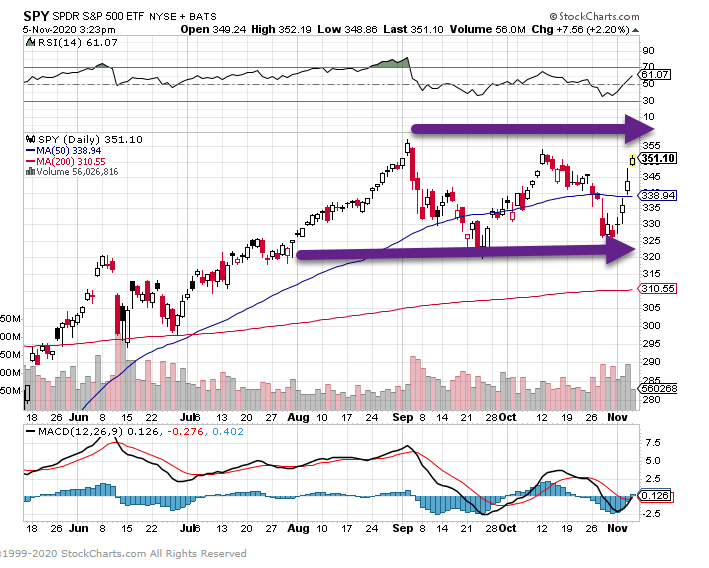
S&P Still Below Sept Highs
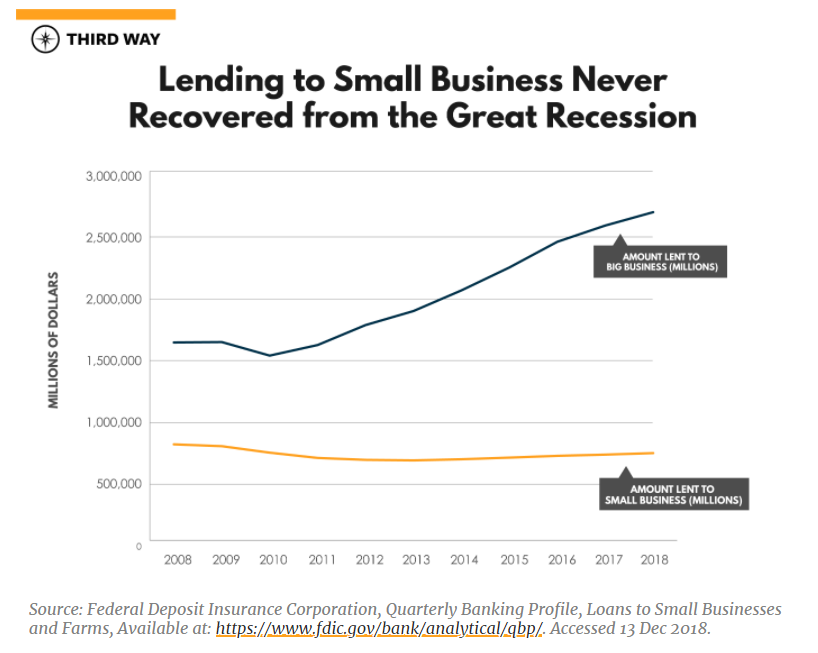
I heard this stat from Joel Greenblatt interview on Masters in Businesshttps://www.bloomberg.com/podcasts/masters_in_business?sref=GGda9y2L
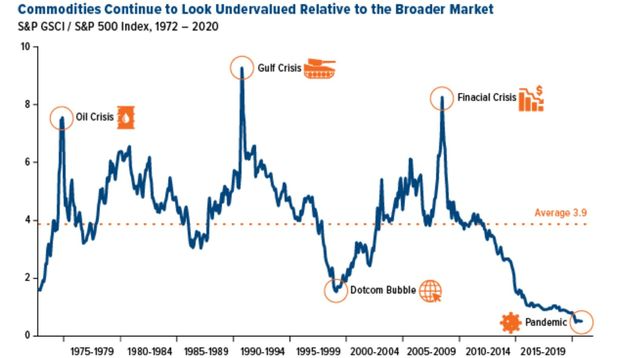
Commodity Index vs. S&P Historical