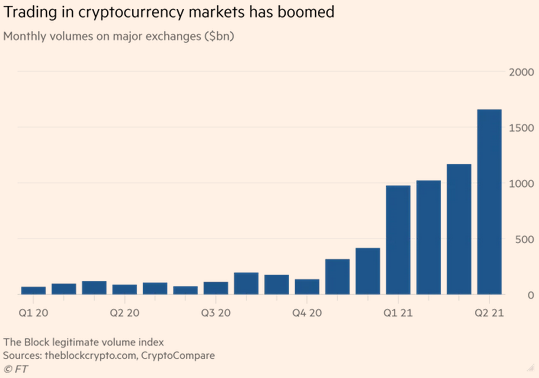
1. One Financial Product Group is not Under Industry Fee Pressure—Grayscale Bitcoin Quasi-Closed End—2 Products $1B in Revenue-Double the Revenue of QQQ
Another product that exhibits this power is the Grayscale Bitcoin Trust (GBTC). To be clear, GBTC isn’t an ETF (it’s a quasiclosed-end fund that periodically offers private placements to accredited investors). It’s not even a product that trades on a U.S. exchange (it trades over the counter and is quoted on the OTCQX).
But it is a product that provides exposure to bitcoin in a way that is valued by investors and at a time in which the cryptocurrency has been on fire. GBTC charges a 2% annual fee, which, when applied to its $36 billion in assets under management, equals revenue of a whopping $756 million.
To put that in perspective, that’s more than double the implied revenue of the Invesco QQQ Trust (QQQ), the U.S.-listed ETF with the largest revenue haul. It’s even more than the combined haul of QQQ and the SPDR S&P 500 ETF Trust (SPY), which together generate $650.6 million in revenues.
If you add the $10 billion Grayscale Ethereum Trust (ETHE) into the mix, Grayscale is pulling in an estimated $1 billion per year from just two products (it has another 12 much smaller products).
For Grayscale to generate close to a $1 billion from just two products—the amount Vanguard takes in from all 82 of its ETFs—is truly impressive. For context, the entire U.S.-listed ETF industry generates revenues of just under $12 billion across almost 2,500 funds, with 56% of that going to BlackRock, State Street and Vanguard.
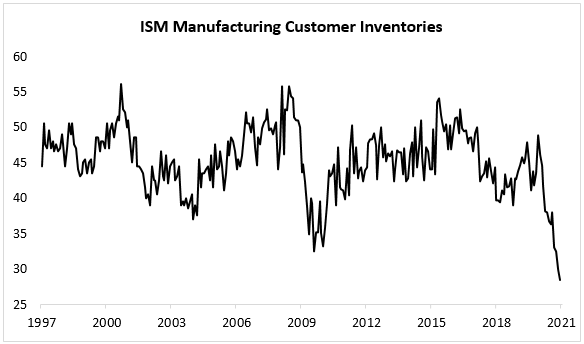
4. ISM Manufacturing Customer Inventories 25 Year Chart….Off the Grid.
Just in time inventory not Covid comeback ready
Source: Jefferies Trading Desk
Percy Allison
Jefferies LLC
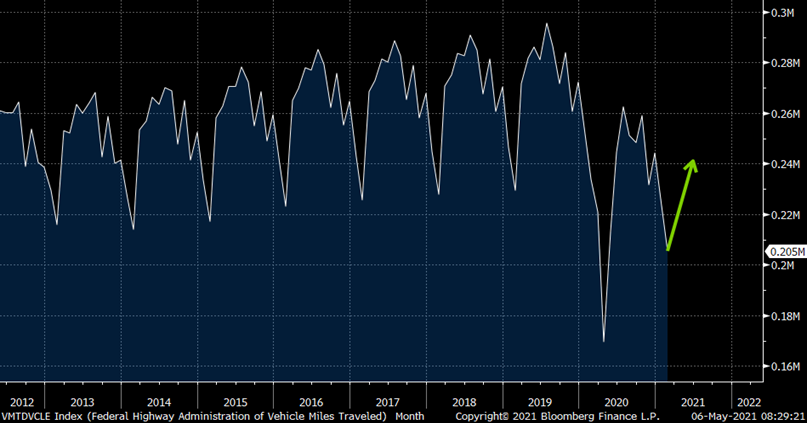
5. U.S. Highway Miles Traveled: 2012-Present (yearly trough in February)
Summer driving season coming off 10 year lows with lockdown ending
6. Tech IPO Proceeds in Europe Closing in on 1999 Bubble.
Tech and internet firms have racked up proceeds of $9.2bn on Europe’s exchanges this year, most for this period since 2000, data compiled by BBG show. And w/more offerings under way, as much as $3bn could be added to the tally in the coming weeks.
Photo Illustration by Rafael Henrique/SOPA Images/LightRocket via Getty Images
The New York Times on Wednesday said it added 301,000 new digital-only subscribers last quarter, its slowest quarter for digital subscriber growth in over a year.
Yes, but: New subscriber growth was weighted much more heavily this quarter towards non-news products than in any other previous quarter in the company’s history. A record 44% of The Times’ new digital subscribers came from non-core news products, like cooking, games and audio, last quarter.
Typically, the percentage of new subscribers from non-news products hovers around 25-35%.
By the numbers: Of The Times’ 301,000 net new digital subscribers added last quarter, 134,000 came from its cooking, games and audio products.
Another 167,000 new subscribers were added to its core news products.
In total, The Times now has nearly 8 million paid subscribers, which is far ahead of even its closest news competitors — The Washington Post and The Wall Street Journal.
The big picture: Times executives for years have emphasized that The New York Times isn’t just a newspaper, but a lifestyle services company.
In the post-Trump news cycle, that focus on lifestyle services has already begun to serve The Times well, offering it a financial cushion when the news cycle is slow.
Bottom line: The Times had a stated goal of reaching 10 million paid subscribers by 2025. Despite a news cycle slowdown, it’s well on its way to meeting that goal ahead of schedule.
1. Perceiving emotions — The ability to identify emotions in self and others. This dimension is fundamental to the remaining dimensions, as it entails the self-awareness and other awareness of emotions that can then inform self-regulatory capacities.
2. Facilitating thought — The ability to understand how emotions can be used to communicate information and, in turn, use that understanding in ways that are context-appropriate. This dimension addresses the idea that it is not enough to be aware of emotions; we must also understand what they mean and how they manifest in unique situations.
3. Understanding emotions — The ability to comprehend how emotions combine and transition and to understand the meaning of such combinations and transitions. This dimension acknowledges that emotions are multi-faceted and fleeting and that some individuals are more adept at understanding these complexities.
4. Managing emotions — The ability to regulate how one’s emotions surface during interactions with others. This dimension is important in that it directly situates the awareness and self-regulatory processes specific to emotions within social settings.
The four emotional intelligence skills
1. Self-awareness — You recognize your emotions and how they are connected to your thoughts and behaviors.
article continues after advertisement
2. Social awareness — You recognize the emotions of others. This manifests as being more empathetic, such that you recognize the needs of others. It can also manifest as being attuned to the socio-cultural dynamics of situations.
3. Self-management — You are able to manage your emotions in ways that are healthy and situation-appropriate. You are able to separate stimulus from response such that you can choose to respond to stimuli in ways that are most appropriate.
4. Relationship management — You are able to develop and maintain relationships with others. You understand emotions well enough to make good decisions when communicating, influencing, and managing conflict.
Takeaway #2: Ability-based EQ and EQ skills are different constructs.
Emotional intelligence skill development
The theory behind EQ skill development is that individuals can proactively think about and act upon the behaviors that allow them to enhance their ability-based EQ. The exercises below are regularly recommended among proponents of skills-based EQ. Note that there is little evidence directly connecting EQ skill development to ability-based EQ. Nonetheless, each of the exercises below is associated with heightened self-awareness and self-regulatory capacities, outcomes that are associated with ability-based EQ.
· Journal — Conduct a daily reflection on your own emotions and your perceptions of others’ emotions. Then consider what you could have done differently to optimize your interactions with others based on those understandings.
· Meditate — Activities such as mindfulness mediation have proven to help individuals become more aware of their emotions. Additionally, such activities are thought to help individuals create more “space” between a stimulus and their response, which increases the likelihood of having an appropriate response.
· 360-degree assessment — Solicit feedback from peers, supervisors, and subordinates on your strengths and opportunities for improvement. This will help ensure you fully understand whether you are successfully navigating socio-cultural norms.
· Create opportunities for external feedback — Consider enrolling in a leadership certificate program or signing up for leadership/executive coaching. High-quality instructors, facilitators, and coaches can apply evidence-based approaches to deepen your self-reflective capacities. Additionally, obtaining third-party assistance can help cut through the biases and political concerns of undergoing such development within an organizational setting.
Takeaway #3: Participating in EQ skills development is likely to increase some of the correlates of ability-based EQ.
Concluding thoughts on emotional intelligence
Perhaps one of the most important steps of social science is constructing definition. Things get messy when conceptualization is loose, and dimensionality is unclear. My hope is that this article helps clarify some of the most common questions about EQ and, in doing so, helps future researchers and practitioners make sound decisions for advancing their initiatives.
Indices that may be included herein are unmanaged indices and one cannot directly invest in an index. Index returns do not reflect the impact of any management fees, transaction costs or expenses. The index information included herein is for illustrative purposes only. Material for market review represents an assessment of the market environment at a specific point in time and is not intended to be a forecast of future events, or a guarantee of future results. Material compiled by Lansing Street Advisors is based on publicly available data at the time of compilation. Lansing Street Advisors makes no warranties or representation of any kind relating to the accuracy, completeness or timeliness of the data and shall not have liability for any damages of any kind relating to the use such data. To the extent that content includes references to securities, those references do not constitute an offer or solicitation to buy, sell or hold such security as information is provided for educational purposes only. Articles should not be considered investment advice and the information contain within should not be relied upon in assessing whether or not to invest in any securities or asset classes mentioned. Articles have been prepared without regard to the individual financial circumstances and objectives of persons who receive it. Securities discussed may not be suitable for all investors. Please keep in mind that a company’s past financial performance, including the performance of its share price, does not guarantee future results. Lansing Street Advisors is a registered investment adviser with the State of Pennsylvania..
SHAREShare Article via FacebookShare Article via TwitterShare Article via LinkedInShare Article via Email
KEY POINTS
For the first time, customers of some U.S. banks will soon be able to buy, hold and sell bitcoin through their existing accounts, according to crypto custody firm NYDIG.
Banks are asking for bitcoin because they can see their customers sending dollars to Coinbase and other crypto exchanges, according to Yan Zhao, president of NYDIG.
After rolling out the initial bitcoin product, NYDIG plans on other services, including debit card rewards paid in bitcoin and a new type of bank account that is FDIC insured, but pays interest in bitcoin, he said.
Bitcoin may be taking another step toward mainstream adoption, CNBC has learned.
For the first time, customers of some U.S. banks will soon be able to buy, hold and sell bitcoin through their existing accounts, according to crypto custody firm NYDIG.
The company, a subsidiary of $10 billion New York-based asset manager Stone Ridge, has partnered with fintech giant Fidelity National Information Services to enable U.S. banks to offer bitcoin in coming months, according to the two firms.
Hundreds of banks are already enrolled in the program, according to Patrick Sells, head of bank solutions at NYDIG. While the firm is in discussions with some of the biggest U.S. banks, many of the lenders that have agreed to participate are smaller institutions like Suncrest, a California-based community bank with seven branches.
“What we’re doing is making it simple for everyday Americans and corporations to be able to buy bitcoin through their existing bank relationships,” Sells said. “If I’m using my mobile application to do all of my banking, now I have the ability to buy, sell and hold bitcoin.”
Until now, bitcoin adopters have relied on apps from a new generation of fintech players like free trading brokerage Robinhood, payments giants PayPal and Square, or crypto-centric firms like Coinbase. Banks, on the other hand, have steered clear of bitcoin for retail customers, only recently announcing plans to allow rich wealth management clients to be able to wager on the cryptocurrency.
But banks are now asking for bitcoin because they can see their customers sending dollars to Coinbase, Kraken and other crypto exchanges, according to Yan Zhao, president of NYDIG.
“This is not just the banks thinking that their clients want bitcoin, they’re saying `We need to do this, because we see the data,’” Zhao said. “They’re seeing deposits going to the Coinbases and Galaxies and Krakens of the world.”
Look at Size of Amazon Web Services Alone vs. Some Market Giants
Let’s look at Amazon Web Services, for example. That segment reported $48 billion in revenue over the last 12 months. AWS is growing 30% a year and has 30% operating margins. Given the market environment, I think a 35x multiple on earnings is reasonable. Apple, for comparison purposes, has similar operating margins but isn’t growing nearly as fast, is trading at 28x earnings. If we assume that AWS’s net income is $15 billion and slap a 35 multiple on that, we get to ~$500 billion, a third of Amazon’s market cap today.
I don’t know what slows down big tech’s growth, but I’m not so sure regulation would do it.
5. Virtual Health Stock TDOC Health Covid Favorite…. Hit Above 300 to Start 2021….$156 Last.
DescriptionTeladoc Health, Inc. provides virtual healthcare services on a business-to-business basis in the United States and internationally. It covers various clinical conditions, including non-critical, episodic care, chronic, and complicated cases like cancer and congestive heart failure, as well as offers telehealth solutions, chronic condition management, expert medical services, behavioral health solutions, guidance and support, and platform and program services. It serves health employers, health plans, hospitals, health systems, and insurance and financial services companies. The company offers its products and services under the Teladoc, Livongo, Advance Medical, Best Doctors, BetterHelp, and HealthiestYou brands. The company was formerly known as Teladoc, Inc. and changed its name to Teladoc Health, Inc. in August 2018. Teladoc Health, Inc. was Incorporated in 2002 and is headquartered in Purchase, New York.
As a former Federal Reserve chair herself, now Treasury Secretary Janet Yellen should have known that her comments about the possibility of a need for an interest-rate hike would send markets into a tizzy, and by the end of the day she had walked back her remarks. No matter, as they’d brought about a classic rotation — the technology-heavy Nasdaq Composite COMP, -0.37% dived 1.9%, while the Dow Jones Industrial Average DJIA, +0.29% actually rose slightly.
What was interesting was that the bond market didn’t follow suit. The 10-year yield on Treasury inflation-protected securities actually fell, to negative 0.81% — nearly a three-month low. It is noteworthy that the market for interest rates didn’t see anything terribly new or interesting in Yellen’s remarks about interest rates. The currency market wasn’t volatile. So maybe the stock market was vulnerable to selling.
Bank of America reports that, of its clients, hedge funds have been “extreme” sellers of stocks. The rolling four-week average flows for hedge funds were the lowest in the history of this series, which dates back to 2008 — and were three standard deviations below the average.
The hedge-fund selling was most concentrated in the communications-services and information-technology sectors, according to the BofA data — i.e., the tech winners that have thrived during the COVID-19 pandemic. Who’s buying? Retail clients were the only group to buy U.S. equities for the third week in a row and have been net buyers for 10 straight weeks, per Bank of America.
Why would hedge funds be getting nervous? Well, the April payrolls report on Friday is expected to be a seven-digit affair, after nearly topping a million in March. Even with Federal Reserve policy makers at pains to dismiss signs of surging inflation, they can’t ignore a rapidly healing labor market, so official data showing a surge in jobs creation will inevitably cause market discussion of when the central bank will pull back on its bond buying.
“As usual, it looks like the connection between legacy ‘duration proxy’ tech sector/’secular growth’ is the risk into the next two months of ‘peak’ U.S. economic data base-effect, with this week’s heavy U.S. data slate culminating in the CRITICAL Friday NFP, which is expected to be a WHOPPING +++ print and is set to dictate the timing of Fed ‘tapering’ socialization,” said Nomura Securities strategist Charlie McElligott.
How whopping? Steve Englander, head of global G-10 currency strategy at Standard Chartered, said a payrolls number in excess of 2 million would scare investors, and anything above 1.5 million would cause “uncertainty.” In other words, the risk is that by Friday, traders might be talking like Yellen did on Tuesday.
In 2007 the World Health Organization declared shift work a probable carcinogen. Yeah, you read that right: working at the wrong time can kill you.
And cancer isn’t the only problem it causes. If horror movies don’t give you nightmares, the list of health problems associated with shift work will. So what’s the deal here?
Shift work messes with your circadian rhythm. Now “circadian rhythm” might sound to some like iffy pseudoscience. Far from it. It has so much credibility that it has incredibility. Michael Rosbash won the Nobel Prize in medicine in 2017 for his work on it.
There are no two ways about it: humans are diurnal. We’re designed to be awake when it’s light out and asleep when it’s dark. Sure, we can be nocturnal but we weren’t built for it and if you stay on that schedule too long, things get wonky.
Well, anyway, good thing we’re not shift workers, right?
Problem is, these days all of us basically are.
From The Circadian Code:Professor Till Roenneberg, a researcher in Munich, surveyed more than 50,000 people in Europe and the United States and found that the majority of people either go to bed after midnight or wake up early with insufficient sleep. Similarly, people also follow different bedtime schedules on weekdays and weekends. This, combined with our bright screen use at night, means we’re all living like shift workers to some degree. And our bodies weren’t built for this. As we discussed in my recent post on exercise, the way we live our modern lives has “some problems” in the same way the Pacific Ocean has “some water.”
Timing matters in life, even more than you think. We’re not talking about clever productivity hacks here; we’re talking about much more important stuff like your health. And biology doesn’t like to negotiate. For your body, “no” is a complete sentence. So what do we do?
Luckily, experts have answers. I went down the research rabbit hole and patched together insights from a number of fancy-pants sources: Satchin Panda at the Salk Institute for Biological Studies, Daniel Lieberman at Harvard, and Andrew Huberman at Stanford. They’re gonna tell us how to get our circadian rhythm back on track for increased health, happiness and productivity.
Let’s get to it…
The Rhythm Is Gonna Get You Every cell and every organ in your body has a clock. And, if things are going right, they’re synced up with the master clock in your brain: the SCN or “suprachiasmatic nucleus.” Think of it like an old school heist movie: “Synchronize watches!“
Because if things aren’t in sync, your body is like a bad symphony. But instead of the bassoon and viola coming in later than they should, it’s your hormones that are out of whack, leading to problems with energy levels, hunger, stress and overall health. This is, as they say, “important.”
Brass tacks: what is the most important factor when it comes to your circadian rhythm? Light. Our ancestors didn’t have a lot of control over light. When the sun rose and set was not a very democratic process. We, however, have unprecedented control over the amount and timing of the light we’re exposed to, leading to unprecedented problems. And this is why we’re all shift workers now.
Okay, clearly not good. So what do you need to do tomorrow morning to fix this? Uh, back up, fella. Tomorrow is too late. Most of the work has to start the night before.
From The Circadian Code:Your performance at any moment during the day is primarily determined by what you did the night before—when you ate and how much you slept—because that is what sets your clock, which then primes your body and brain. Sounds akin to: “All battles are won or lost before they are ever fought.” I guess Sun Tzu was a circadian expert.
(To learn more about how you can lead a successful life, check out my bestselling book here.)
So what do we need to do tonight to get everything back on track? Well, you’ve probably heard some rumblings about the evils of blue light. Actually, that’s only partially true…
Blue Light Isn’t The Problem. All Light Is The Problem. Blue light sends the most powerful signal to your SCN that it is daytime, making it your worst enemy at night — but it’s not the only enemy. After dark, you want to reduce all light as much as possible.
Light at night means less melatonin which means poor sleep which results in a foggy brain the next day. (Researchers have spent many sleepless nights studying this stuff.) Optimally, you want as little light as possible after 8PM. Sound unrealistic? Oh, it is. Hold on, it gets worse.
I regret to inform you that as the day goes on, your retina actually becomes more sensitive to light. Indoor lights and screens that aren’t powerful enough to wake you up and set your clock in the morning are more than enough to screw your clock up at night.
From The Circadian Code:A mere 8 lux—a level of brightness exceeded by most table lamps and about twice that of a night-light—has an effect, notes Steven Lockley, a sleep researcher at Harvard. No, I’m not saying you need to sit around during the evening with your home as dark as a Nietzchean abyss, skulking about like a swampgoblin. I am well aware that nothing short of an EMP blast is going to stop us from watching TV and doing internet ablutions on smartphones. We just need to limit light as much as we reasonably can, and there are tricks we can leverage to help.
The cells in your eyes most relevant to timing are primarily at the bottom of your retina — so you want to reduce overhead lighting. Dim lights set low in a room are a good idea. (And candlelight does not trigger these cells much at all.)
Use the “Nightshift” feature on Apple devices (or the equivalent) to reduce blue light. And if you want to go for the nuclear option, check out Drift TV, which gradually removes blue light from your television screen at night.
I know what some people are thinking: “Oh, that won’t work for me. I’m a night owl.” Ummm, maybe not.
I’ve been a card-carrying night owl my entire life. Everybody talks about the early bird, but I have always lived in fear of being the early worm. Telling me I should go to bed early makes me want to reach for something sharp. I thought it was just how I was wired. Guess what? I was wrong.
Researcher Ken Wright Jr. at the University of Colorado, Boulder, did a study where he took night owls camping. No artificial light. Guess what happened? Yup. In a matter of days they stopped being night owls and were all in bed by 10PM.
Maybe you’re an exception, but to my chagrin, I’m not. Keeping the house dark at night, through some sort of Blakean alchemy, has transformed this night owl into an early riser. You might want to give it a shot.
(To learn how to make emotionally intelligent friendships, click here.)
Okay, light is the number one thing when it comes to getting our clocks right. But it’s not the only thing…
Your Stomach Is Not An All-Night Diner Eating is another signal that tells your body it’s daytime. Also, there’s plenty of research on how healthy “time-restricted eating” is and, yes, it looks like those intermittent fasting folks are on to something. Satchin Panda found that people who got all their calories in an 8-11 hour window and stopped eating 3 hours before bed were notably healthier.
I know, I know — late night snacks are one of the things that makes life worth living. I agree. But if we sacrifice the unmitigated glory of munching after dark, what benefit do we get?
Super productivity and focus.
From The Circadian Code:Studies have shown that both modest fasting and exercise have a similar brain-boosting effect. Each of them can increase a chemical called brain-derived neurotropic factor (BDNF) that improves the connection between brain cells and improves brain function. When you have plenty of BDNF combined with a good night’s sleep, your brain is better prepared for performing complex tasks, staying focused, and being productive, so you can complete the same amount of work in less time. Eating a late-night meal negatively affects your ability to pay attention the next day. (To learn the two-word morning ritual that will make you happy all day, click here.)
Okay, everybody says getting enough sleep is important. Definitely true. But when it comes to your circadian rhythm, it’s not just about the amount…
Be Consistent You need around seven hours of sleep. More for kids, less for older folks. Sleeping notably less — or more — than seven hours is associated with a shorter lifespan.
From Exercised:…numerous studies using better data and sophisticated methods to correct for factors like age, illness, and income have confirmed that people who sleep about seven hours tend to live longer than those who sleep more or less. In no study is eight hours optimal, and in most of the studies people who got more than seven hours had shorter life spans than those who got less than seven hours (an unresolved issue, however, is whether it would be beneficial for long sleepers to reduce their sleep time). But the thing that very rarely gets talked about is consistency. It’s huge. Studies show kids that sleep a consistent amount every night get better grades.
Timing and consistency is a good idea across the board. Having a regular schedule for when you wake up, when you have your first and last meal, when you dim the lights, and when you go to sleep is a powerful combo. Satchin Panda says if any of these factors shift by two hours over the course of a week, it’s an issue. If they all do, that’s a big issue.
(To learn how to live a long awesome life, click here.)
Okay, we have our evenings down. But what’s important when you wake up in the morning? Well, turns out what you do then is the most important factor of them all…
The Most Important Event Of The Day Satchin Panda’s words, not mine: “When (and how) you wake up is the most important event of the day.”
And the key event here is getting bright light in your eyes early to set your master clock. If your only outdoor activity is collecting Amazon packages from your doorstep and you tend to get as much morning light as a mole rat, take note. Live like a Morlock and you’re going to be less chipper, less energetic and the word “metastatic” may be in your future.
From The Circadian Code:In modern times, an average person spends more than 87 percent of their time indoors; we average only 2½ hours outdoors, half of which is often after sunset. Our indoor light environment may be disrupting our circadian rhythm and compromising our mood. So if you forget everything else I have written here, remember this:
Right after you wake up, go outside and get sunlight into your eyeballs.
Yes, you need to go outside. Remember, your retinas are more sensitive at night, meaning they are less sensitive in the morning. You need ~100,000 lux before 9AM. Don’t worry, that only takes about 2-10 minutes depending on how bright it is outside. But digital screens are only 500-1000 lux and that just ain’t enough photons.
It’s important to get this as early as possible to set your clock properly. The relevant cells in your eyes are awfully particular. They respond best to light at “low solar angle.” So once the sun is overhead, it’s not the same. Blue light in the morning is a good thing, so appreciate that morning sky.
No, do not stare directly into the sun. The negative effects of this are obvious: you will be blind and unable to read my future blog posts.
(To learn the 4 harsh truths that will make you a better person, click here.)
So your clock is set. Once you’re firing on all chronological cylinders, when will you be sharpest and most productive during the day?
Best Time For Brain Work You’ll be sharpest between 10AM and 3PM. This is when you want to do your thinky work.
From The Circadian Code:Your optimal brain function is highest between 10:00 a.m. and 3:00 p.m.; that’s when you should notice that your best work or learning is done. Studies have shown that this is the window during which we are in the right frame of mind for making good decisions, solving multifaceted problems, and navigating complicated social situations. Still not feeling awake? Kinda cranky? You may need even more early sunlight. Indoor light isn’t enough to get your brain up to top speed during the day (but it sure is enough to screw you up at night.)
From The Circadian Code:You need at least 1 hour of daylight exposure—being outside, driving in your car, sitting by a window where you can soak up at least 1,000 lux of light—to reduce sleepiness, synchronize your clock, perk up your mood, and stay happy and productive throughout the day. (To learn how to stop being lazy and get more done, click here.)
What about when sunlight isn’t enough? Still tired throughout the day? Well, there’s another powerful influence on your circadian rhythm that can help…
Exercising Keeps The Rhythm Exercise has a huge effect on how well you sleep at night and how energetic you feel the next day.
From Exercised:One survey of more than twenty-six hundred Americans of all ages that controlled for factors like weight, age, health status, smoking, and depression found that those who regularly engaged in at least 150 minutes of moderate to vigorous activity a week not only reported a 65 percent improvement in sleep quality but also were less likely to feel overly sleepy during the day. The most important thing about exercise is just to do it at all. That said, timing still helps. Doing it early in the day improves energy levels and mood but the optimal time is between 3PM and dinner. So, if you can swing it, try to work out between finishing work and eating your final meal.
An intense workout later at night can spike cortisol and mess with sleep, but if you can’t hit the gym earlier, there’s a hack that can help. Eating and exercising primarily alter circadian rhythm by increasing body temperature, so if you do either one late but still want a good night’s sleep, the trick is to take a shower before hitting the sack. This will help your body cool down and get ready for beddy-bye.
(For more on how to motivate yourself to exercise, click here.)
Okay, we’ve covered a lot. No longer can anyone say you don’t have rhythm. Let’s round everything up and learn the secret to how you can enjoy (a little) extra light and screen time at night without wreaking havoc…
Sum Up Timing matters. Here’s what to do:It’s not just blue light, it’s all light: Biology says when the sun goes down, you should too. Do the next best thing: kill overhead lights and dim everything else.Your stomach is not an all-night diner: You want to be eating all your calories in less than half the day and none 3 hours before bed. Apparently, starving in the dark is good for you.Be consistent: Sleeping in on the weekend means you’re doing it wrong during the week. Your physiology does not like an unpredictable schedule and it will seek vengeance.The most important event of the day: Wake up, go outside, and get many many photons into your eyeballs.Best time for brain work: 10AM to 3PM. And this reformed-night-owl writer now finds that’s when I really have a “way with words.” After 3PM, well, uh… not have way.Exercise keeps the rhythm: Best time is after work but before dinner. If you have to work out late, use the shower trick.Yes, you really should do this every day. I don’t make the rules. The only part of life where you get time off for good behavior is prison. That said, there is a trick for sneaking in a little extra screen time in the evening without causing problems.
Stanford University professor Andrew Huberman says getting outside for 2-10 minutes around sunset can help keep your internal clock calibrated. A little more of that low solar angle magic light tells your SCN “must be nighttime” and can help defend against the negatives of evening light.
Yes, medical science insists you enjoy more sunsets.
No doubt, in the modern world, keeping your circadian rhythm humming properly can be challenging. But it’s worth it to feel more energized and happy during the day, to sleep better at night and give yourself a much better shot at long term health. We’re often our own worst enemy, and that also means we’re our own worst victim.
Timing is everything in life but we’re often too focused on the timing of external things when the really important stuff is internal.
So synchronize watches. This heist is an inside job.
Disclosure
Indices that may be included herein are unmanaged indices and one cannot directly invest in an index. Index returns do not reflect the impact of any management fees, transaction costs or expenses. The index information included herein is for illustrative purposes only. Material for market review represents an assessment of the market environment at a specific point in time and is not intended to be a forecast of future events, or a guarantee of future results. Material compiled by Lansing Street Advisors is based on publicly available data at the time of compilation. Lansing Street Advisors makes no warranties or representation of any kind relating to the accuracy, completeness or timeliness of the data and shall not have liability for any damages of any kind relating to the use such data. To the extent that content includes references to securities, those references do not constitute an offer or solicitation to buy, sell or hold such security as information is provided for educational purposes only. Articles should not be considered investment advice and the information contain within should not be relied upon in assessing whether or not to invest in any securities or asset classes mentioned. Articles have been prepared without regard to the individual financial circumstances and objectives of persons who receive it. Securities discussed may not be suitable for all investors. Please keep in mind that a company’s past financial performance, including the performance of its share price, does not guarantee future results. Lansing Street Advisors is a registered investment adviser with the State of Pennsylvania..