1. IPOs enter a bear market in major divergence with “the market”—
Jason Goepfert–From Dean…With the air coming out of some of the more speculative pockets of the market, now is an excellent time to remember the following thought…with great reward comes significant risk.
With IPO, SPAC, Solar, and other speculative stocks down on a peak to trough basis of greater than 20%, let’s see how that compares to the technology bubble in the mid to late 1990s.
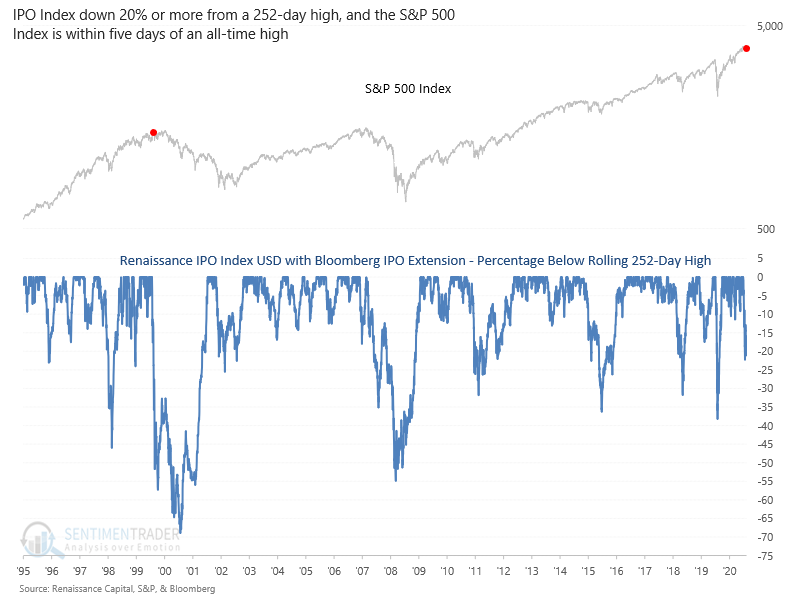
The Renaissance IPO index closed down more than 20% from its most recent high last week even as the S&P 500 was less than five days from a new all-time high. As the chart above shows, this is the second instance in history. With n=2, this isn’t to make any dire predictions; it’s merely an observation.
https://sentimentrader.com/blog/ipos-enter-a-bear-market-in-major-divergence-with-the-market/
Found at Abnormal Returns Blog www.abnormalreturns.com
2.YTD…IPO ETF -7.5% vs. IWO +1.68%
YCHARTS www.ycharts.com

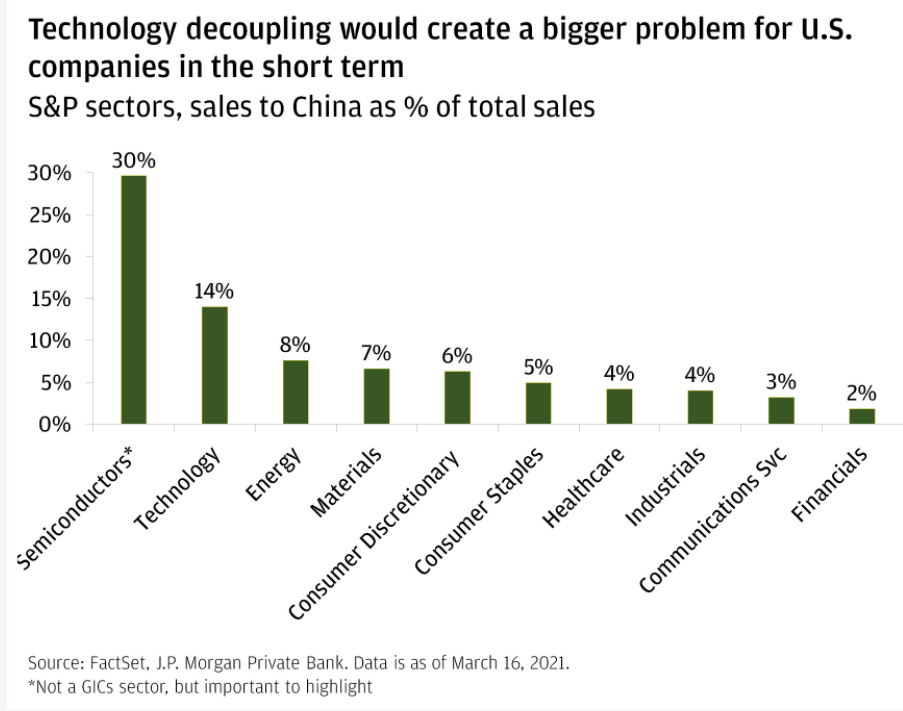
3. S&P Sector Sales to China as a % of Total Sales.
JP Morgan
4.Top Stock Movers Year to Date

https://twitter.com/Convertbond
5. Three Straight Quarters of Increases for 10 Year Yield.
US 10y yield eyes 3rd straight quarterly increase as well as its biggest basis-point advance for such a period in more than four years, BBG has calculated. The question is at what point interest rates become a problem for the broad stock market.
Holger Zschaepitz, @Schuldensuehner

https://twitter.com/Schuldensuehner
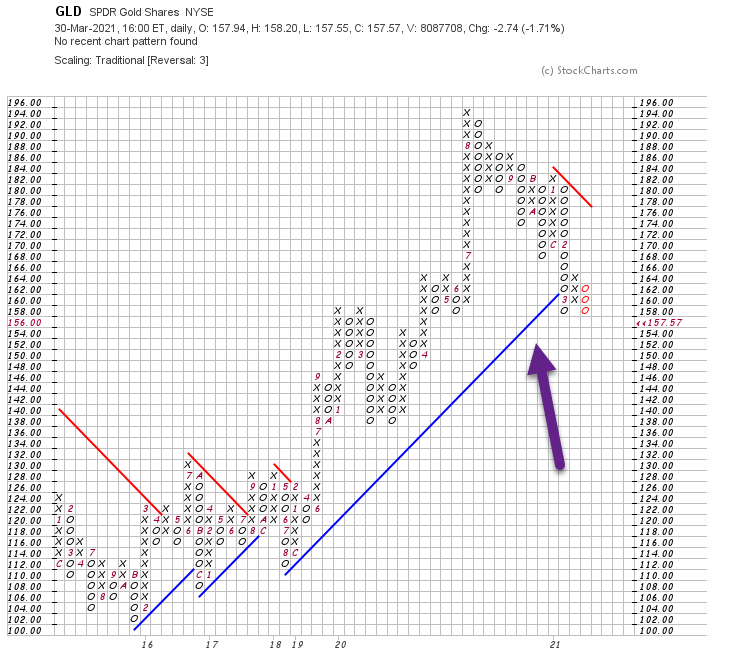
6. Gold Broke a Support Line Going Back to Jan 2018.
See Blue support line broken on chart
7. One Year In: A Look at Saving Rates During the Pandemic
Visual Capitalist
While working hours were reduced across the globe and many lost their jobs entirely, personal saving rates actually increased throughout the pandemic in many countries.
A personal saving rate is calculated as the ratio of personal saving to disposable personal income. Here’s a look at the U.S.’ personal saving rate over 2020.
| Date | U.S. Savings Rate |
| January 2020 | 7.6% |
| February 2020 | 8.3% |
| March 2020 | 12.9% |
| April 2020 | 33.7% |
| May 2020 | 24.7% |
| June 2020 | 19.0% |
| July 2020 | 18.4% |
The U.S.’ personal saving rate skyrocketed in April to more than 30%. After a dip near the end of 2020, the rate has jumped back up again to around 20% in January 2021.
With the most recent data from September 2020, many European countries’ savings rates were up, as well—the highest rate occurred in the Netherlands at 24%. Japan and the UK followed a similar trend as well, at 22% and 28% respectively.
The Pandemic Piggy Bank
Personal saving rates tend to increase during recessions and, more generally, either increase because of reduced consumption or a boost in income.
Without the same access to restaurants, shopping, and travel, it is somewhat unsurprising that a trend of increased saving rates occurred.
In the U.S., many have been putting a larger share of their disposable income into their savings as a precautionary measure. Additionally, while income has likely not increased in most cases, stimulus payments from the government have become much more widespread.
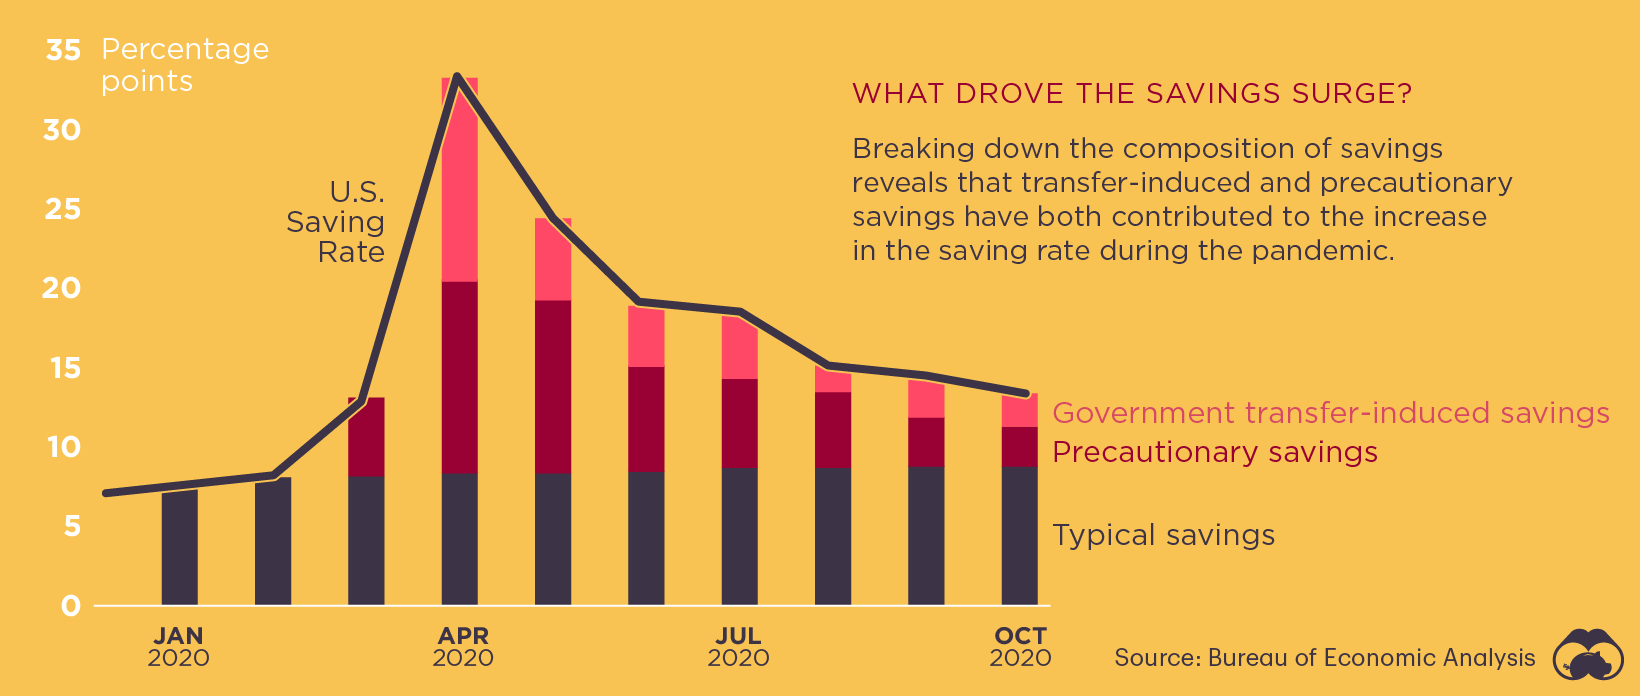
Overall, the typical saving rates have not changed; what has driven up the country’s rates has been prudence and government checks. Whether or not this will influence future consumption or will continue a trend of increasingly large nest eggs, however, has yet to be determined.
The U.S. will likely see an increased inflow of government support, as Joe Biden’s $1.9 trillion stimulus package has recently passed in Congress.
» Want to learn more? Check out our COVID-19 information hub to help put the past year into perspective
https://www.visualcapitalist.com/one-year-in-did-people-save-more-or-less-during-the-pandemic/
8. Hourly Wages Thru Covid.

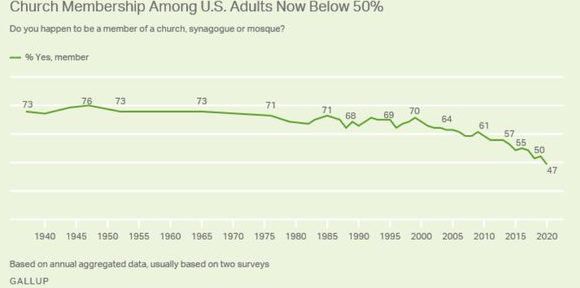
9.For the First Time in American History…Religious church membership falls below 50%…Church, Synagogue, Mosque, Temple.
Thought this was interesting, given the pandemic – Gallup has new numbers out today about religious membership – For the first time since they started asking, fewer than half (47%) of Americans report being a member of church, synagogue or mosque.
From Dave Lutz at Jones Trading
10. A Short Description of Bubble Hype.
The Bubble Hype Cycle–Mr. Money Mustache Blog
- Somebody decides they think the price of something should go up. They share their story of why it should.
- This story catches on and gains influence, so people start buying the object and the price really does go up.
- Other people notice the “great performance” and pile in as well. They believe and reinforce the origin story from #1 above.
- The more this happens, the more it keeps happening. The stakes have become very high for people holding the trinket now, so they reinforce their beliefs with religious zeal (and personally attack anyone who disagrees with their thesis.)
- Newspapers document this circus with no skepticism at all, which lends it credibility. This leads even more people to pile in out of a fear of missing out.
- As earlier expectations are exceeded, the experts make up new, plausible reasons why this new price is justified instead of just admitting that it’s a bubble.
- Eventually, the cycle ends and everything comes crashing back to the ground. Anyone who was smart enough to sell does well, everyone else loses.
- Most importantly: the net effect of all of this bubble behavior was mostly just redistributing money from later buyers to earlier buyers.
https://www.mrmoneymustache.com/2021/03/26/beware-of-the-bubble/
Lansing Street Advisors is a registered investment adviser with the State of Pennsylvania..
To the extent that content includes references to securities, those references do not constitute an offer or solicitation to buy, sell or hold such security as information is provided for educational purposes only. Articles should not be considered investment advice and the information contain within should not be relied upon in assessing whether or not to invest in any securities or asset classes mentioned. Articles have been prepared without regard to the individual financial circumstances and objectives of persons who receive it. Securities discussed may not be suitable for all investors. Please keep in mind that a company’s past financial performance, including the performance of its share price, does not guarantee future results.
Material compiled by Lansing Street Advisors is based on publicly available data at the time of compilation. Lansing Street Advisors makes no warranties or representation of any kind relating to the accuracy, completeness or timeliness of the data and shall not have liability for any damages of any kind relating to the use such data.
Material for market review represents an assessment of the market environment at a specific point in time and is not intended to be a forecast of future events, or a guarantee of future results.
Indices that may be included herein are unmanaged indices and one cannot directly invest in an index. Index returns do not reflect the impact of any management fees, transaction costs or expenses. The index information included herein is for illustrative purposes only.