Topley’s Top 10 – December 9, 2020

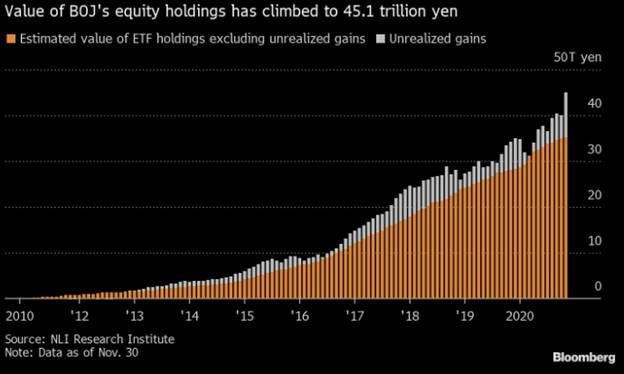
1. Bank of Japan Increasing Equity Buying During Pandemic…….Now Long $400B of Japanese Stocks.

WHALE BUYER– The Bank of Japan has taken over as the biggest owner of the nation’s stocks, with the total value of its holdings climbing well above $400 billion – Massive exchange-traded fund purchases by the BOJ to support the market amid the pandemic this year combined with subsequent valuation gains pushed its Japanese equity portfolio to 45.1 trillion yen ($434 billion) in November.

Continue reading

Topley’s Top 10 – December 8, 2020

1. IPO ETF is +100% 2020.

December is set to be the busiest year-end on record for initial public offerings in the U.S., with DoorDash Inc. and Airbnb Inc. ready to start trading this week in long-awaited listings – The two startups, which are aiming to raise a combined $6.2 billion at the top-end of their price ranges, will propel the month’s IPO volume to all-time high, surpassing the $8.3 billion mark set in December of both 2001 and 2003.  DoorDash upped the price range for its stock in a Friday filing, while Airbnb plans to boost the proposed price range of its initial public offering to between $56 and $60 a share. The IPO ETF is a double in 2020!

Continue reading

Topley’s Top 10 – December 4, 2020

1.#1 and #2 Today…Two Market Indicators…One Stocks Cheap and One Stocks 2nd Most Expensive Ever.

S&P Dividend Yield Versus U.S. Treasuries…Above 1 is cheap

A Favorite Bullish Indicator For Stocks Is Still Flashing Green

Take a look at the chart below that shows the ratio of the S&P 500 dividend yield to the 10-year treasury yield. The ratio skyrocketed because the 10-year bond yield has plummeted, yet the S&P 500 dividend yield has remained relatively steady between 1.8% – 2%.

Continue reading

Topley’s Top 10 – December 3, 2020

1. Asset Classes-Historical Average Vs. Last 10 Years

If not stocks, what else?

What about other asset classes? Take a look at the chart below, which plots each asset’s annualized inflation-adjusted return over the last decade against its long-term average. The asset that performed the worst since 2010, relative to its historical average, was gold, followed closely by international stocks and U.S. bonds.

Continue reading