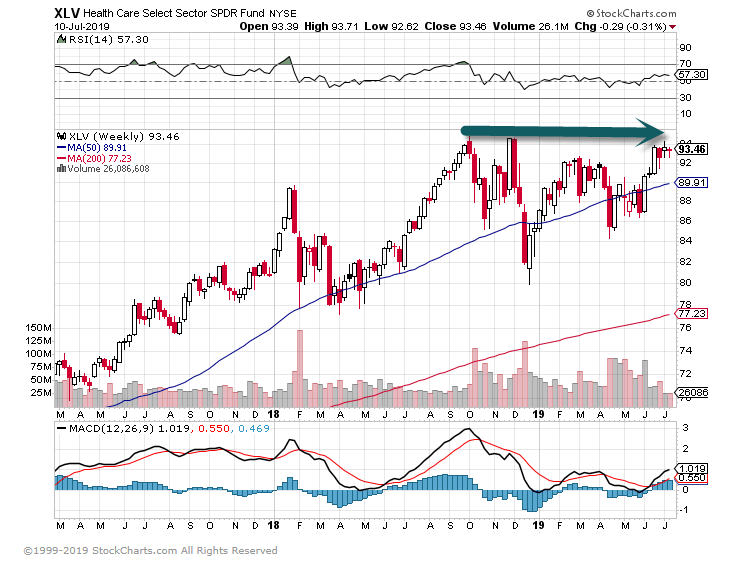
1.Europe Joins the Tech Stock Rally.
Euro Tech Highest in 18 Years.
Among tech companies, SAP, ASML and Ericsson are scheduled to report this week, which might signal what’s next for the shares of Europe’s best-performing industry this year – The region’s technology sector is up 26% in 2019, keeping up with the Nasdaq 100, while the Philadelphia Semiconductor Index SOX has soared more than 30%
Dave Lutz at Jones Trading.
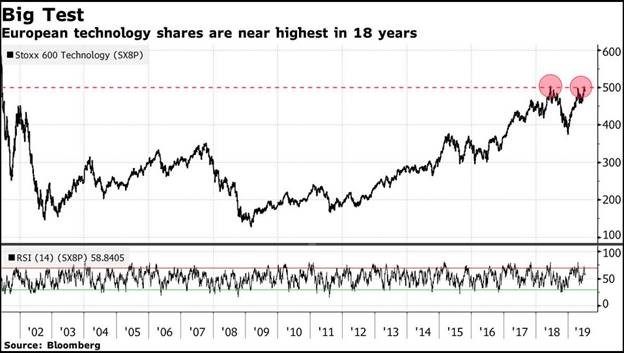
2.P/B and P/E Spreads Touch 1999 Levels for S&P 500 vs. Value.
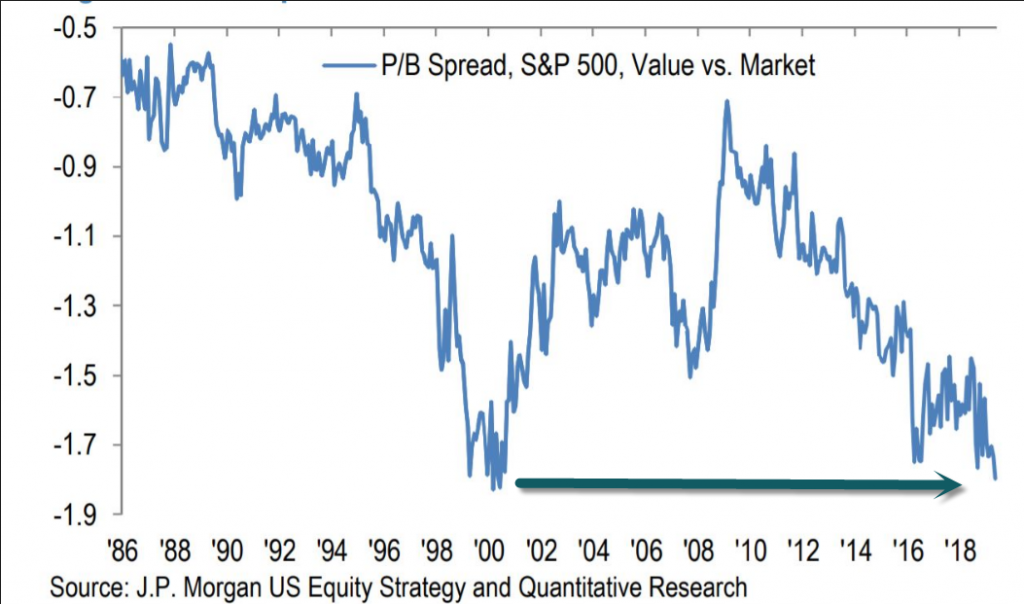
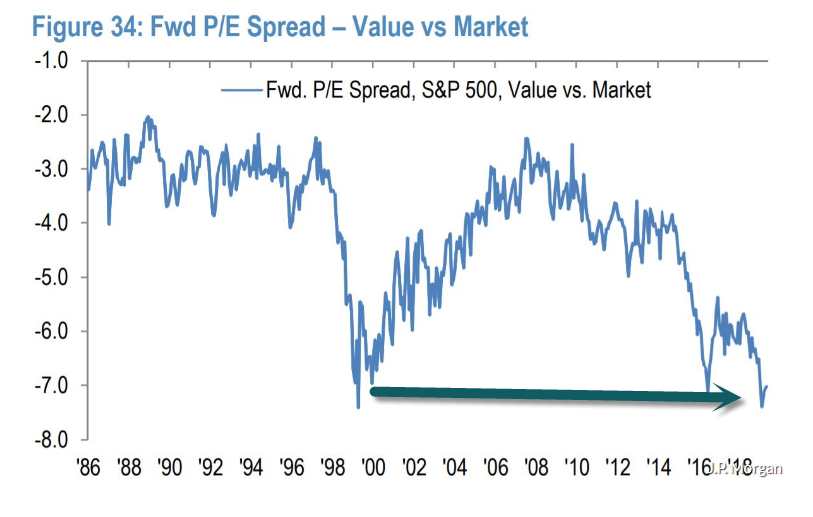
Value stocks are trading at the steepest discount in history
Chris Matthews
3.And No Portfolio Managers Think Above Matters Yet…..2% Think Value Will Outperform Growth.
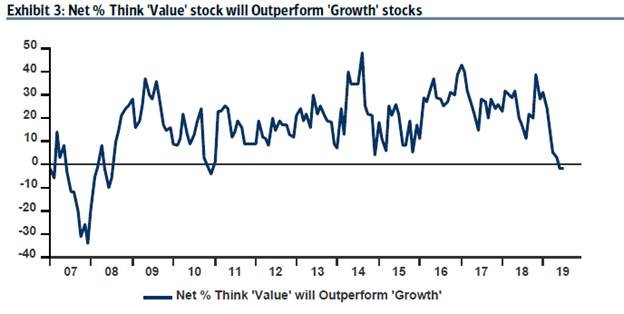
Just 2% of global fund managers think value will outperform growth, and that’s after one of the biggest underperformance in history.
2 Charts Today From Dave Lutz at Jones…Thanks Lutzie
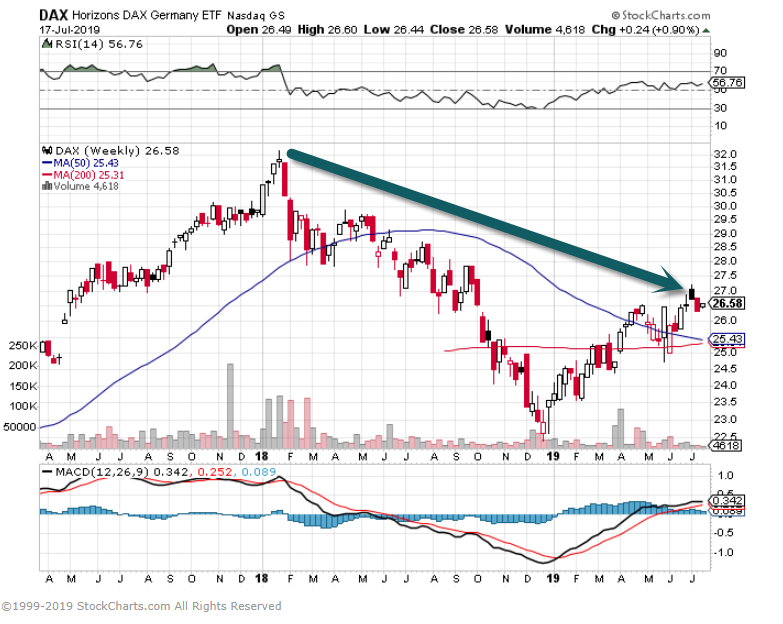
4.Leader of Europe Well Below Highs as Rates in Germany Go Negative.
Negative Rates Not Pushing Germany to New Highs.
5.86% of German Bunds Trade at Negative Yields.
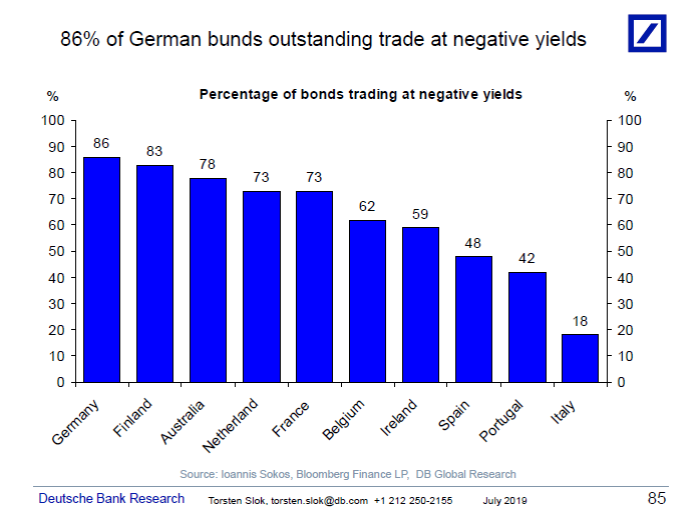
Torsten Slok
Deutsche Bank
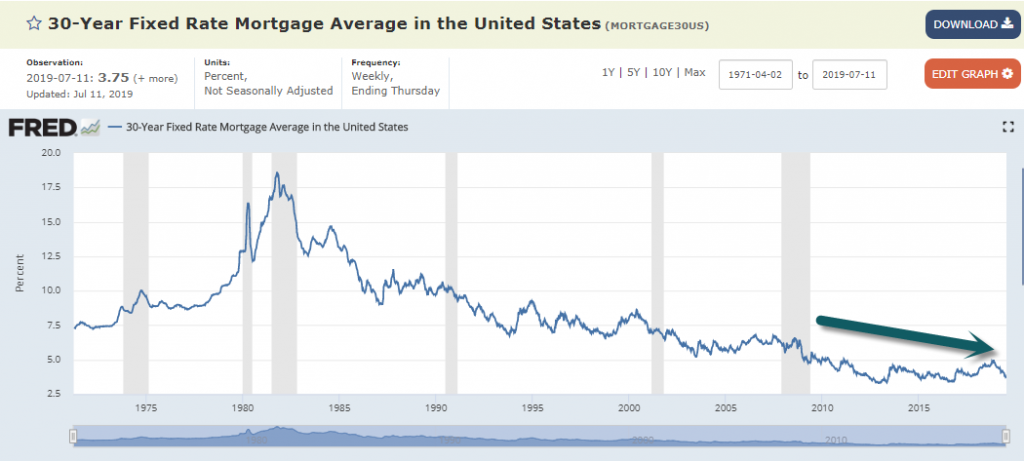
6.New Lows in Mortgage Rates Not Boosting Building Permits


7.Dividends and Buybacks Have Exceeded Free Cash Flow Since 2013
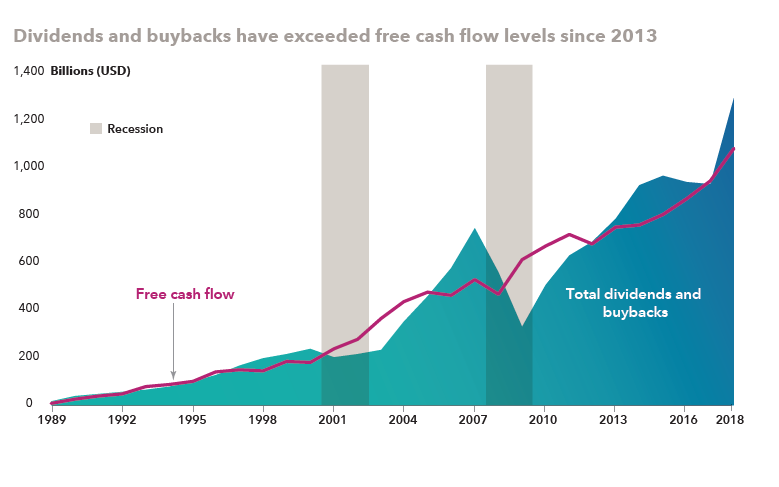
The Capital Group
source: Capital Group. Universe is made up of 2,902 non-financial U.S.-based companies that represent more than 98% of the U.S. public equity market. As of 12/31/18.
https://www.thecapitalideas.com/
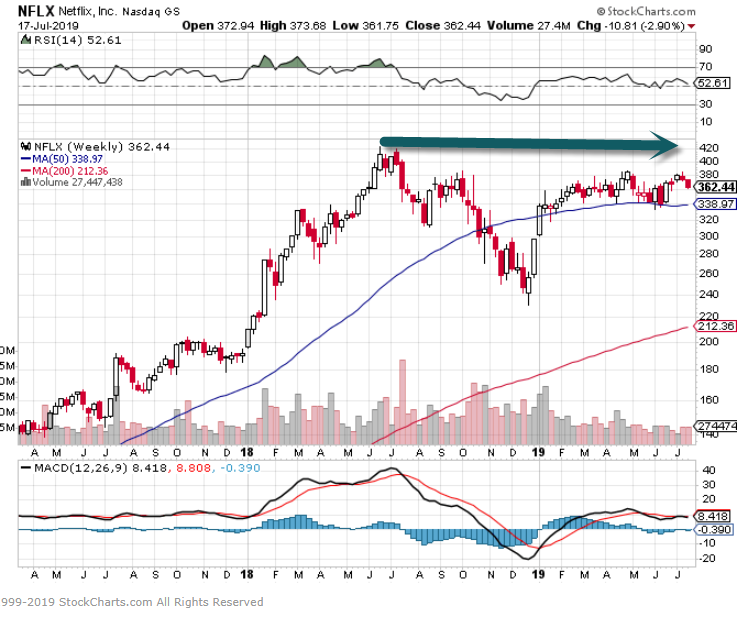
8.Netflix Never Made New Highs in this Rally
Netflix Pullback Yesterday…Never Made New High with S&P
9.The Future of Protein.

Francis Scialabba
While Wall Street is still drooling over Beyond Meat, researchers are looking one step ahead to the next generation of meat cultivation: cellular agriculture.
What it is: Cellular agriculture uses cultures to build cell-based products outside of an organism. This can include animal-derived products, such as meat, eggs, and dairy, as well as byproducts like silk, leather, and fur.
- The foundations—biotechnology and tissue engineering—have already been established in clinical settings (think regenerative medicine). But unlike a “lab-grown” kidney, you don’t have to worry about putting the lab-grown filet mignon into the cow. Just don’t overcook it.
The first hamburger grown in a lab burned the roofs of taste-testers’ mouths in 2013. But it cost $330,000, and that was before guac. Researchers are betting that in a few years, similar meat products will 1) be affordable and 2) taste and feel even more like the “real” thing.
The warm reception of plant-based meat alternatives (like Beyond Meat) is a good indicator of future demand for cellular agriculture products. Consumers want clean, ethical, and sustainable food, and meat farmed in a lab setting could change what it means to be “vegetarian” or “vegan.”
Prepare to debate what counts as meat. Plant-based products have already received pushback from the meat and dairy industries over labeling. Even cauliflower rice has not emerged unscathed.
Actually, let’s debate it right now. Should cell-based, lab-developed meat count as real meat? Vote here.
Boil it down
The promise: Clean, sustainable, safe meat products, without any of the ethical or environmental problems that plague today’s livestock and aquaculture industries.
The roadblocks: Cellular agriculture has never been conducted on a commercial scale or with price constraints. Customers also have to get on board.
The projected timeline: Researchers are betting that in a few years, cellular agriculture-derived meat products will be affordable and taste and feel even more like the “real” thing.
The major players: Meat (Aleph Farms, Mosa Meat, Memphis Meats), seafood (Finless Foods, BlueNalu), and animal-derived products (Clara Foods, Perfect Day Foods, Modern Meadow).
10.In my first year as CEO, I struggled with all of them — but I discovered exactly how to fix each one
Alex Tsepko,
Minutes
- Workplace stress, while commonplace, is incredibly damaging — which means we shouldn’t just accept it.
- Addressing stress will make both your quality of life and your workplace better.
- Ironically, things like too much free time can add to your stress. Dealing with stress is often about focusing on results and planning well.
Last year, my company, Skylum, experienced some tough times. We grew sizably, but we were also navigating new markets and facing unexpected challenges. Ultimately, we had to ask — and answer — some hard questions of ourselves. Today, the company is more successful than it’s ever been. But our year of growth and adjustment also had another side effect: Everyone in the company — myself very much included — struggled with new and difficult levels of stress.
This doesn’t make us unique. According to The American Institute of Stress, 80 percent of employees today experience stress at their job. CEOs and company leaders suffer the most, with a majority reporting feeling regularly overworked, exhausted, and anxious. The problem is so pervasive that it now feels commonplace and almostrequired of working and keeping a good job.
The truth, however, is that workplace stress is remarkably damaging — both to our health and to our general effectiveness in the office.
It’s the ultimate distraction. It tires your brain and prevents you from applying 100 percent of your mental energy to whatever task is at hand.
So if you’re attempting to achieve any kind of goal, stress is something you need to combat rather than accept. Here are the four primary types of stress — and how to manage them.
Stressor 1: Having too much work
Focus on results, and prioritize from there. Nattakorn_Maneerat/Shutterstock
Problem: Company leaders and managers constantly have things to do, along with people who rightfully need our attention and time. Trying to complete all these tasks runs us down and drains our focus and happiness.
Solution: Focus on results, not the workload itself. Many of us — CEOs included — tend to focus on the amount of work we have, as if the number of nights we spend at the office is indicative of our success. Guess what? It’s not. So instead, prioritize your individual responsibilities in accordance with your short-term and long-term goals. This will help you determine what you actually need to do today in order to achieve your most pressing goals. If you have a new product you’re launching in two months, for example, ensuring that launch is successful is likely your most important goal. You should make sure that everything you do furthers your progress in achieving that end. To help you make such determinations, use metrics and data. Then eliminate, delegate, or ignore processes and tasks which won’t contribute to your growth.
Stressor 2: Having too little work
It may seem paradoxical, but more free time can add to stress.funkyfrogstock/Shutterstock
Problem: One of the ways CEOs manage major influxes of work is by delegating tasks. But with delegation comes more free time. I experienced this first hand. As Skylum grew, suddenly I had roughly 70% more free time, and I had to figure out how to best spend it. As I discovered, this can be even more stressful than having too much work; I felt like I wasn’t adding as much value as before, and I feared employees might get frustrated.
Solution: Focus your energy on new and specific goals. One of those goals in my case was building and managing highly effective teams. Sure, I wasn’t running PR and marketing by myself anymore, but I could help ensure those who were now in charge had everything they needed to be successful. Once you’ve identified your new areas of focus, apply yourself to add as much value in those verticals as you can. As you grow, this is what your role as a CEO or manager will always look like: identifying areas of weakness at your company, and then applying yourself to address those as best you can.
Stressor 3: Losing connection with your team
Stay in touch, and stay grounded with outside advice. Shutterstock / UfaBizPhoto
Problem: You always want to stay connected with your team, but as a company leader, this isn’t always possible. I’m reminded of this whenever I’m on the road for long periods. You worry about whether your team will suffer without direct access to their leader. You also worry that without you managing or directing things, productivity, engagement, or happiness might dip.
Solution: It’s threefold:
- Utilize a variety of channels to maintain communication — Slack, email, Skype.
- Identify “opinion leaders” and “influencers” within the company you can partner with to relay your messages and help you manage morale from afar.
- Get feedback from outside sources, such as your family or other founders. Your situation is not unique, so solve it by talking with folks who’ve gone through it before.
Stressor 4: Things not happening as fast as you’d like
It can take time to see progress on big projects. Shutterstock
Problem: This one, again, is especially hard for company leaders; you want things to grow and move along quickly, but often, they don’t. And you won’t always have control over that.
Solution: Take time to reflect and evaluate the effectiveness of each individual component of your company. Determine whether disparate teams are putting in maximum effort toward delivering the result you want. If they’re not, weigh potential solutions, and decide whether those folks may need a bit of a nudge. If folks areworking hard, recognize that sometimes, progress simply can’t be rushed. I find that with big projects, you often don’t see results for more than six months or a year after you start working. So in those moments, turn your attention to something else — something that is in your control and that you can have a tangible impact on.
At the end of the day, stress management is necessary. And the best way to go about doing it is to look at your sources of stress objectively, and work smart to identify solutions. Your solutions may look different than those which I ultimately employed, but I’m confident the methodology will be the same.
Alex Tsepkois the CEO of Skylum Software.
Read the original article on Minutes. Copyright 2019. Follow Minutes on Twitter.