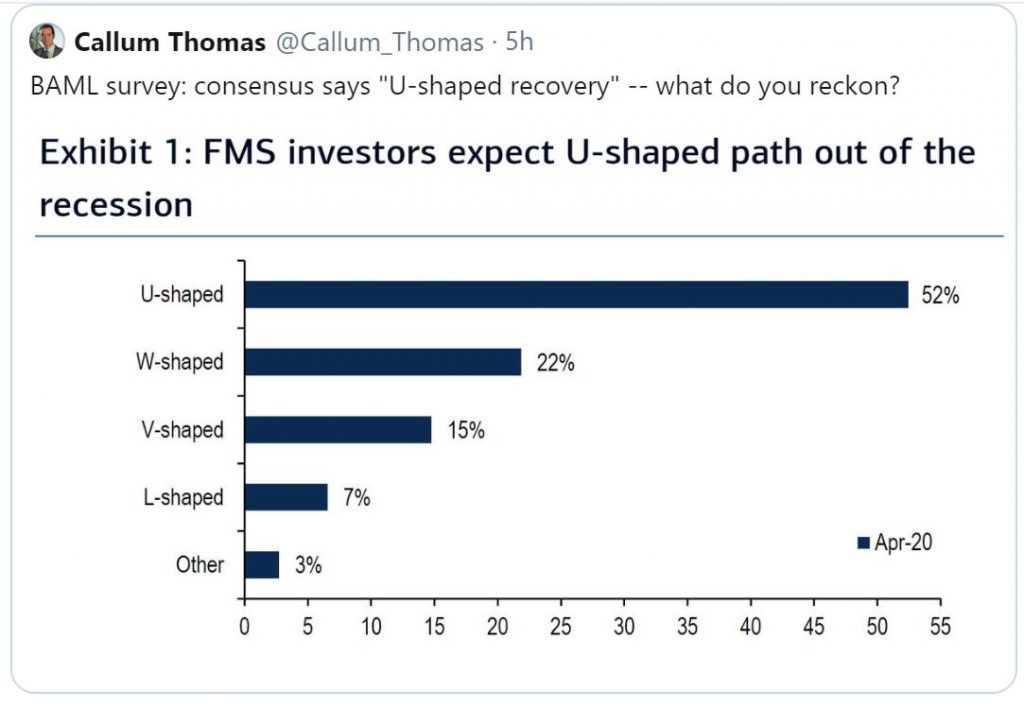
1.The Majority of Investors Expect U
U and W 75% of Poll
Reformed Broker Josh Brown
Reformed Broker Josh Brown
Barrons
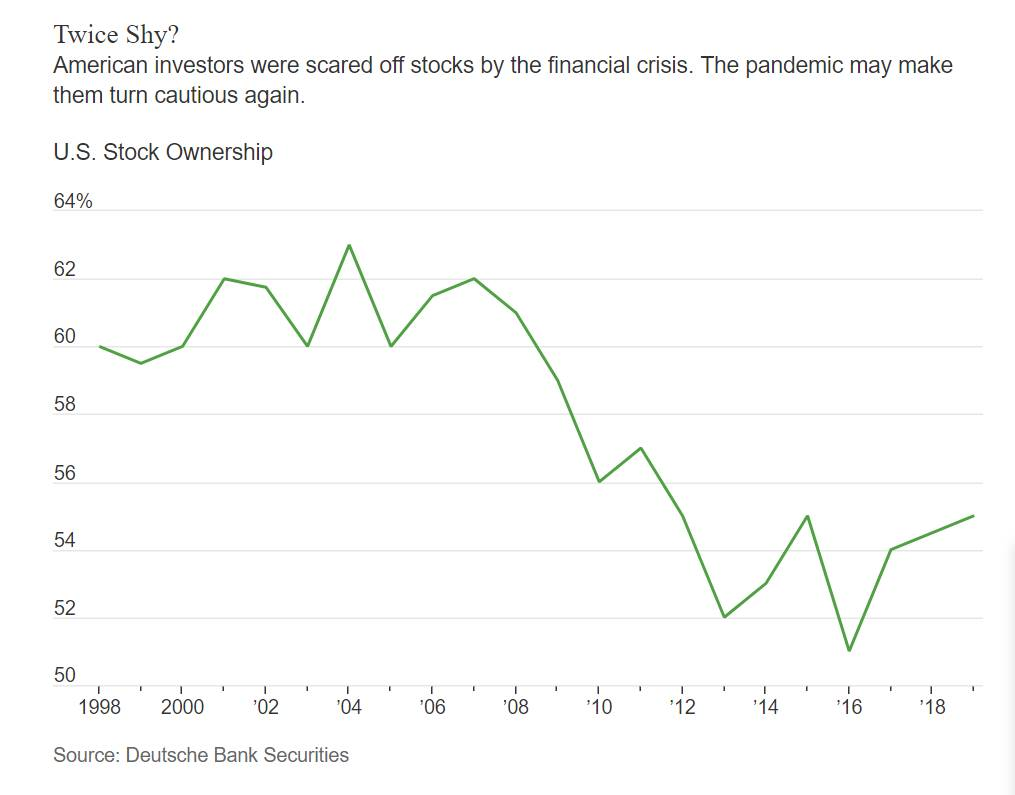
Get Ready for a PostCoronavirus World. The Economy Will Never Be the Same.–By Reshma Kapadia
Continue reading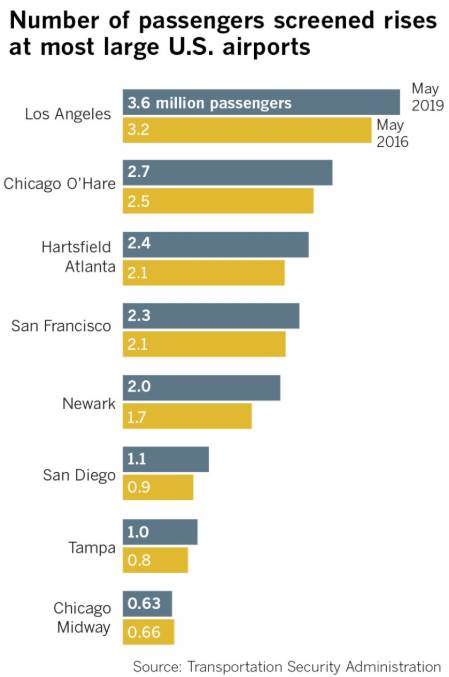
https://www.latimes.com/business/story/2019-08-16/tsa-airport-security-wait-times-drop-lax-analysis
Continue reading
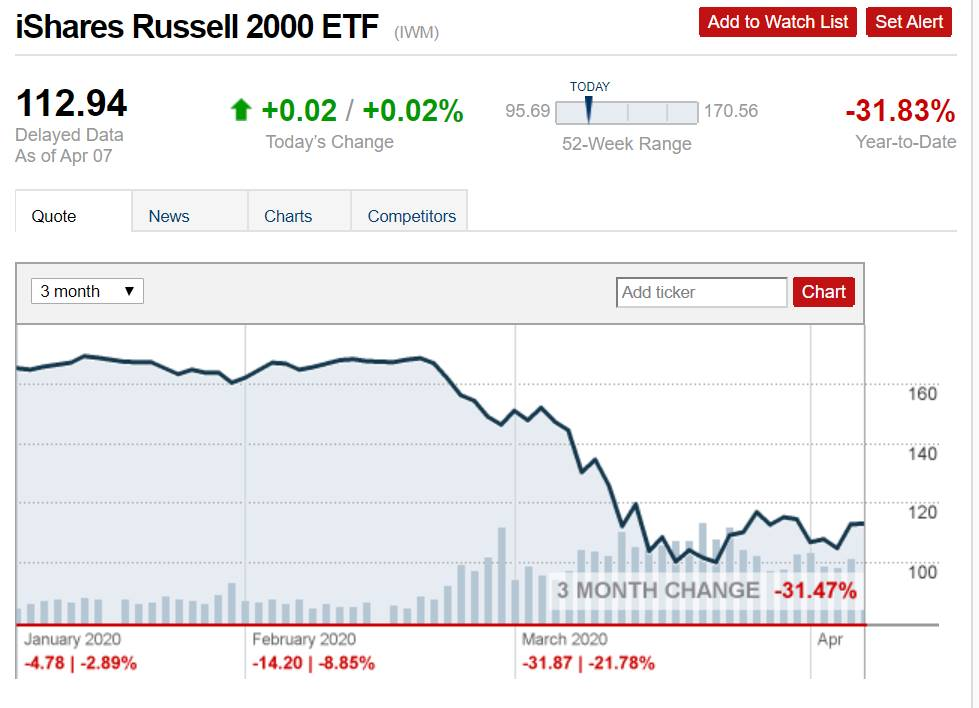
https://money.cnn.com/quote/etf/etf.html?symb=IWM
Continue readingMax Gains During Bear Market

https://www.ssga.com/us/en/institutional/etfs
Continue reading