1.The Market Went from Zero Percent Chance of a Rate Cut to 100% Probability
CME GROUP
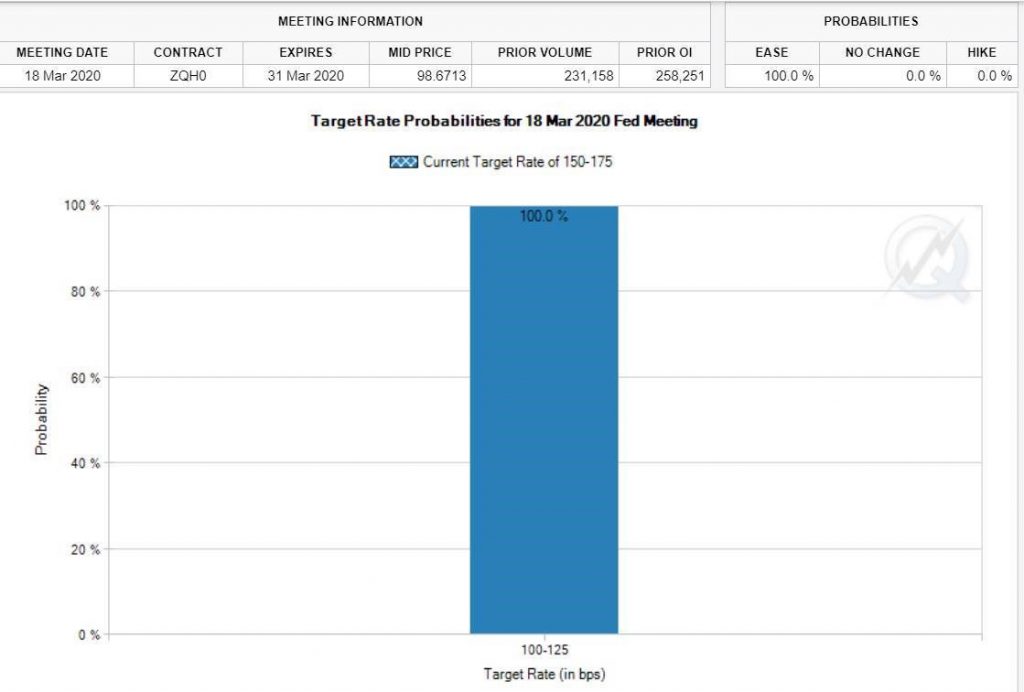

https://www.cmegroup.com/trading/interest-rates/countdown-to-fomc.html
Continue readingCME GROUP


https://www.cmegroup.com/trading/interest-rates/countdown-to-fomc.html
Continue reading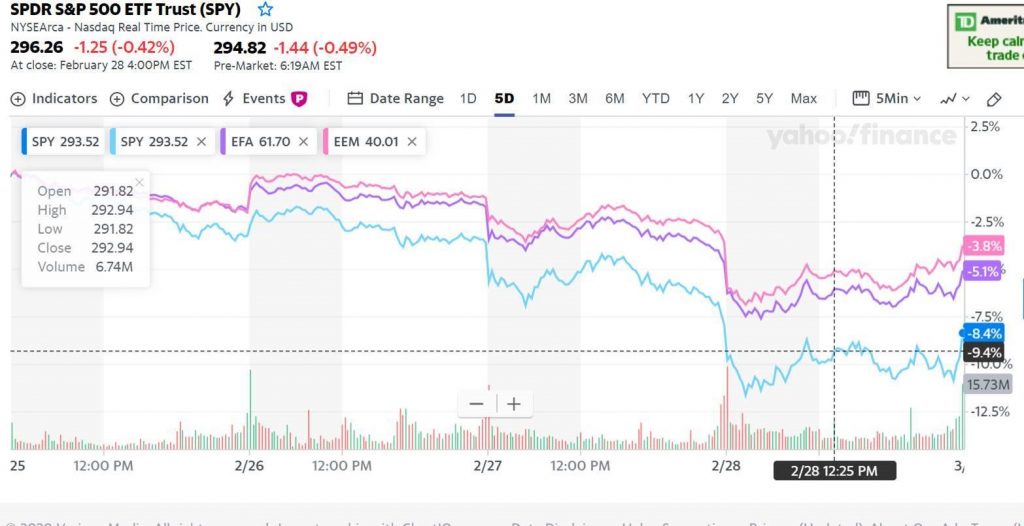

Brian Westbury-First Trust Economics Blog
Much
of the pessimism surrounding the virus focuses on the Chinese under-counting
the number of infected to save face. However, it’s important to note that a
shortage of specialized test kits has caused health officials in many countries
to rely on observable symptoms for diagnoses, and because coronavirus mimics
the flu and pneumonia in its early stages, it’s also possible that authorities
may be over-counting as well.
Instead of looking at it from a total confirmed case perspective, we think the
number of total active cases provides a better look into what is happening.
This measure takes total confirmed cases and subtracts deaths and recoveries.
This gives the total amount of people who have the potential to spread the
virus further.
According to Worldometer, which
aggregates statistics from health agencies across the world, total active cases
peaked about a week ago at 58,747 and have since been declining. Even with all
the new cases we are seeing in South Korea, Italy and Iran (where data is
suspect). There have been 30,597 cases with an outcome (2,699 deaths and 27,898
recovered). In other words, the total active cases now stand at 49,923, a drop
of 15% from the peak on February 17th.
One death is too many, but to put that number into a little bit of perspective,
according to the World Health Organization, in the United States alone for the
2019-2020 season, there have been at least 15 million flu illnesses, 140,000
hospitalizations and 8,200 deaths. Imagine if everyone with an internet
connection followed the spread of this annual flu, case by case, hour by hour.
It’s true that the death rate from Coronavirus appears to be around 2% in
China, which is much higher than the death rate from the normal flu, but like
the flu increases with age. However, outside of China the death rate is far
less than inside China, roughly 1%. And, there is already a drug that will
combat COVID-19 moving toward first phase clinical trials. It took three months
for this to happen in 2020, versus 20 months for SARS back in 2002/03 – a
testament to advances in drug technology.
From a macro-economic point of view, the real question is how will this impact
the US economy over the coming year. In short, our view has not changed. The US
we believe is relatively insulated, with a fantastic health system. The US
started the year with solid economic data and so far, nothing has changed. In
fact, with all the data we already have on hand, we are expecting around 2%
growth in Q1. Most of the impact to the US from the corona virus will come in
Q2.
Capital goods exports to China along with imports from China are sure to be
depressed given the struggles to reopen factories abroad. Most Chinese
factories are still only operating at about 50-60% of capacity. Shipping giant
Maersk has already said it has cancelled more than 50 trips to and from Asia.
With China being home to seven of the world’s busiest container ports there is
bound to be some impact. Inventories in the US will be depleted more rapidly,
but once the virus subsides, expect faster accumulation of inventories in the
second half of the year.
Revenues and earnings from companies that are highly exposed to China will
definitely be affected. China being shut down for a month will have a global
impact. But lower earnings in the first half of the year should be made up by a
strong rebound in the second half of the year with payback from lost months.
Demand remains strong and there has been no visible impact yet on the job market
as shown by initial unemployment claims. Supply disruption is the issue. We
suggest looking through any earnings weakness as we expect it to be transitory.
One small nugget of good news is that many companies had already been shifting
supply chains from China due to the Trump Tariffs. If they weren’t considering
it before they will be now as they realize the importance of diversification.
Expect this trend to accelerate moving forward.
The US consumer is on solid footing and will continue to be one of the key
drivers to US economic growth in the year to come. We believe, just like all
the other viruses we have seen over the past decades that have dissipated, the
Coronavirus will be no different. Some have suggested that the 1918 Spanish
Flu, which killed hundreds of thousands in the US could happen again. No one
knows, but 2020, is not 1918. Technology and news move much faster and the US
rebounded from the Spanish Flu when all was a said and done. We suspect that
any drop in earnings or economic activity will be short lived, and more than
made up for in the year to come. Don’t panic, stay invested.
Brian S. Wesbury – Chief Economist Robert Stein, CFA – Deputy
Chief Economist
https://www.ftportfolios.com/retail/blogs/economics/index.aspx
BABA Alibaba Holdings

Tencent Holdings

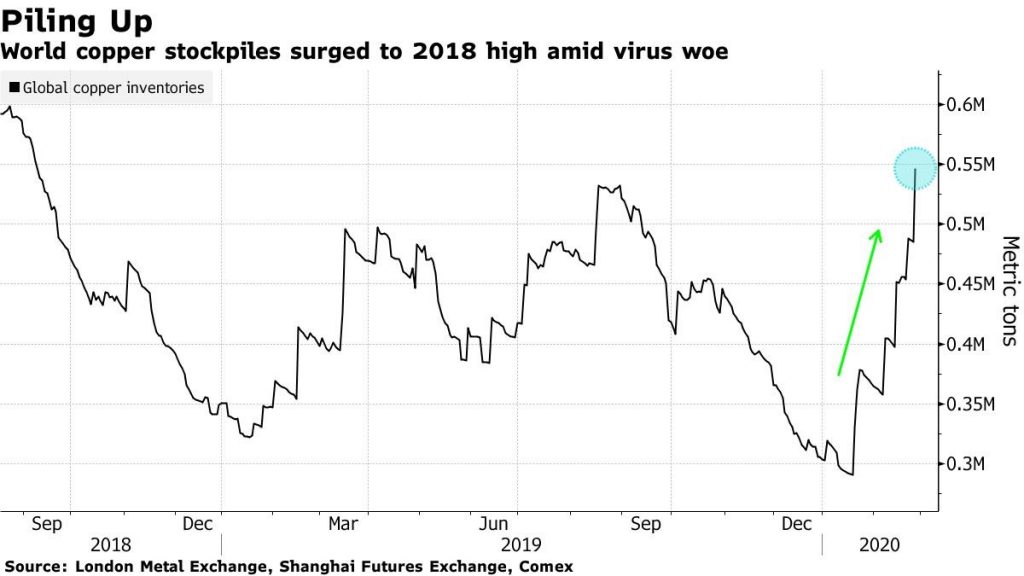

Wall Street banks recorded their third straight day without any high-grade bond offerings, an unheard of event
As Bloomberg puts it, “it has been a remarkable turn of events for a market where investors had been snapping up almost anything on offer amid a global dash for yield. Europe had been enjoying its strongest ever start to a year for issuance, and sales of U.S. junk bonds have been on the busiest pace in at least a decade. With so many borrowers having postponed their issuance plans, a
, a calming in global markets could kickstart debt sales again.”
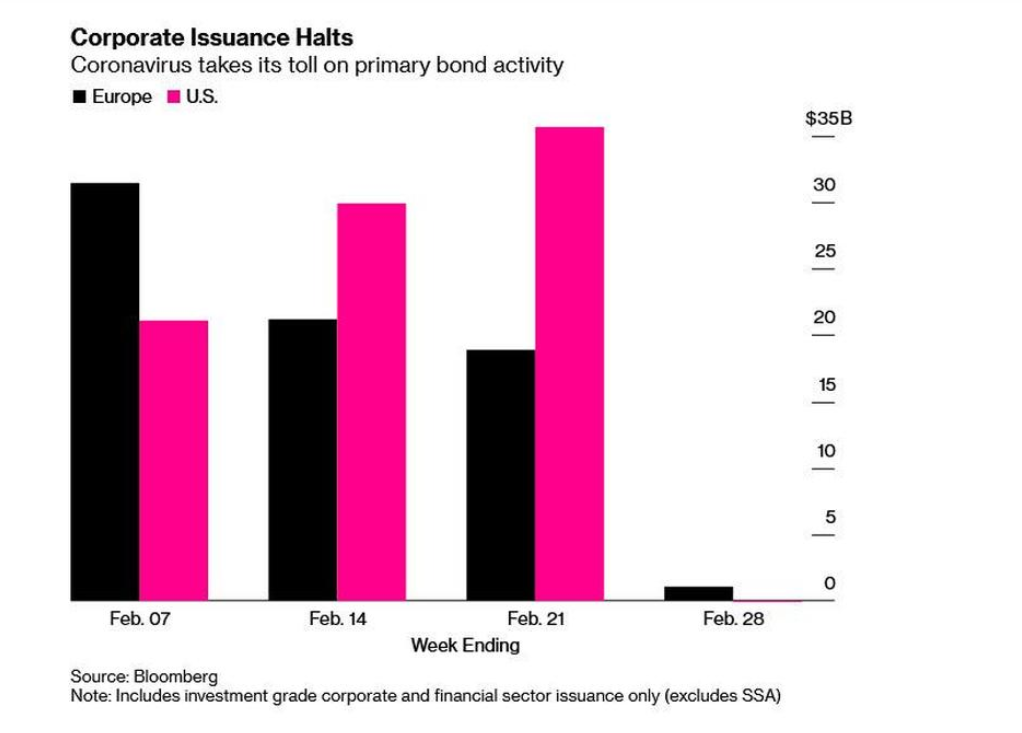
“Coronavirus Paralyzes Global Credit Market As New Issuance Crashes To Zero by Tyler Durden
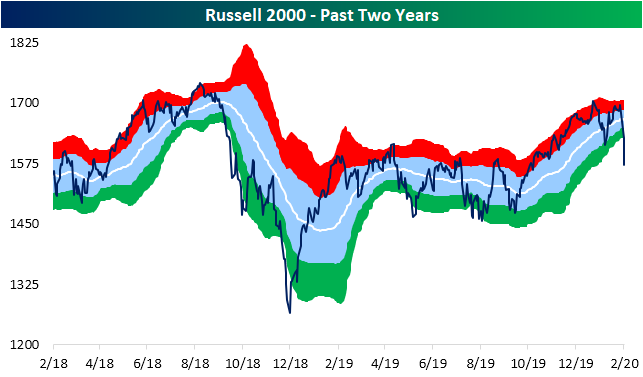
The small-cap Russell 2000 has generally underperformed large-caps for much of the past two years (it still has not gotten back up to its summer 2018 all time highs), and this recent weakness leaves it much more dramatically oversold than other major indices. As of yesterday’s close, the Russell sat over 4 standard deviations below its 50-DMA. That compares to the prior day when it was just over 2 standard deviations below and the day before when it was within one standard deviation of its 50-DMA.
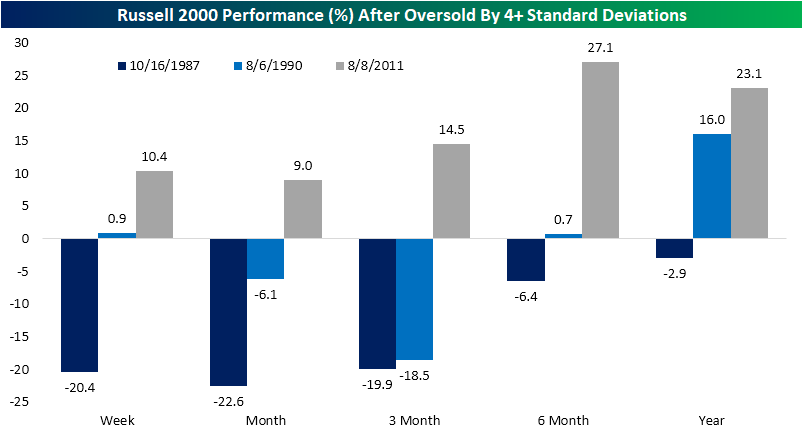
This is only the sixth day in the index’s history that it had gotten this oversold. The last time this happened was in August 2011. Prior to that there was one occurrence in August 1990 and another cluster of three days in during the October 1987 crash. Performance following these prior instances have been very mixed. While the 1987 and 1990 instances were followed by severe declines in the Russell 2000 over the next few months, more recently in 2011 performance was very strong over the next year. Join Bespoke Premium to access Bespoke’s most actionable stock market research and analysis. Start a two-week free trial now!
Russell Rarely This Oversold https://www.bespokepremium.com/interactive/posts/think-big-blog/russell-rarely-this-oversold
Dr. Bertalan Mesko, aka The Medical Futurist, says with advancements in exoskeleton technology, AI’s ever-increasing importance in health care, and technologies like 5G and quantum computing soon going mainstream, there’s much to be excited about
Illustration by Doug Chayka
ByDR.BERTALAN MESKO
The past decade was about the rise of digital health technology and patient empowerment. The next decade will be about artificial intelligence, the use of health sensors and the so-called Internet of Healthy Things and how it could improve millions of lives.
The cultural transformation of health care we call digital health has been changing the hierarchy in care into an equal-level partnership between patients and physicians as 21st century technologies have started breaking down the ivory tower of medicine. But these milestones are nothing compared with what is about to become reality.
With advancements in exoskeleton technology, AI’s ever-increasing importance in health care, and technologies like 5G and quantum computing soon going mainstream, there’s much to be excited about.
Here are the five biggest themes for health and medicine for the next 10 years.
Artificial intelligence in medicine
Developments in artificial intelligence will dominate the next decade. Machine learning is a method for creating artificial narrow intelligence — narrow refers to doing one task extremely well — and a field of computer science that enables computers to learn without being explicitly programmed, building on top of computational statistics and data mining. The field has different types: it could be supervised, unsupervised, semi-supervised or reinforcement learning, among
If we consider how AlphaGo, the AI developed by Google’s DeepMind lab, beat world champion Lee Sedol at the classic Chinese game Go by coming up with inventive moves that took experts by surprise, we can get a glimpse at what AI can hold for health care. Such moves were made possible by the combination of neural networks and reinforcement learning that this AI uses. This enabled the software to operate without the restrictions of human cognitive limitations, devise its own strategy and output decisions that baffled experts.
We can expect to see the same surprises in medical settings. Imagine new drugs designed by such algorithms; high-level analysis of tens of millions of studies for a diagnosis; or drug combinations nobody has thought of before. When applied to medicine, an algorithm trained via reinforcement learning could discover treatments and cures for conditions when human medical professionals could not. Cracking the reasoning behind such unconventional and novel approaches will herald the true era of art in medicine.
In global health, for example, an algorithm can provide a reliable map of future measles outbreak hot spots. It uses statistics on measles vaccination rates and disease outbreaks from the Centers for Disease Control and Prevention, as well as non-traditional health data, including social media and a huge range of medical records. That’s just one example, but the field is already buzzing with smart algorithms that can facilitate the search for new drug targets; improve the speed of clinical trials or spot tumors on computed tomography (CT) scans.
However, while experts believe that AI will not replace medical professionals, it also seems true that medical professionals who use AI will replace those who don’t.
A myriad of health sensors
Medical technology went through an amazing development in the 2010s, and there’s now no single square centimeter of the human body without quantifiable data. For example, AliveCor’s Kardia and Apple Watch measure electrocardiogram and detect atrial fibrillation with high sensitivity. The EKO Core digital stethoscope records heart and lung sounds as a digital stethoscope, while blood pressure is monitored with the Omron Blood Pressure Smartwatch, the MOCAcare pocket sensor, and blood pressure cuff, the iHealth Clear, the Skeeper, a pocket cardiologist, or the Withings Blood Pressure Monitor, and of course, dozens of traditional blood pressure cuffs.
There are dozens of health trackers for respiration, sleep, and, of course, movement. And while researchers can’t decipher your dreams yet — they are working on it, alongside figuring out all kinds of brain activity. For example, through EEG. That’s a method that records electrical activity in the brain using electrodes attached externally to the scalp. The NeuroSky biosensor and the Muse headband use it to understand the mind better and in the latter case allow for more effective meditation. As you see, there’s not much left unmeasured in your body — and it will even intensify in the future. For example, we expect digital tattoos to become commercially available within five years, which will not only measure the majority of the above-mentioned vital signs, but they will do so continuously. These tiny sensors will notify us when something is about to go wrong and we will need medical advice or intervention.
Moreover, with developments in 3-D printing as well as circuit-printing technologies, flexible electronics and materials, applying so-called digital tattoos or electronic tattoos on the skin for some days or even weeks became possible.
Made of flexible, waterproof materials impervious to stretching and twisting coupled with tiny electrodes, digital tattoos are able to record and transmit information about the wearer to smartphones or other connected devices. While these are only in use in research projects, they could allow health-care experts to monitor and diagnose critical health conditions such as heart arrhythmia, heart activities of premature babies, sleep disorders and brain activities noninvasively. Moreover, by tracking vital signs 24 hours a day, without the need for a charger, it is especially suited for following patients with high risk of stroke, for example. Although we are not there yet, there are certain promising solutions on the market such as MC10’s BioStampRC Sensor.
Quantum computing puts medical decision-making on a new level
In 2019, Google claimed “quantum supremacy” and made the cover of Nature magazine. One example of how this technology will have a major impact on the health-care sector is quantum computing taking medical decision-making to a whole new level and even augmenting it with special skills. What if such computers could offer perfect decision support for doctors? They could skim through all the studies at once, they could find correlations and causations that the human eye would never find, and they might stumble upon diagnoses or treatment options that doctors could have never figured out by themselves.
At the very endpoint of this development, quantum computers could create an elevated version of PubMed, where information would reside in the system but not in the traditional written form — it would reside in qubits of data as no one except the computer would “read” the studies anymore.
In addition, the applications of quantum computing to health care are manifold, ranging from much faster drug design to quicker and cheaper DNA sequencing and analysis to reinforced security over personal medical data. While the technology does hold such promises, we still have to be patient before practical solutions can be implemented in medicine. However, with continued progress in this area, even though quantum computing has been something from a science fiction novel, this decade will see the first such computer used in the clinical practice too.
Chatbots as the first line of care
Symptom checkers that function on the same principle as chatbots are already available, free of charge. However, these rely on the user inputting symptoms and complaints manually. We yearn for one that can make predictions and suggestions based on a user’s data, like sleep tracking, heart rate and activity collected via wearables. With such features, those bots can help users make healthier choices without having to drag themselves to their doctor.
There was a “Black Mirror” episode titled “Rachel, Jack, and Ashley Too” that featured an incredibly smart and emotional chatbot that had human-like conversations with the character. Think about having a similar personalized chatbot that’s accessible via your smart device and with additional health and lifestyle features. This chatty virtual being can wake you up at the appropriate time based on your sleep pattern and advise you to take your antihistamines as the pollen concentration is particularly high during your commute that day, before you even get out of bed. It can even recommend what you should consume for each meal based on your nutrigenomic profile. It could find the best words for you to motivate you to go to the gym. It could find the best jokes that help you get into a good mood. But would you rather bend to the rules of an AI, essentially forgoing your freedom of choice, than experience life based more on your own will?
5G serving the whole ecosystem of digital health
5G networks will enable data to be downloaded at more than 1 gigabit per second, allowing for downloads 10 to 100 times faster than the currently available 4G services. 4G networks can only serve around a thousand devices within a square kilometer, while 5G can serve a million. It will make the era of the Internet of Things (IoT) possible by connecting a huge amount of health trackers with laptops, smartphones and many more digital devices. There will be no connection issues or latency, as the trackers will be able to work in harmony while getting the most out of our data.
Such a boost will allow for more reliable communication, which is a must in areas like telesurgery, remote consultation and remote monitoring. With bigger bandwidth and faster connection, there might be a boost in wearables as health IoT networks become more stable and reliable, and further help with patient engagement in relation to their health.
Major applications of 5G are expected to be apparent starting in 2021.
Dr. Bertalan Mesko, Ph.D., is The Medical Futurist and director of The Medical Futurist Institute, analyzing how science fiction technologies can become reality in medicine and healthcare. As a geek physician with a Ph.D. in genomics, he is a keynote speaker and an Amazon Top-100 author.
Engaging with the unfamiliar can keep mind and body fit. So how to pump up one’s levels of curiosityAnyone who has spent time around kids knows that their young minds are powered by curiosity. The average child probably asks more questions in 10 minutes than the average adult does in 10 days. Kids are curiosity personified.
But as people age, their reservoirs of curiosity tend to dry up. Studies have found that, on average, a person’s openness to new experiences and new sensations declines steadily with age. At the same time, apathy increases. While plenty of older adults buck these trends, there’s some truth to the cliché of the narrow-minded, novelty-averse fogey who rigidly adheres to his time-worn routines and opinions.
For years, mental health researchers have noted this age-related dip in curiosity. They’ve also noticed that high levels of curiosity often correlate with many different measures of mental health and vigor. One 2018 paper from the journal Neuroscience & Biobehavioral Reviews found evidence that maintaining curiosity in old age is protective against cognitive and physical decline. Compared to the incurious, older adults who score high in curiosity tend to perform better on tests of memory and general cognitive functioning. The authors of that study point out that curiosity activates brain areas that are involved in other high-level cognitive processes, and over time this increased activation could help explain some of curiosity’s brain benefits.
And in people both young and old, research has found that high and consistent levels of curiosity correlate with mental well-being and life satisfaction. Curious people also seem protected from depression.
The more that experts examine curiosity, the more they find evidence to suggest that it’s the secret sauce in a happy, fulfilling life. “If you take the fundamental things that people tend to want out of life — strong social relationships and happiness and accomplishing things — all of these are highly linked to curiosity,” says Todd Kashdan, a professor of psychology at George Mason University and author of Curious?
What exactly does it mean to be curious? “If you go by the typical dictionary definition, curiosity is simply a desire to seek out new knowledge or experiences,” Kashdan says. While this definition is a useful starting point, he says curiosity also involves a willingness to engage with complex, unfamiliar, and challenging concepts or endeavors.
Kashdan has helped develop two widely used scientific models for measuring curiosity. The newer of these models breaks curiosity down into five different categories or “dimensions.” He terms the first of these “joyous exploration,” and it hews closely to the dictionary definition of curiosity. The second and third dimensions have to do with a person’s level of focus and commitment when confronted with the uncertainties that newness breeds. “When you explore new terrain” — whether it’s an exercise class you’ve never attended or a dinner date with a new friend — “you’ll probably be exposed to feelings of stress and anxiety,” he says. While these states tend to be thought of as negative, he says curious people are not easily deterred by them. In other words, they display resilience or “grit” (to use the buzzword du jour) when exploring new concepts or scenarios.
The more that experts examine curiosity, the more they find evidence to suggest that it’s the secret sauce in a happy, fulfilling life.
“The fourth dimension is thrill-seeking, which is a willingness to take financial or social or personal risks in pursuit of new experiences,” he explains. He says thrill-seeking could take the form of extreme sports, experimenting with psychedelics, or starting a new business venture. The fifth and final dimension is “social curiosity,” he says, which is taking an interest in other people’s views and opinions.
People who score high on some or all of these five measures of curiosity almost transcend questions of happiness or fulfillment. “When you lose yourself in the exploration of things that are new and that you find interesting, you’re not stopping to ask yourself if you’re happy or depressed,” Kashdan says.
That said, there’s some evidence that the relationship between curiosity and happiness is bidirectional, meaning one fuels the other. A 2019 study in the Journal of Personality found that on days when people experience positive emotions like happiness, they also tend to display more curiosity than on days when they aren’t happy. These sorts of findings have led some researchers to hypothesize that positive emotions may exist in part to help encourage curiosity and the fruitful exploration it encourages.
“There’s the ‘broaden and build’ theory that says positive emotions have a lot of function, and one of them is to get us to engage in things we wouldn’t normally do,” says David Lydon-Staley, first author of that study and a postdoctoral researcher in the department of bioengineering at the University of Pennsylvania. Curiosity can lead to new relationships, new skills, or new areas of knowledge that enrich a person’s life at many levels, he explains.
But is it possible to pump up one’s levels of curiosity? Lydon-Staley’s research found that exercise seems to promote curiosity — perhaps by improving a person’s mood. (The mood-elevating effects of exercise are well established.)
Kashdan says having strong personal relationships also seems to feed curiosity. “Having secure attachments is like having a home base in a game of tag,” he says. “They allow people the freedom to be less inhibited and to explore.”
But by far the best way to feed curiosity is to engage with new people, new places, and new points of view. Kashdan says an aversion to the unfamiliar — or what he calls “premature closure” — stifles curiosity. But novelty, even if uncomfortable or scary at first, acts like curiosity fertilizer. “The more you interact with new experiences or information, the more you realize you don’t know, which makes further exploration more attractive,” he says. At the same time, engaging with something new tends to drain it of its power to cause anxiety. “The highest level of anxiety you feel is always during the anticipation of something new,” he says. “Stick it out, and you see that the anxiety is manageable and can even be enjoyable.”
There may be safety and security in the familiar. But there’s evidence that curiosity and the novel experiences that nourish it may pave the way toward a more meaningful and fulfilling life.
Your life, sourced by science. A new Medium publication about health and wellness.
https://elemental.medium.com/curiosity-is-the-secret-to-a-happy-life-3dc5d940d602
Sellers are following the virus – China was smoked 1st, then Koreas, now Euros.. The Bank of Korea announces its policy decision on Thursday, with rising risks of an interest-rate cut

From Dave Lutz at Jones Trading.
Continue readingBloomberg


Mapping the Coronavirus Outbreak Across the WorldBy Cedric Sam, Chloe Whiteaker, Hannah Recht and Demetrios Pogkas https://www.bloomberg.com/graphics/2020-wuhan-novel-coronavirus-outbreak/?srnd=premium
That prospect is looking increasingly remote now. For most of the past month, just a percentage point of so of new daily infections have occurred outside China. Since Thursday, that proportion has risen to a fifth. Nearly half of cases so far found outside of China have been reported in the past four days.

https://twitter.com/TheStalwart
About 150 prescription drugs — including antibiotics, generics and some branded drugs without alternatives — are at risk of shortage if the coronavirus outbreak in China worsens, according to two sources familiar with a list of at-risk drugs compiled by the Food and Drug Administration.
Why it matters: China is a huge supplier of the ingredients used to make drugs that are sold in the U.S. If the virus decreases China’s production capability, Americans who rely on the drugs made from these ingredients could be in trouble.
What they’re saying: The FDA declined to comment on the list, but said in a statement that it’s “keenly aware that the outbreak could impact the medical product supply chain,” and has devoted additional resources toward identifying potential vulnerabilities to U.S. medical products stemming specifically from the outbreak.
The intrigue: FDA commissioner Stephen Hahn is not a member of the task force that the administration has assembled to handle the coronavirus. Only two of the dozen members of the task force are physician-scientists, BioCentury noted on Friday.
The bottom line: Whether or not the coronavirus spreads within the U.S., any potential drug shortages would be felt acutely by the American patients that rely on them.
Go deeper: Coronavirus outbreak fuels concerns about pharma’s global supply chain https://www.axios.com/coronavirus-threatens-drug-shortage-318c9e7b-5d92-4a5e-b992-2478023c6d01.html?utm_source=morning_brew
Meanwhile, Treasury yields are cratering with the 10-Year down over 10 bps. That is the largest one-day decline in the 10-Year yield since August 14th of last year when it fell 12.43 bps. That brings the yield down to 1.37%, which is the lowest level since July 2016.

Going further out on the curve, the yield on the 30-Year Treasury bond is now at a record low of 1.82%. Similar to the 10 Year, that is nearly a 10 basis point decline from Friday.

Given these moves, holding constant the difference in risks associated with the two assets, the spread between the S&P 500’s dividend yield is higher than the 10-Year yield by its widest margin since September of 2016 at 0.575, eclipsing the previous high from last August. Prior to 2016, the spread was higher throughout much of 2012.

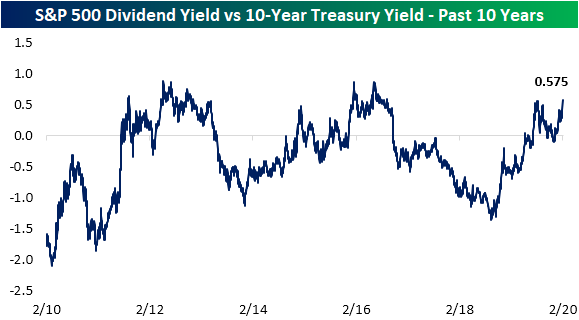
The spread between the S&P 500’s dividend yield and the 30-Year Treasury, on the other hand, is at its highest level in over a decade. The spread now stands at 0.119 which is the widest the spread has been since January 2009, and is favoring stocks (positive spread) for the first time since September. Unlike the spread between the S&P 500’s dividend yield and the 10-Year yield which has flipped back and forth between favoring stocks and Treasuries over the past decade, the 30-Year yield has much more consistently favored bonds. In fact, outside of today and briefly last September, the only other time we’ve seen a positive spread was in 2016. Get Bespoke’s most actionable ideas and analysis with a Bespoke Premium membership. Click here to start a two-week free trial.

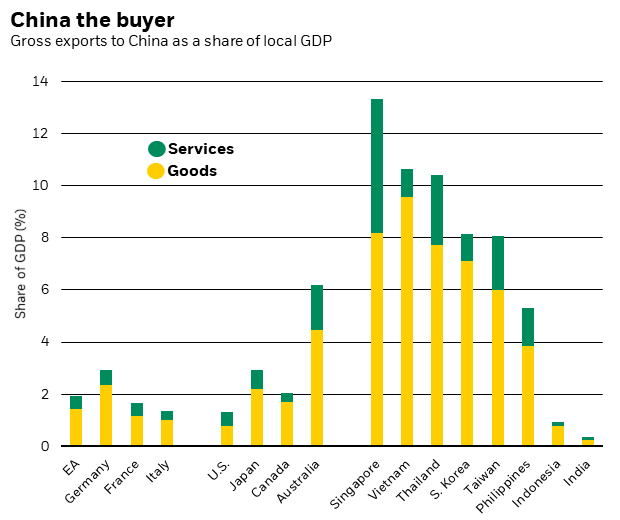
Blackrock–The euro area is more exposed to Chinese export demand than the U.S. See the chart above. And it has extra exposure to China through foreign affiliate sales, especially in the car industry. But the euro area also relies less on intermediate inputs from China in its domestic production than the U.S. or Japan, making it less susceptible to any supply chain disruptions.
Alpha Architects 5% becomes 10% or 20% or 30%

The results are hypothetical results and are NOT an indicator of future results and do NOT represent returns that any investor actually attained. Indexes are unmanaged and do not reflect management or trading fees, and one cannot invest directly in an index.
Those 5% sell-offs often become 10% sell-offs at 47% of the time. But only 21% of the time do they hit the dreaded 20% sell-off.
If the 5% sell-off does not become a 20% sell-off, it will reach the reference high, on average, in 80 trading days, or about 4 months, which is not that long.
Market Sell-off Analysis: Baseline Historical Facts By Cesar Alvarez|July 10th, 2019|Research Insights, Trend Following, Tactical Asset Allocation Research
https://alphaarchitect.com/2019/07/10/market-sell-off-analysis-baseline-historical-facts/
Business Insider

Here are three major takeaways based on the US retail industry’s recently reported performance for Q4 2019 and 2019 overall.
E-commerce sales surpassed 10% of total retail sales in 2019 for the first time https://www.businessinsider.com/ecommerce-topped-10-percent-of-us-retail-in-2019-2020-2
Even if the answers are yes, emotional intelligence is something anyone can develop.
By Marcel SchwantesFounder and Chief Human Officer, Leadership From the Core@MarcelSchwantes
I’ve written numerous times about the impact of emotional intelligence, and how people exhibiting high emotional intelligence (EQ) have been found to have more success in life.
Research has determined that EQ determines an employee’s overall success when it comes to work, relationships, and general well-being. In the age of artificial intelligence and automation, emotional intelligence may be not only what saves us from the robots, it may also be what saves us from ourselves. Consider these findings:
Let’s flip the coin. What about low emotional intelligence, or even no emotional intelligence at all? What does that look like in practice, and how can we identify those habits that are holding us back?
5 questions to assess low emotional intelligence
For the record, if you recognize some of your own habits as you read over the signs, cut yourself some slack and know that you’re not broken or bad. What it does mean is, you suffer from blind spots. You may not see them but those around you–peers, co-workers, customers, family members–can firmly nod in agreement that they do, sometimes routinely.
Rest assured that anyone is capable of changing these scenarios to improve their lives or leadership skills. But there’s got to be a first step: identifying whether your EQ is low or not. Here’s how you will know.
1. Are you quick to judge?
People with low EQ often jump to conclusions quickly because they don’t have a good understanding of how to read other people’s emotions or their own. Since those who judge are typically negative and impulsive, they may form a negative impression of someone before assessing the context of a situation and their initial emotions for truth and accuracy. Sadly, what they may be left with is a distorted view of something or someone.
2. Do you have a hard time accepting criticism?
Taking criticism can wreak havoc emotionally on a person who lacks EQ. However, in honest, self-confident, high-EQ individuals, it is much easier to accept criticism because they are able to process their emotions, assess their strengths and weaknesses, and take note of something they need to improve on.
3. Do you increasingly feel stressed or anxious?
I’m not negating stress–we all experience some level of it; it is inevitable. But people with high EQ, as opposed to their low-EQ counterparts, have the capacity to get perspective on a situation, seek input from various angles, and practice mindfulness before spiraling down the devious path of anxiety.
4. Are you a bad listener?
Low-EQ individuals lack empathy; they often neglect to listen to the opinions and thoughts of others to consider another point of view. Recent research published in Harvard Business Review supports evidence that leaders who listen well “are perceived as people leaders, generate more trust, instill higher job satisfaction, and increase their team’s creativity.”
5. Do you find it hard to recover from mistakes?
High-EQ individuals are resilient; low-EQ individuals dwell on mistakes and have a tough time bouncing back. To these people, I offer one simple solution that will change your world for the better: Heal from the hurt, learn from your mistake, let go of the past, and move on to your glorious future.
In closing, building up your EQ could have a profound effect on your personal and work relationships. But first, assess where you stand in relation to the tenets of emotional intelligence and ask some key “hold up the mirror” questions to determine where you measure up.
PUBLISHED ON: FEB 22, 2020
Like this column? Sign up to subscribe to email alerts and you’ll never miss a post.
The opinions expressed here by Inc.com columnists are their own, not those of Inc.com.