1. U.S. Lumber Prices Full Round Trip

From Dave Lutz at Jones Trading
Ben Carlson Blog-The Shiller PE ratio now stands at 37x, the second highest valuation in history for this measure.
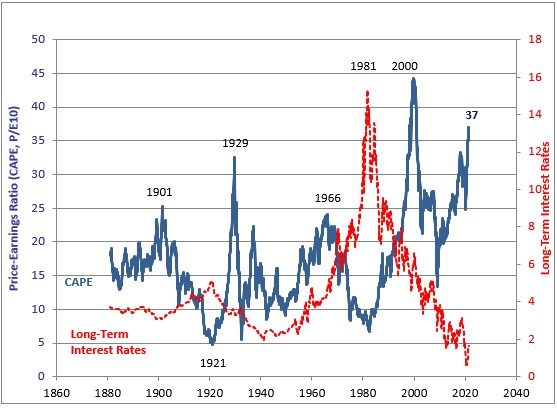
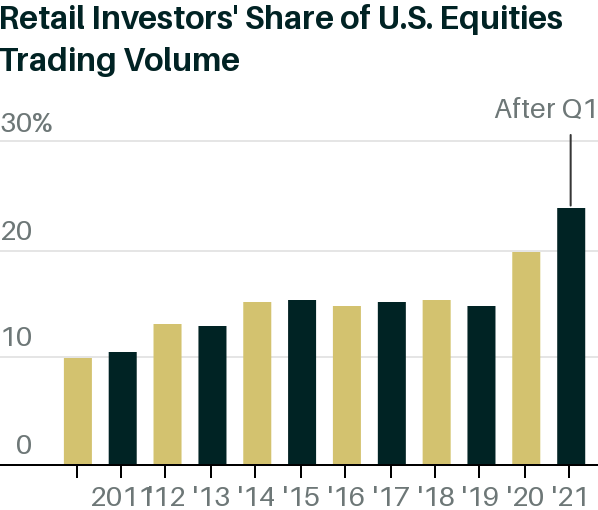
Investors don’t care because people want and/or need to own stocks.
What’s Driving the Stock, Bond & Housing Markets Right Now?by Ben Carlson
https://awealthofcommonsense.com/2021/07/whats-driving-the-stock-bond-housing-markets-right-now/
FAANGM added $1Trillion in market cap since June..MGC ETF-Mega Cap Tech
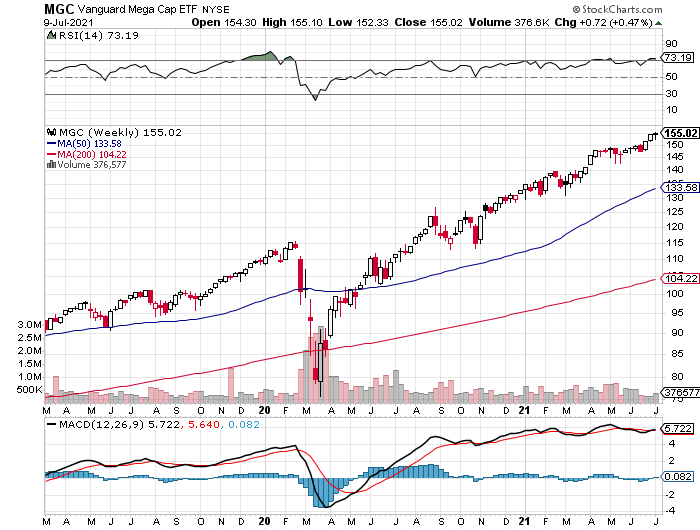
©1999-2021 StockCharts.com All Rights Reserved
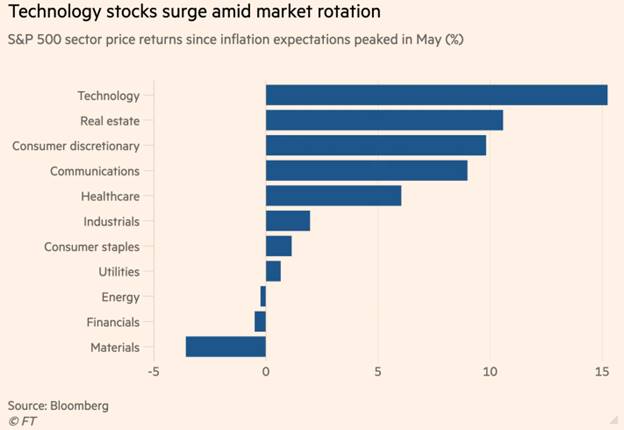
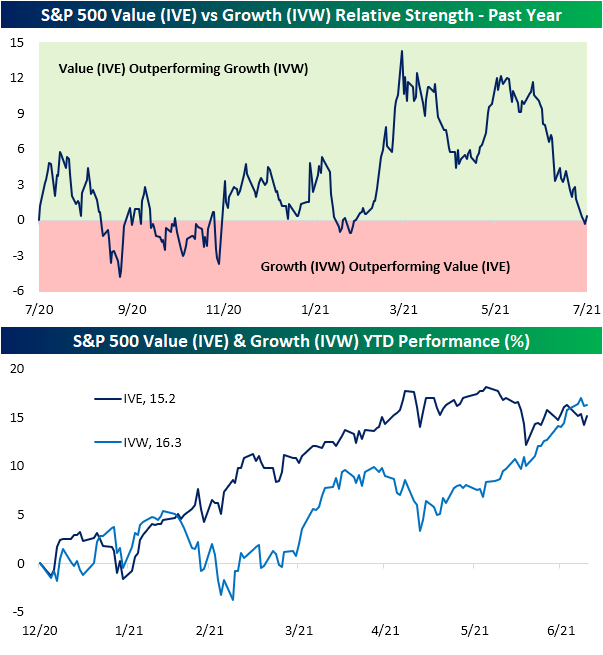
Bespoke Investment Group-In the last few months of 2020 and throughout 2021, the S&P 500 Value ETF (IVE) was consistently outperforming its growth counterpart (IVW). Since its most recent high in early June, though, IVE has given up the ghost falling 2.5%. Although not a dramatic decline, IVE’s drop has coincided with a rally of 7.3% in IVW and an even larger 12.5% rally off the May 12th lows.
With growth having gained so much ground on value, on Tuesday, IVW’s year-to-date performance actually moved above that of IVE. That has continued to be the case through the rest of the week as IVW is currently outperforming IVE on a year-to-date basis by almost a full percentage point. Additionally, looking at the past year’s relative strength between the two ETFs, the recent divergence in performance has resulted in relative strength reverting back to zero meaning growth and value have roughly performed in line with one another over the one year span.
https://www.bespokepremium.com/interactive/posts/think-big-blog/value-has-given-up-the-ghost
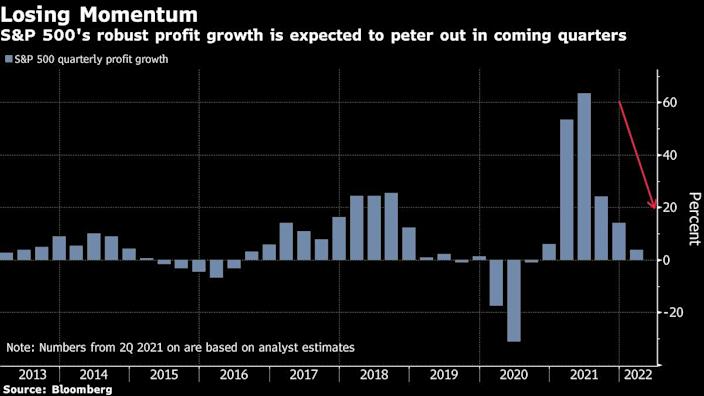
Bloomberg- Lu Wang
After second-quarter results finish rolling out, income growth for S&P 500 firms is forecast to slow in each of the next three quarters as the boost from government stimulus winds down and the base effect from the pandemic recession fades. By the start of next year, the pace of profit growth will dwindle to less than 5%, a fraction of what’s expected to be the fastest expansion in more than a decade for the quarter just ended, data compiled by Bloomberg Intelligence show.
Similar post-peak periods haven’t boded well for stocks in the past. Since 1927, when earnings momentum started waning, two-thirds of the time the S&P 500 fell or performed worse than usual in the following quarter.
https://finance.yahoo.com/news/p-500-perfect-earnings-record-110000295.html
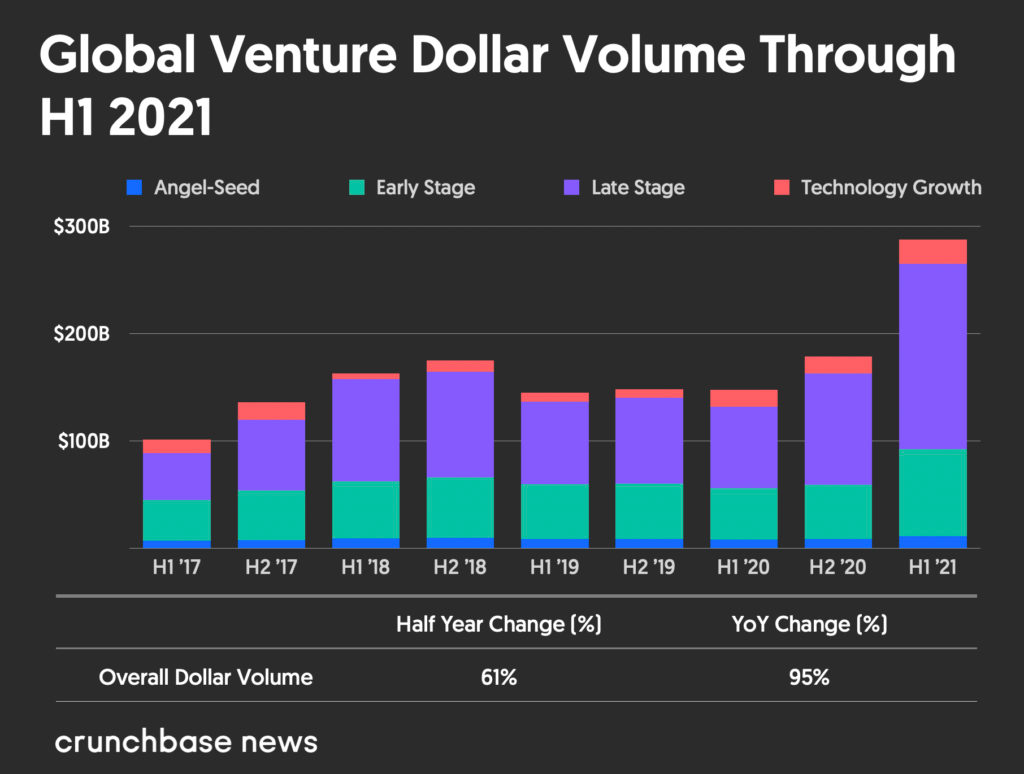
Gené Teare-Crunchbase
A greater number of those venture-backed companies have gone public valued above $10 billion so far this year — just half-way in — than in all of 2020. And already this year, another 250 companies have joined the Crunchbase Unicorn Board, compared to 161 new unicorns for the whole of 2020.
Crunchbase numbers show that global venture funding in the first half of 2021 surged 61 percent compared to the prior peak of $179 billion in the second half of 2020. That’s up 95 percent compared with the first half of 2020, when venture investors deployed $148 billion globally.
Record funding was invested at every stage in the first half of this year. Late-stage funding peaked the most, more than doubling year over year, per Crunchbase numbers. Early-stage funding grew more than 60 percent over the prior two half-year time-frames and seed funding gained 40 percent year over year.
https://news.crunchbase.com/news/global-vc-funding-h1-2021-monthly-recap/
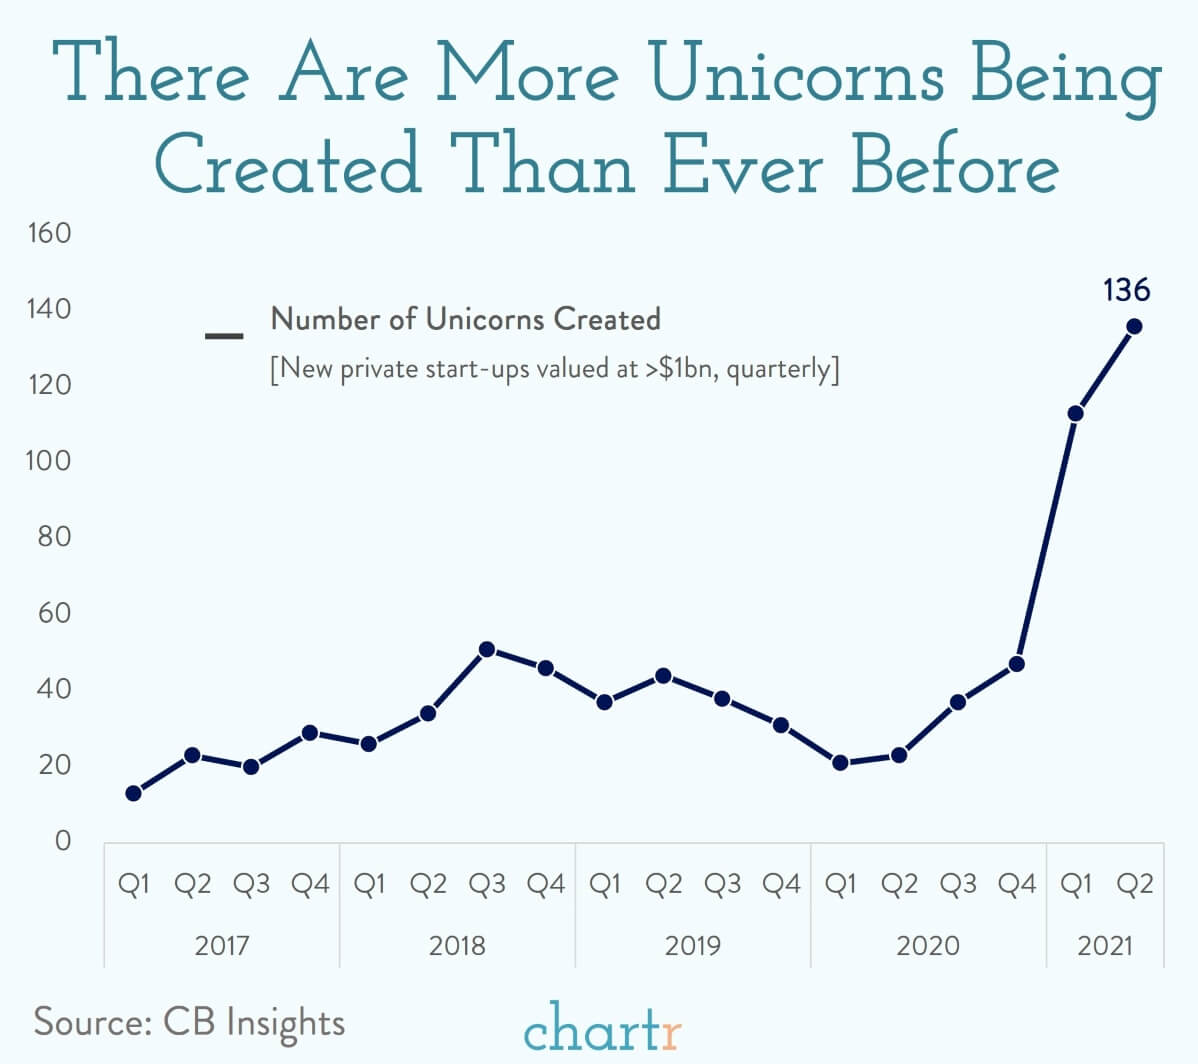
| Unicorns are rare. Kids know that, and it’s why the name stuck as the descriptor for private startup companies that were valued at more than $1bn. But recently, amidst a frenzy of funding activity, unicorns have become a lot less special. Data from a new CB Insights report reveals that 136 unicornswere created in the second quarter of this year — which is more than for all of 2017, when 85 companies made it into the “three comma club”. FOMO With stock markets near record highs, economic activity returning (kinda) and interest rates still at historic lows it’s no surprise that there is a lot of money sloshing around trying to find a home in the nextFacebook, Googleor Amazon. As competition intensifies for the hottest deals the “fear of missing out” (FOMO) gets pretty real, and investors are willing to give the same money for a smaller slice of the equity pie — which means higher valuations for the startups themselves. Data from another source (Pitchbook) finds that it’s a similar story in early-stage investing. A decade ago the median early-stage pre-money valuation for a startup was somewhere around $10m. Today it’s more like $40m. If you would like to fund Chartr at this kind of valuation please get in touch. |
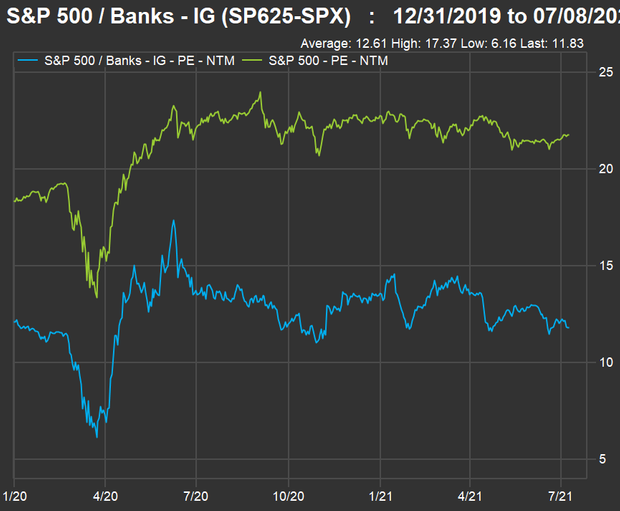
Marketwatch–Here’s another chart showing forward price-to-earnings valuations for the S&P 500 bank industry group against the full index, since the end of 2019:
The weighted aggregate forward P/E ratio for the S&P 500 has increased to 21.8 from 18.4 at the end of 2019. Meanwhile, the forward P/E for the banks has declined slightly to 11.8 from 12.1.
FACTSET
Nivedita BaluPraveen Paramasivam
July 9 (Reuters) – Even in the depths of the 2009 financial crisis, it was never this bad for the owners of the world’s biggest shopping malls.
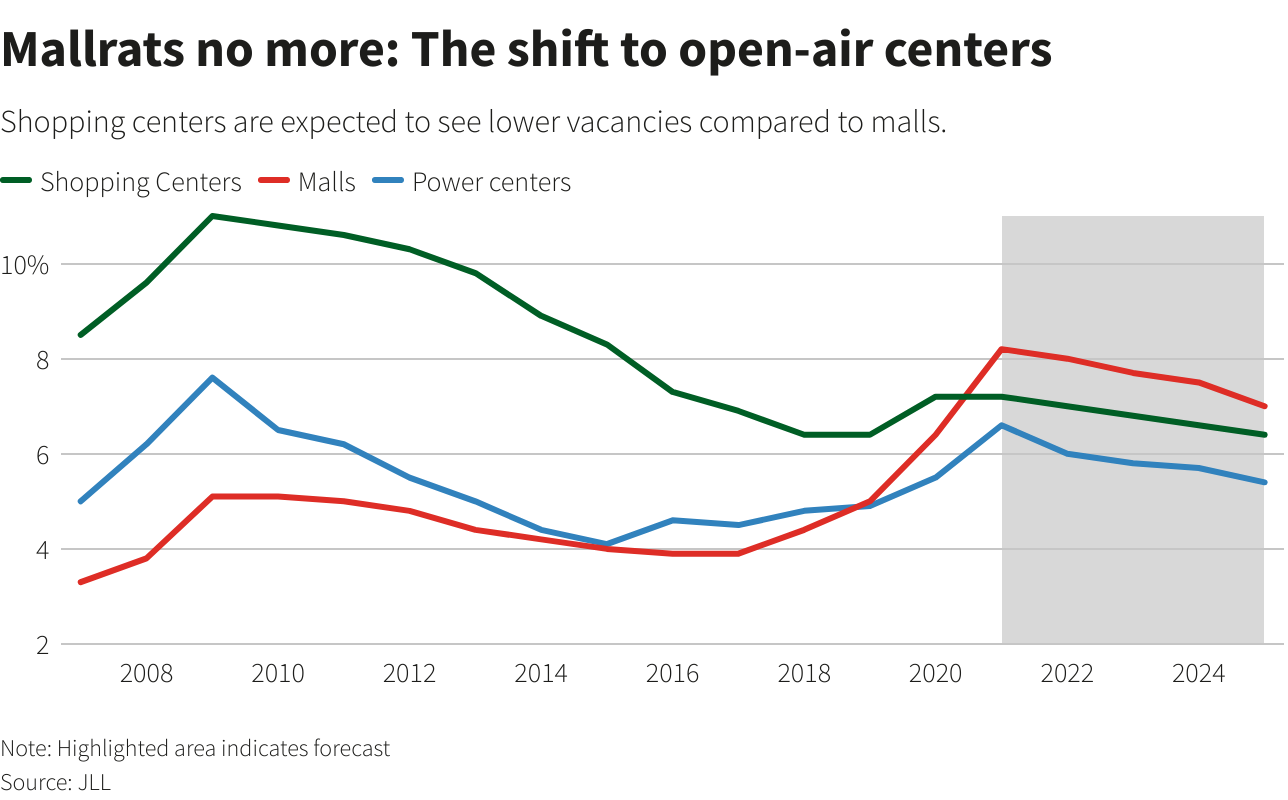
New real estate industry data for June reveals that vacancy rates in the United States’ indoor malls could surpass those in suburban shopping centers and strip malls.
The figures from property consultancy Jones Lang LaSalle come on top of a series of bankruptcies and takeovers, which has seen even sector leader Simon Property Group (SPG.N) hand back control of some buildings to creditors or take over broken retail operations for their debts.
The JLL data predicts that U.S. indoor mall vacancy rates will peak at just under 9% this year compared to 7.8% for outdoor shopping centers and 7% for “power centers”, industry code for open-air centers anchored by big box retailers like Best Buy (BBY.N) or Target (TGT.N).
Experts say that a deeper change is underway, with property owners focusing investment on open air locations and smaller stores in cheaper locations where shoppers can feel more at ease in the post-COVID world.
“The demand for space right now is higher than I’ve seen it in 15 years,” said David Lukes, chief executive officer of SITE Centers, who runs over a hundred power and shopping centers.
Deals done or underway with retailers include Macy’s (M.N), Lululemon Athletica (LULU.O), Bed Bath and Beyond (BBBY.O), Warby Parker and Walmart’s (WMT.N) Bonobos.
In Chicago, for example, Macy’s has shut its sprawling store in the Water Tower Place building on Michigan Avenue’s “Magnificent Mile”, a magnet for thousands of shoppers and tourists every weekend for the past half century.
The company is turning to modest buildings like its new “Market by Macy’s”, set on a canalside lot in Fort Worth, Texas and flanked by a steakhouse and a branch of Wells Fargo.
In 2009, vacancy rates for the more downmarket properties peaked at 11% while malls still showed rates of just 5%.
But for Macy’s and others, the cost reward has become compelling: average annual rent for shopping centers in the first quarter of the year was $20.36 per square foot, as little as a third of the cost of big city centre malls.
At Magnificent Mile, vacancy more than doubled to over 8% currently from 4% in late 2019. Rents fell by 2.5% over the past year to a still very high $62.30, according to industry data provider CoStar.
Alexander Levy, senior consultant at CoStar, said shopping centers in suburban areas have fared better than malls in urban areas since U.S. pandemic-related restrictions began to ease in the first quarter.
Signet (SIG.N), Ethan Allen Interiors (ETH.N) and Express (EXPR.N) are among those to have opened stores in suburban areas, ranging from the suburbs of San Mateo, California and Southlake to smaller towns like Westport, Connecticut and Towson, Maryland.
“We are experiencing the migration to the suburbs right now,” said Conor Flynn, chief executive of U.S. investment trust Kimco Realty (KIM.N), which owns nearly 400 open-air shopping centres and complexes based around grocery stores.
“I’m cautiously optimistic that the lion’s share of what we’ve experienced is sticky.”
MALLRATS NO MORE
City center landlords have responded by turning some city malls into mixed use retail and residential buildings.
In Britain, Intu, owner of Manchester’s Trafford Centre shopping that called in the administrators last year, said they had applied for permission to use its outdoor space for events, food stalls and an urban beach.
Others, like office and mall owner British Land, say they are now targeting “last mile” logistics, to get online orders to consumers’ doorsteps as fast as possible.
For ex-mall goer and Bay Area resident Ian Fagalar, it may all be too late: the Hilltop Mall he frequented as a kid in Richmond, California is now being converted for residential and other uses.
“Retail stores are dropping like flies,” he says. “I shop online 99% of the time now.”

Found at Barry Ritholtz The Big Picture Blog https://ritholtz.com
In fact, behavioral scientists are trained intensively in rigorous methodological and statistical procedures. I took seven statistics courses across my own undergraduate and graduate career as an example.
One measure of how useful our field is pertains to the ability to turn up novel findings about human behavior that are not simply intuitive. OK, I’ll admit that sometimes in our field, we do publish something that everyone already knows (such as research showing that kids don’t like bitter vegetables). That said, when you start to look for non-intuitive findings in the field, you end up seeing many of them. And these findings provide important insight into the broader human experience.
Below are 10 such findings that will, hopefully, encourage the reader to step back and see the importance of behavioral science in a bigger frame.
Classic work on the topic of cognitive dissonance has found that under many conditions, if you pay someone to do some task, they realize that they are only doing it for the money, and their motivation regarding the task itself reduces dramatically (see Festinger & Carlsmith, 1959).
In his classic research on obedience to authority, Stanley Milgram found that a substantial majority of regular Americans are capable of engaging in behavior that would kill an innocent man simply because an authority figure requested that they do so (Milgram, 1963).
An analysis of thousands of homicides from two large North American cities found that a full one-third of homicides are connected, in a significant way, with infidelity (Daly & Wilson, 1982).
The way that people express and understand emotional facial expressions varies almost zero percent across all human groups that have ever been studied (Ekman & Friesen, 1986).
When we think of people as being members of some “other” group from our own, we literally are unable to see variability among them; we literally tend to see them as “all the same” (Haslam et al., 1996). This phenomenon is known as outgroup homogeneity.
Next time you look at your dog or your cat, realize that our psychological connections with these creatures actually go far back into human evolutionary history. They joined us in this journey for very specific, evolution-based reasons.
Research into basic personality traits, which shows much variability from person to person, has found that the same basic personality traits—extraversion, emotional stability, open-mindedness, agreeableness, and conscientiousness—characterize how people differ from one another in all corners of the Earth (see Schmitt et al., 2007).
A mountain of research on “evil” or anti-social behavior points to this conclusion: Evil behavior is much more the result of situational factors than dispositional factors.Thus, it is more accurate to talk about environmental conditions that facilitate evil behavior than it is to talk about “bad people” (see Zimbardo, 2007).
While on the surface, we tend to think of anxiety as simply problematic and as something that we need to reduce, in fact, anxiety acts very much like a Darwinian adaptation, leading to benefits such as success at all kinds of tasks. A moderate degree of anxiety is, in fact, a good thing (see Nesse & Williams, 1994).
ar
True love really is a thing, and it can be observed in neural activity in the brain. Helen Fisher has dedicated a lifetime of intensive research that ultimately points toward this conclusion (see Fisher, 2012).
Across the past several decades, work in the behavioral sciences has shed light on a broad array of topics that underlie the human experience. Work in this field is not subjective, fluffy, nor intuitive. It is, in fact, rigorous science that utilizes the most advanced statistical processes available in an effort to help us better understand who we are.
The 10 not-necessarily-intuitive findings summarized here are, in fact, the tip of the iceberg. Welcome to scientific psychology.
Facebook/LinkedIn image: Mix Tape/Shutterstock
Disclosure
Indices that may be included herein are unmanaged indices and one cannot directly invest in an index. Index returns do not reflect the impact of any management fees, transaction costs or expenses. The index information included herein is for illustrative purposes only.
Material for market review represents an assessment of the market environment at a specific point in time and is not intended to be a forecast of future events, or a guarantee of future results.
Material compiled by Lansing Street Advisors is based on publicly available data at the time of compilation. Lansing Street Advisors makes no warranties or representation of any kind relating to the accuracy, completeness or timeliness of the data and shall not have liability for any damages of any kind relating to the use such data.
To the extent that content includes references to securities, those references do not constitute an offer or solicitation to buy, sell or hold such security as information is provided for educational purposes only. Articles should not be considered investment advice and the information contain within should not be relied upon in assessing whether or not to invest in any securities or asset classes mentioned. Articles have been prepared without regard to the individual financial circumstances and objectives of persons who receive it. Securities discussed may not be suitable for all investors. Please keep in mind that a company’s past financial performance, including the performance of its share price, does not guarantee future results.
Lansing Street Advisors is a registered investment adviser with the State of Pennsylvania..
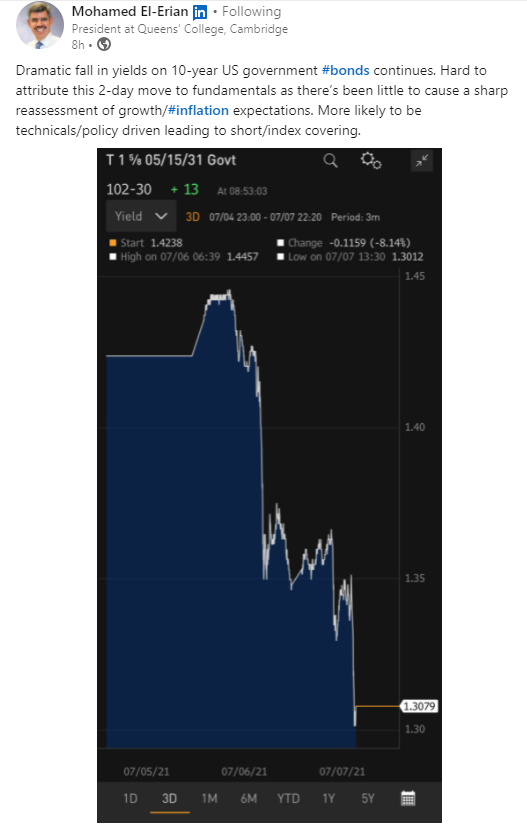
Dave Lutz Jones Trading–Falling U.S. bond yields may signal death knell for ‘reflation’ stock trade – Investors piled in to shares of energy producers, banks and other companies expected to benefit from a powerful economic rebound earlier this year while betting that Treasury yields, which move inversely to prices, would rise.