1. Hedge Fund Leverage Near Record Levels
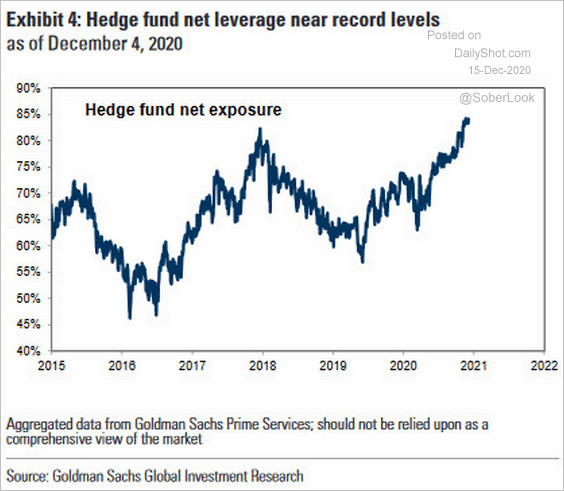
The Daily Shot https://dailyshotbrief.com/the-daily-shot-brief-december-15th-2020/
Continue readingThe Daily Shot https://dailyshotbrief.com/the-daily-shot-brief-december-15th-2020/
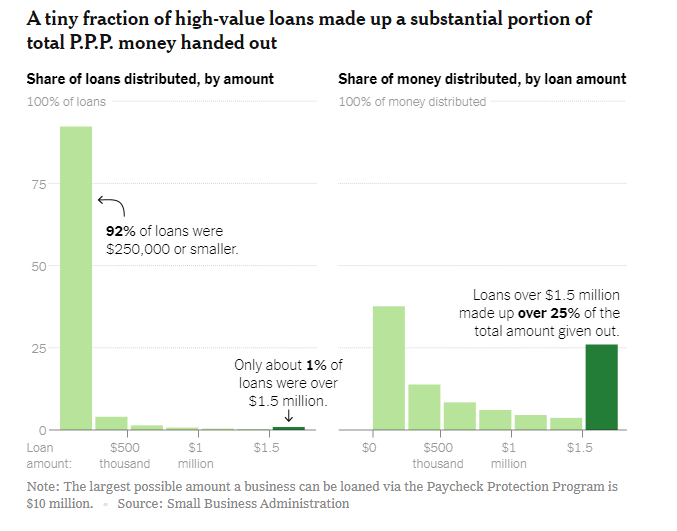
Continue readingJust 1 percent of borrowers received a quarter of loans from the federal Paycheck Protection Program.
S&P Dividend Yield Versus U.S. Treasuries…Above 1 is cheap
A Favorite Bullish Indicator For Stocks Is Still Flashing Green
Take a look at the chart below that shows the ratio of the S&P 500 dividend yield to the 10-year treasury yield. The ratio skyrocketed because the 10-year bond yield has plummeted, yet the S&P 500 dividend yield has remained relatively steady between 1.8% – 2%.

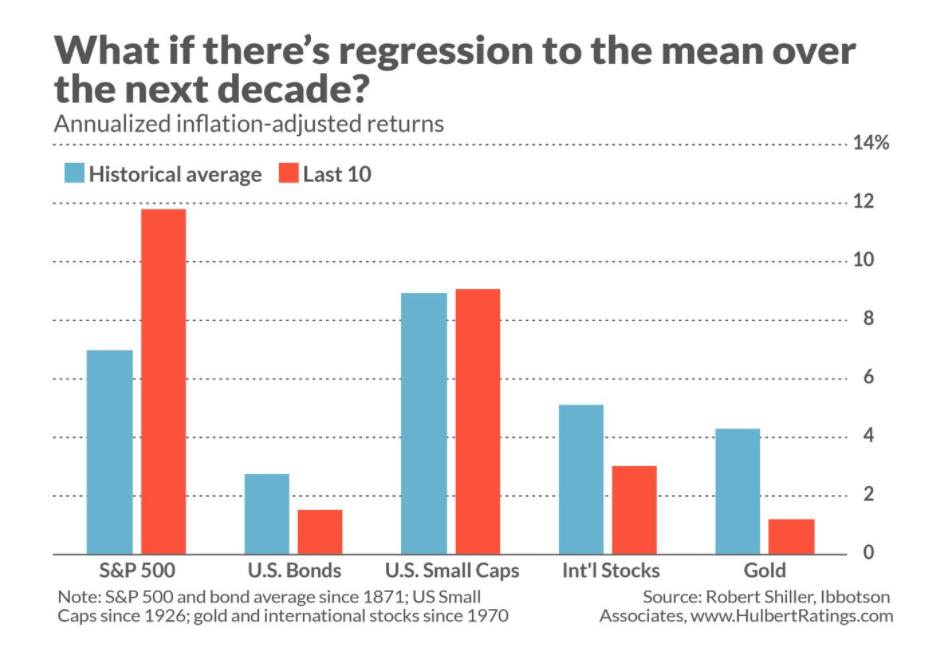
If not stocks, what else?
What about other asset classes? Take a look at the chart below, which plots each asset’s annualized inflation-adjusted return over the last decade against its long-term average. The asset that performed the worst since 2010, relative to its historical average, was gold, followed closely by international stocks and U.S. bonds.