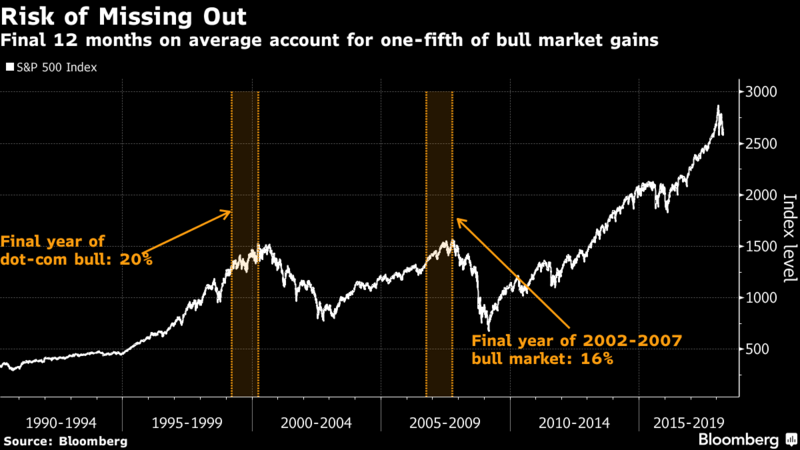
Category Archives: Daily Top Ten

Daily Top Ten – January 17, 2017

1.Speculators are Massively Short Stock Market Volatility and Short Treasuries….Contra-Indicator???

Equity Markets:  Risk appetite in the equity markets remains near multi-year highs. The chart below shows speculative accounts massively short VIX futures.

Rates: Short Treasuries is increasingly becoming a crowded trade. The chart below shows speculative accounts piling into the short 10yr note futures position.

Continue reading

Daily Top Ten – January 13, 2017

1.Measuring Europe Thru German Leadership.

German economic growth accelerated more than analysts forecast last year to its fastest pace since 2011,

as falling unemployment and record-low interest rates boosted spending. According to the Federal Statistics Office, GDP growth rose 1.9%, after a gain of 1.7% the previous year. Germany is the first of the world’s biggest developed economies to provide preliminary GDP data for 2016.
www.seekingalpha.com

German DAX-Sideways then Breakout….7% Spike 2017

Continue reading

Daily Top Ten – January 12, 2017

1.Nasdaq 269% Off Bottom.

Chart of the Day

For some perspective on the post-financial crisis rally, today’s chart illustrates how much of the downturn that occurred as a result of the financial crisis has been retraced by each of the five major stock market indexes. For example, the Dow peaked at 14,164.53 back in October 9, 2007 and troughed at 6,547.05 back on March 9, 2009. The most recent close for the Dow is 19,855.53 — it has retraced 174.7% of its financial crisis bear market decline. As today’s chart illustrates, each of these five major stock market indices have retraced over 170% of their financial crisis decline. However, it is the tech-laden Nasdaq that leads the pack with a retracement of 269% — impressive considering the severity of the financial crisis bear market.

http://www.chartoftheday.com/20170111.htm?H

Continue reading

Daily Top Ten – January 11, 2017

1. Gundlach Deck is Out…10 Year Taking Out 3% in 2017—End of 35 Year Bond Bull?

“Almost for sure we’re going to take out 3% on the 10-year in 2017,” Gundlach said. If we exceed 3% (not 2.6%) in 2017, it’s goodbye to the bull market because you would no longer have declining peaks in yields.

A 10-year above 3%, with the 30-year yield approaching 4%, would also be trouble for the equity market because they would start to look like ‘real’ yields to investors.

Gundlach said it’s not radical to forecast a 6% yield on the 10-year by 2020.

View Full Deck
http://www.businessinsider.com/jeff-gundlach-webcast-2017-outlook-just-markets-2017-1

Continue reading