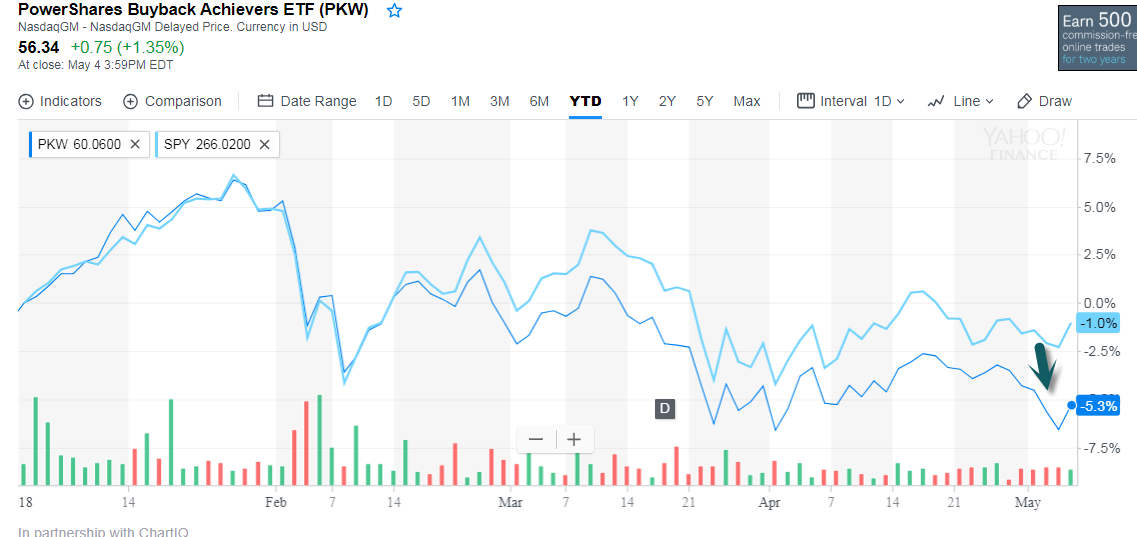
1.Trump Tax Cuts Going to Buybacks but ETF Trailing Markets this Year.
PKW Buyback ETF
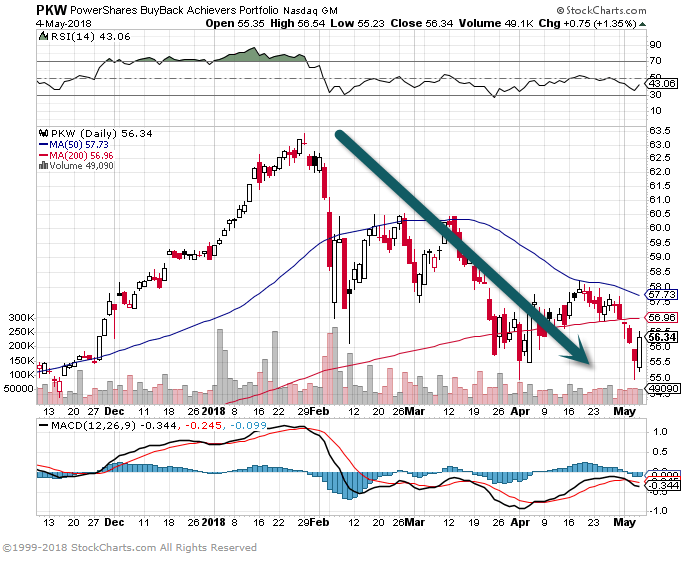
PKW Buyback ETF -5% YTD vs. S&P -1% (thu close)
Bespoke’s Sector Snapshot — 5/3/18
May 3, 2018
If you’re not yet a subscriber and would like to see the report, please start a two-week free trial to Bespoke Premium now.
Below is one of the many charts included in this week’s Sector Snapshot, which highlights the year-to-date percentage change of the eleven S&P 500 sectors. At this point, just three sectors are still in positive territory, while eight are in the red. Consumer Staples and Telecom are down the most with declines of more than 13%.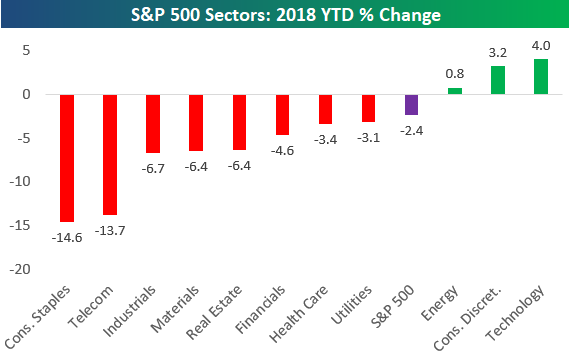
https://www.bespokepremium.com/think-big-blog/
Continue reading
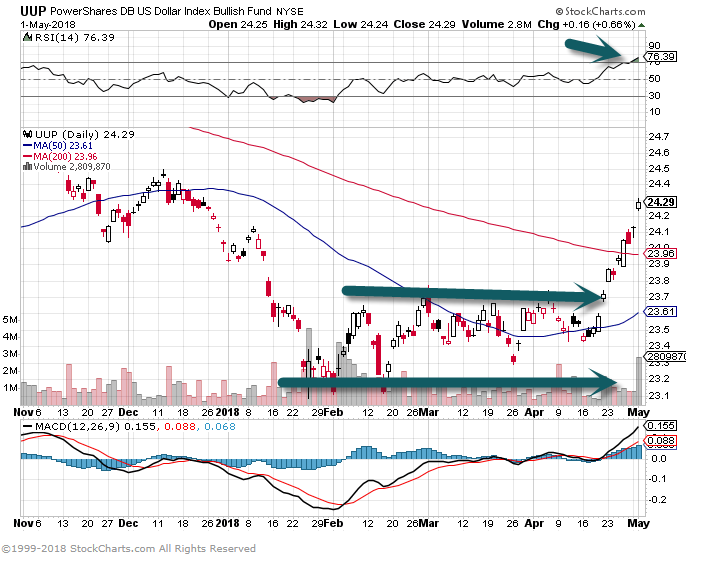
U.S. Dollar Bull ETF Pops Out of Range…Big Macro Funds Bet on Dollar Staying Weak.
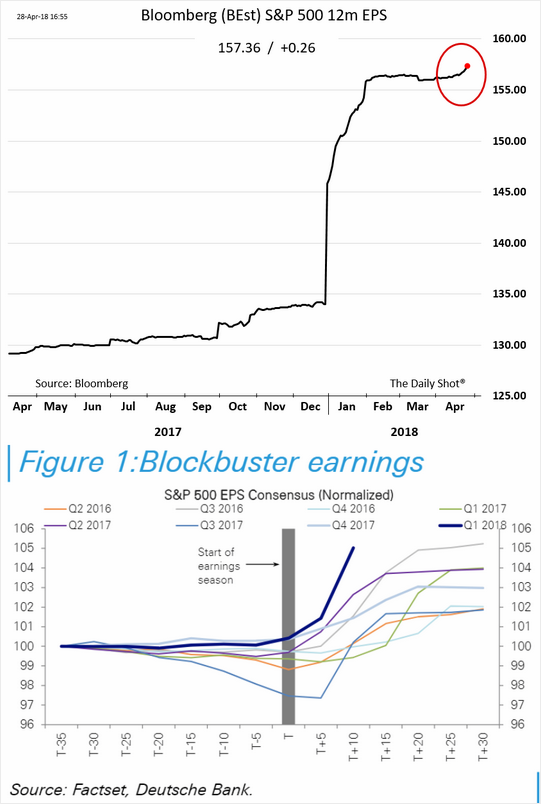
Historically, I am not sure if the S&P witnessed $20 earnings jump in one quarter…Let me know if someone has long-term data.
Equity Markets: Analysts are boosting US corporate earnings forecasts again.
Source: Deutsche Bank Research
https://blogs.wsj.com/dailyshot/
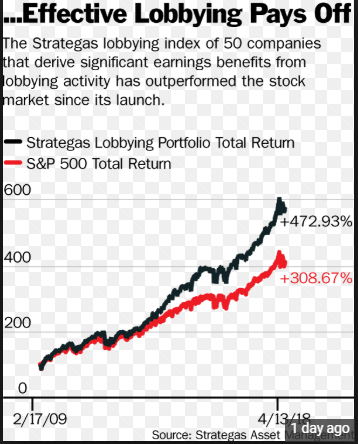
About 10 years ago, Strategas devised a “lobbying” index of companies that get the most bang for their lobbying buck, including interactions with regulators. The index, it says, has outperformed the Standard & Poor’s 500 for nearly a decade by an average of almost five percentage points annually. The lobbying index returned an average 14.4% annually from its 2009 launch through April 13, versus 9.5% for the S&P 500. About $1 billion of assets are pegged to the performance of the Strategas index.
https://www.barrons.com/articles/lobbying-index-beats-the-market-1524863200
https://www.barrons.com/articles/lobbying-index-beats-the-market-1524863200