1.The Shakeout in Retail.
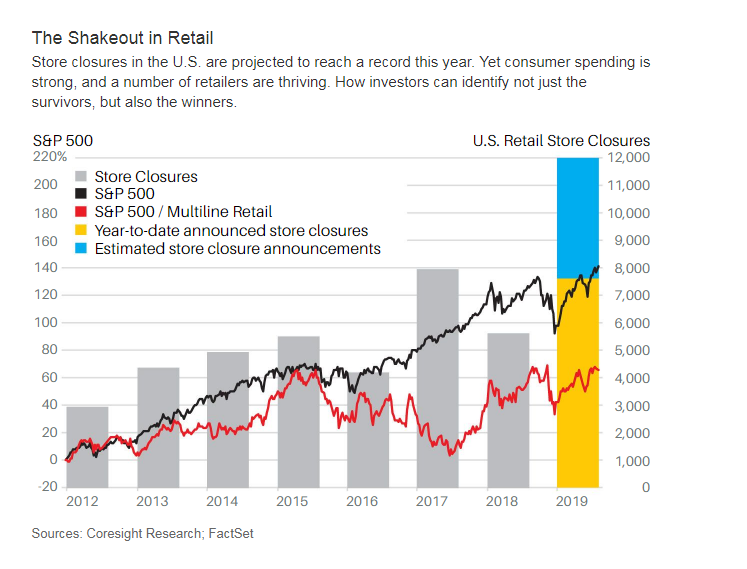
The Retail Reckoning Has Only Just Begun-Jack Hough
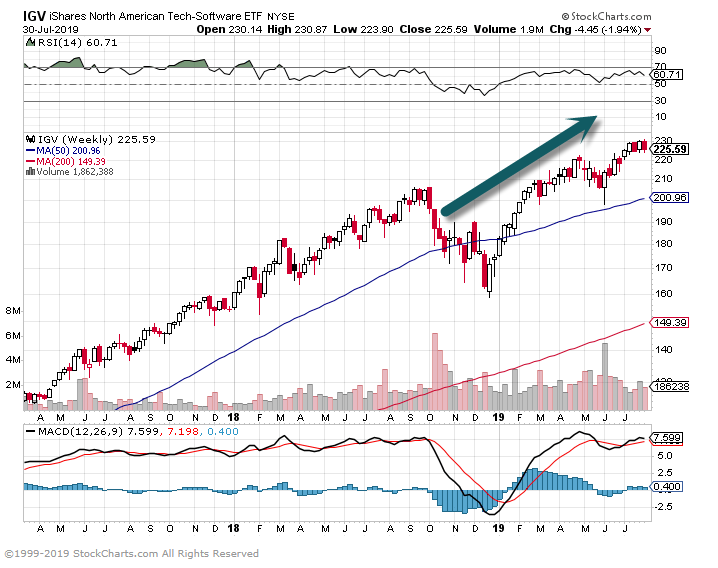
Continue readingThe exchange-traded fund (ticker: IGV) is up 32% this year and 100% over the past three years. Many software companies are now valued at more than 20 times projected 2019 sales—and without any earnings. No major industry has a higher valuation. The S&P 500 index is valued at about two times sales
Sky-High Software Stocks Are Beginning to Look Like They’re Forming a Bubble–Andrew Bary
IGV-Software ETF
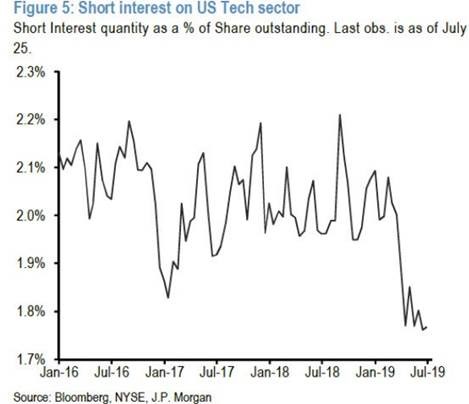
And Tech shorts have capitulated. Usually sign of top, says the always negative Zero Hedge – Growth Tech was shredded yesterday
From Dave Lutz at Jones Trading
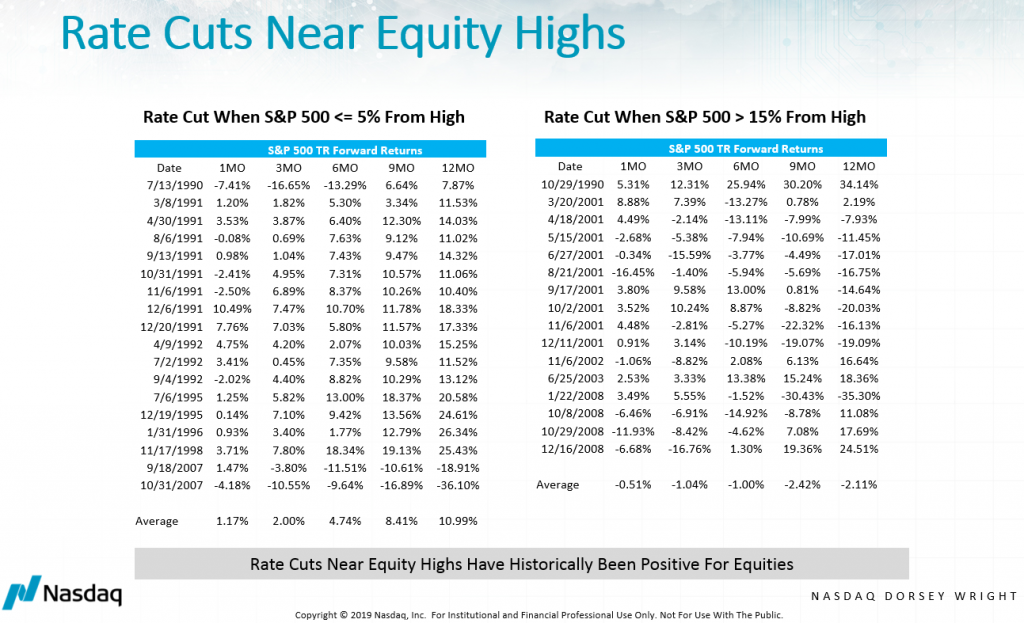
While they are not an explicit component of its mandate, changes in the Fed’s monetary policy often have an observable effect on US securities markets. Rate decisions are often discussed as they relate to fixed income markets, as rate movements have a direct and inverse relationship to bond prices. However, as we saw earlier this year when dovish comments from Chair Powell led to an equity rally, fed rate policy can have also have important implications for the US stocks. So, what’s in store for the US equity market should the Fed cut rates next week as anticipated?
The expected rate reduction from the Fed comes against the backdrop of a US equity market that has seen each of the major large cap benchmarks hit new all-time highs within the last week. Based on research by John Lewis, Senior Portfolio Manager at Nasdaq Dorsey Wright, since 1990, when the Fed has initiated a rate cut when the S&P 500 SPX was within 5% of its high, on average, the index has posted positive returns over the next one-, three-, six-, nine-, and 12-month period; with an average 12-month gain of almost 11%. In fact, the only two occasions when we saw negative 12-month returns following a rate cut when SPX was within 5% of its high were the two successive cuts in September and October 2007, which preceded the global financial crisis. On the other hand, when a rate cut has been initiated when the S&P 500 is more than 15% below its high, on average, the index has posted negative returns over the next one-, three-, six-, nine-, and 12-month period.
Nasdaq Dorsey Wright.
What is China’s STAR Market?BY MARK KOLAKOWSKIThe Shanghai Stock Exchange has created a hot new market showcasing some of China’s most promising tech companies, all with the goal of catching up to America’s Nasdaq, the birthplace of many of the world’s legendary and pathbreaking tech giants. The Shanghai Stock Exchange Science and Technology Innovation Board is being called the STAR Market for short by Chinese authorities, and began trading on Monday with 25 listed companies. These stocks ended the opening day with sizzling gains ranging from 84% to 400%, The Wall Street Journalreports.
“It’s a bit crazy, but I think the situation will calm down a bit in the next few days,” Jack Zhang, an analyst at BOC International, a securities brokerage and investment banking subsidiary of the Bank of China, told the Journal. He believes that individual investors with an appetite for risky speculation drove most of the first-day action.
“Gains were much stronger than expected, either due to unreasonable IPO pricing or speculative trading,” Zhu Junchun, a Shanghai-based analyst with Lianxun Securities Co., told Bloomberg. “It’s going to be a liquidity game in the first half year or one year of trading. Judging by the trading activity and gains on the board, it’s definitely a success,” he added.
KEY TAKEAWAYS
https://www.investopedia.com/what-is-china-s-star-market-4693703
China STAR Market stocks lose trader interest as ‘temporary craziness’ wears off, curbs kick in
Louise Moon https://www.scmp.com/business/markets/article/3020464/china-star-market-stocks-lose-trader-interest-temporary-craziness
Key Points
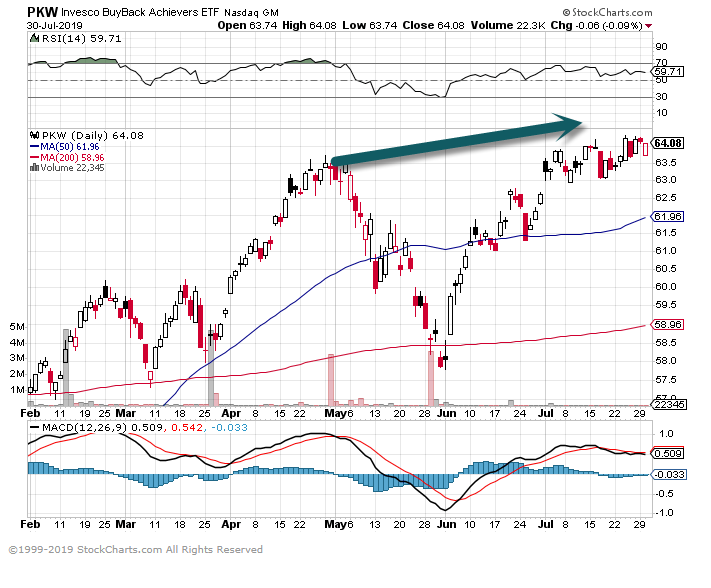
U.S. companies are on pace to break another record for share repurchases in 2019, using a combination of cash and debt to push the total to close to $1 trillion.
For the first time since the financial crisis, companies have given back more to shareholders than they are making in cash net of capital expenditures and interest payments, or free cash flow, according to Goldman Sachs calculations.
The level of buybacks to free cash flow hit 104% for the 12 months ending in the first quarter of 2019, the first time that number has topped 100% during the economic recovery that started in 2009. In 2017, the level was 82%.
https://www.cnbc.com/2019/07/29/buybacks-companies-increasingly-using-debt-to-repurchase-stocks.html
Baltic Dry Index – BDI
REVIEWED BY BEVERLY BIRD
Updated Apr 12, 2019
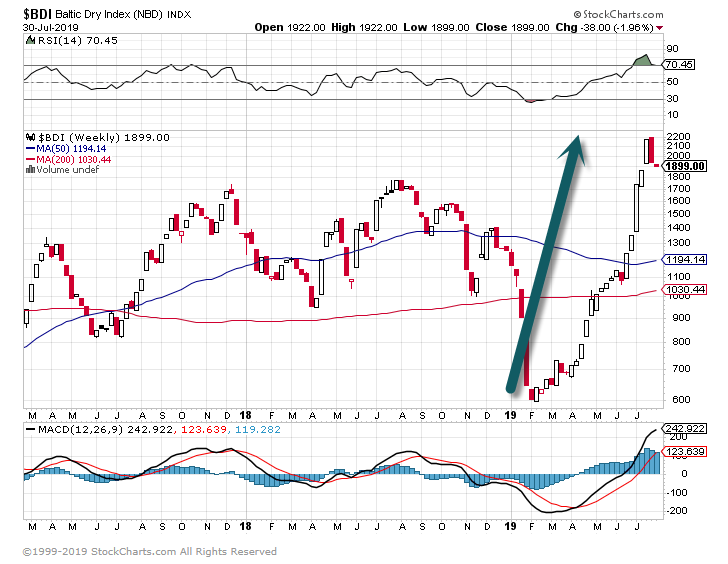
What Is the Baltic Dry Index – BDI?
The Baltic Dry Index (BDI) is a shipping and trade index created by the London-based Baltic Exchange. It measures changes in the cost of transporting various raw materials, such as coal and steel.
Members of the exchange directly contact shipping brokers to assess price levelsfor given shipping paths, a product to transport, and time to delivery or speed. The Baltic Dry Index is a composite of three sub-indices that measure different sizes of dry bulk carriers or merchant ships: Capesize, Panamax, and Supramax.
How the Baltic Dry Index – BDI Works
The Baltic Exchange calculates the index by assessing multiple shipping rates across more than 20 routes for each of the BDI component vessels. Analyzing multiple geographic shipping paths for each index gives depth to the index’s composite measurement. Members contact dry bulk shippers worldwide to gather their prices and they then calculate an average. The Baltic Exchange issues the BDI daily.
KEY TAKEAWAYS
https://www.investopedia.com/terms/b/baltic_dry_index.asp

The Dutch company Port-Liner is building two giant all-electric barges dubbed the ‘Tesla ships‘. The company announced that the vessels will be ready by this autumn and will be inaugurated by sailing the Wilhelmina canal in the Netherlands.
The 100 million-euro project supported by a €7m subsidy from the European Union is expected to have a significant impact on local transport between the ports of Amsterdam, Antwerp, and Rotterdam.
Chief executive of Port-Liner Ton van Meegen told The Loadstar:
“There are some 7,300 inland vessels across Europe and more than 5,000 of those are owned by entrepreneurs in Belgium and the Netherlands. We can build upwards of 500 a year, but at that rate it would take some 50 years to get the industry operating on green energy.”
The battery-powered barges – pictured above – are capable of carrying 280 containers.
The first 6 barges are expected to remove 23,000 trucks from the roads annually in the Netherlands and replace them with zero-emission transport.
Port-Liner is developing its own vessels, but they developed a battery pack technology that houses the batteries inside a container.
Meegen says that it could allow them to retrofit existing barges:
“This allows us to retrofit barges already in operation, which is a big boost for the industry’s green energy credentials.The containers are charged onshore by carbon-free energy provider Eneco, which sources solar power, windmills and renewables.”
The first vessels will complete their maiden voyage later this year.
Get a chance to win a Tesla Model 3 Performance with Wall Connector and $20,000 in the frunk
Electrek’s Take
As we have often discussed in the past, all modes of transportation are gradually being converted to electric propulsion and that includes maritime transport.
It’s also an important mode of transportation to convert since it produces a lot of pollution. Some of the world’s largest cargo ships emit pollution comparable to millions of passenger cars put together.
I think it’s an exciting time on that front because we have seen several major projects like this one in the past few months. A new all-electric cargo ship with a massive 2.4 MWh battery pack in China and two massive all-electric ferries in Sweden and Denmark come to mind.
Liz Ann Sonders
It’s amazing to me how often I hear folks (including our politicians…on both side of the aisle) conflate the terms deficit and debt. The latter is the cumulative effect of running the former. As you can see in the chart below, per Congressional Budget Office (CBO) projections, the U.S. budget deficit is expected to exceed $1 trillion each year starting in 2022; with deficits likely to be well above the 50-year average. Outlays are expected to jump to 23% of GDP by 2029, from 20.8% this year due to demographics and rising health care costs.
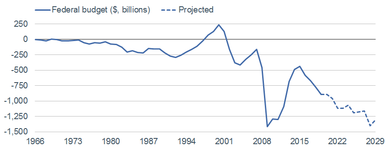
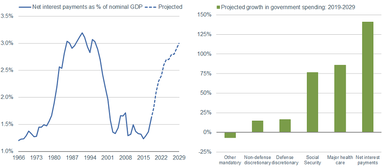
Source: Charles Schwab, CBO (Congressional Budget Office) May 2, 2019 Report: Updated Budget Projections: 2019 to 2029.
At TED the self-made billionaire explained why the usual business playbook is flat-out dumb.
By Jessica StillmanContributor, Inc.com@EntryLevelRebel
There are few things as American as a classic rags to riches story, and Chobani founder Hamdi Ulukaya seems to fit this classic narrative to a T. Born into a family of nomadic sheep herders in Turkey, he came to America with just $3,000 in his pocket and, through hard work, vision, and a bit of luck, managed to build a billion-dollar yogurt business.
But while Ulukaya might seem like the perfect example of old-fashioned business success, from the TED stage in April (hat tip to Swiss Miss) he explained that his views on what it means to be successful are wildly different from the traditional business playbook.
In fact, rather than seeing himself as the usual pull-yourself-up-by-your-bootstraps capitalist hero, he thinks of himself as an “anti-CEO” calling the shots at his company from the “anti-CEO playbook.” The typical rules of business success, he flatly declares, are stupid. Here’s what he’s replaced them with.
1. Businesses exist to maximize shareholder value? Nope.
“Today’s business books say businesses exist to maximize profit for the shareholders. I think that’s the dumbest idea I’ve ever heard in my life,” Ulukaya says. If businesses shouldn’t try first and foremost to make money for their owners, what should they aim for? “Businesses should take care of their employees first,” he insists.
In 2016 Ulukaya took the unusual step of giving his 2,000 employees shares in the company. “Some people said it’s PR. Some said it’s a gift. I said, ‘It’s not a gift’… They earned it with their talent and their hard work,” he explains.
2. Ask not what your community can do for you; ask what you can do for your community.
In a veiled swipe at Amazon’s recent HQ2 beauty contest, where cities competed to show how many tax breaks and incentives they could offer the online behemoth, Ulukaya believes companies shouldn’t approach communities with their hand out. Instead, businesses should go to struggling communities and ask, “How can I help you?”
“Go search for communities that you can be part of. Ask for permission and succeed together,” Ulukaya advises, citing the resurgence of the community around his company’s second factory in rural Idaho to show how this can work out for the benefit of everyone.
3. Your boss isn’t the board. It’s the consumer.
“Today’s playbook says the CEO reports to the board. In my opinion the CEO reports to the consumer,” says Ulukaya. He takes this point so seriously that, in the early days of Chobani, the telephone number on each pot of yogurt was his own personal line. Customers could literally phone up the CEO to chat.
“The consumer is in power. That’s the reason business exists,” he reminds leaders.
All of which sounds idealistic. And it is. But Ulukaya insists it is also a recipe for a deeper, more meaningful (and clearly still very remunerative) kind of success.
“If you’re right with your people, if you’re right with your community, if you’re right with your product, you’ll be more profitable, more innovative, and you will have more passionate people working for you and a community that supports you,” he concludes.
The Daily Shot https://dailyshotbrief.com/the-daily-shot-brief-july-23rd-2019/
Continue readingPosted by lplresearch
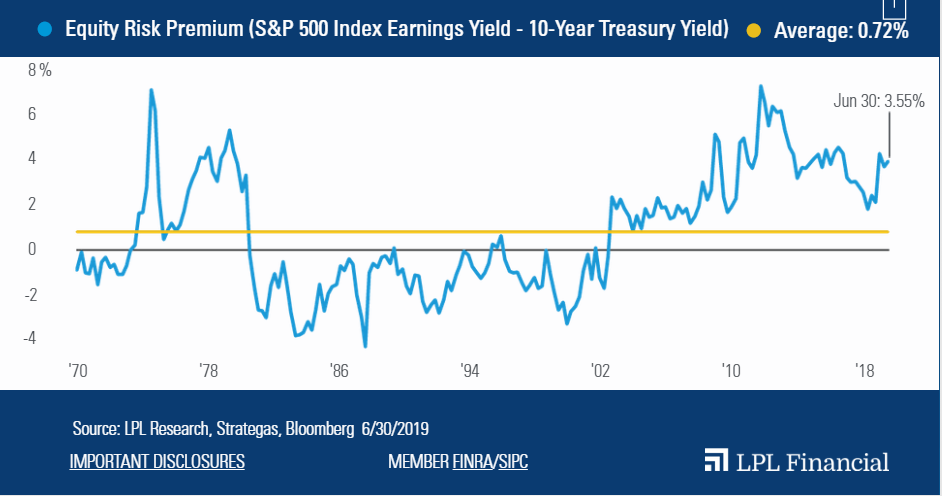
U.S. stocks have powered back to record highs, and they could benefit more from a relatively expensive fixed income market.
As shown in the LPL Chart of the Day, Stocks Appear Historically Cheap Relative to Bonds, S&P 500 Index stocks are at their most attractive valuations relative to Treasuries in nearly three years. This data is based on a metric we track called the equity risk premium (ERP), which compares the earnings yield on equities (or company profitability as a percent of share price) to the 10-year Treasury yield.
There are several different ways to view stock and bond valuations, so the ERP is only one piece of the puzzle. However, the ERP’s recent ascent shows how much global buying pressure has crimped U.S. yields this year.
There are several different ways to view stock and bond valuations, so the ERP is only one piece of the puzzle. However, the ERP’s recent ascent shows how much global buying pressure has crimped U.S. yields this year.
https://lplresearch.com/2019/07/23/a-case-for-stocks-from-bond-valuations/#more-13591
Continue reading