1. How the S&P 500 Index has done the Three Months Ahead of the Election can Predict who will win the Election in November….87% Accuracy.
LPL Research

LPL Research
And new data from consulting firm McKinsey shows in the US market, the slice of the retail pie comprised of online sales has climbed from around 15 per cent to more than 30 per cent.
“If you’re feeling whiplash, it might be the 10 years forward we just jumped in 90 days’ time,” McKinsey said.

US ecommerce penetration. Pic: McKinsey
https://www.mckinsey.com/business-functions/strategy-and-corporate-finance/our-insights/five-fifty-the-quickening#

Official quarterly data on US real GDP goes back to 1947, and today’s -32.9% annualised decline for real Q2 is the worst over this period. However, we can splice together a longer series back a century and find that five quarters have been worse than that reported today. **
These occurred in the immediate post-WWII economy, during the early 1930s depression and the associated double dip in 1937-38, and also in the ‘forgotten’ depression of 1920-21.
So, the US is not quite in unprecedented economic times. Many other countries are closer to this though. As you’ll see on page 20-22 of my new monthly chart book (link here) this will likely be the worst year for the UK economy for 310 years. For most of the G7, 2020 will be the worst peacetime year for the economy on record. Again, the US is less severe. On our estimates, 2020 will be the 9th worst year since 1790 and the 6th worst year since 1900. See the chart book for more.
** We have quarterly nominal US GDP data back to 1920 and for this chart have inflation adjusted this series. There is also a real GNP series from the NBER calculated between 1921-1939. The results are broadly similar to our calculations, but we have used ours to avoid splicing multiple series together.
Looking at the week of Oct. 6, 2019, Amazon is cruising along with about 18% higher spend than the previous year. For that same period, Walmart is down by 5%.

Amazon is clobbering Walmart in consumer spending, according to debit-card transactions
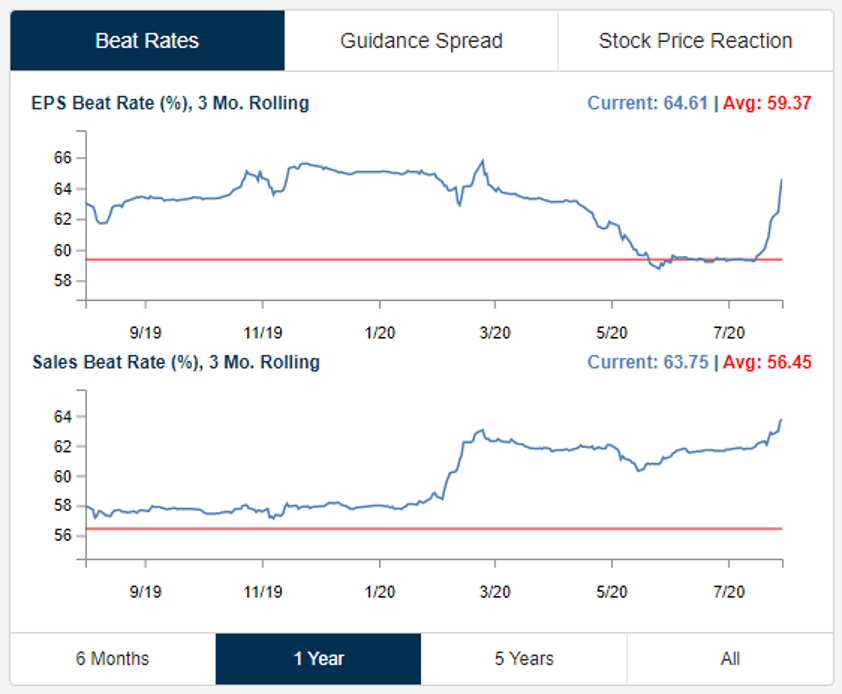
Thu, Jul 30, 2020 At our Earnings Explorer tool available to clients on our website, we provide a real-time look at beat rates for both EPS and sales. Below is a snapshot from the website showing both the EPS and sales beat rates for US companies reporting earnings on a rolling 3-month basis. Currently, 64.61% of companies have exceeded consensus analyst EPS estimates over the last three months, while 63.75% of companies have beaten consensus sales estimates over the same time frame.
In looking at the chart, you can see a big spike in the EPS beat rate over the last few weeks. Since earnings season began on July 13th, nearly 80% of companies have posted stronger than expected EPS numbers. That’s a huge beat rate and suggests that analysts were too bearish on Q2 numbers heading into July. The revenue beat rate held up much better than EPS beats throughout the first half of 2020, but it too is on the upswing this season.
We also monitor how share prices are reacting to earnings reports. So far this earnings season, the average stock that has reported Q2 numbers has gained 1.31% on its earnings reaction day. That compares to a historical average one-day change of just 0.06% on earnings reaction days. As shown below, stocks that have beaten EPS estimates this season have gained 2.2% on earnings reaction days, while companies that have missed EPS estimates have fallen 1.89%. It’s rare to see beats gaining more than misses decline, but that’s what is happening this season. Click here to view Bespoke’s premium membership options for our best research available.

https://www.bespokepremium.com/interactive/posts/think-big-blog/bullish-earnings-season-so-far

Visual Capitalist


How COVID-19 Shutdowns Impact the Gold Supply Chain
Chains are only as strong as their weakest link—and recent COVID-19 shutdowns have affected every link in the gold supply chain, from producers to end-users.
Increased investor demand for gold coupled with a constrained supply has led to high prices and a bullish market, which has been operating despite these pressures on the supply chain.
Today’s infographic comes to us from Sprott Physical Bullion Trust and it outlines the gold supply chain and the impacts COVID shutdowns have had on the gold market.
The Ripple Effect: Stalling a Supply Chain
Disruptions to the gold supply chain have rippled all the way from the mine to the investor:
1. Production
Some gold mines halted production due to the high-risk to COVID-19 exposure, reducing the supply of gold. In many nations, operations had to shut down as a result of COVID-19 based legal restrictions.
2. Delivery
Strict travel regulations restricted the shipment of gold and increased the costs of delivery as less air routes were available and medical supplies were prioritized.
3. Refinery
Refineries depend on gold production for input. A reduction in incoming gold and the suspension of labor work shortened the supply of refined gold.
4. Metal Traders
Towards the other end of the gold supply chain, traders have faced both constrained supply and increased cost of delivery. These increased costs have translated over to end-users.
5. The End Users
Higher demand, lower supply, and increased costs have resulted in higher prices for buyers of gold.
College football accounted for about $793 million in advertising at ESPN, ABC, and their related networks, estimates Standard Media Index, which tracks advertising spending. That’s almost four times as much as their closest rival, Fox-

MUMBAI (Reuters Breakingviews) – Just maybe, India’s financial capital can start to look beyond its Covid-19 lockdown. An antibody testing study has found that a whopping 57% of people sampled in densely populated slum areas of Mumbai had coronavirus antibodies. Some 40% of the city’s 20 million or so residents live in similar settings, where toilets and water supply are often shared and social distancing is impossible. The result tests the logic of the city’s strict lockdown.
The study is credible, with municipal authorities partnering with the respected Tata Institute of Fundamental Research and others. The randomised sample of nearly 7,000 covers folks from three areas of the city. It’s evidence that crowding speeds transmission and that low-income groups are more vulnerable to infection. Just 16% of people sampled in more affluent parts of the same three areas of Mumbai were found to have the antibodies.
Encouragingly, the study suggests an infection mortality rate of between 0.05% and 0.01% based on official death numbers – that’s low and would remain so, relative to many other estimates, even if the numerator is under-reported.
The findings will support politicians as they tweak policies that have reduced Mumbai to a shadow of itself. The din of rush hour traffic is no more, offices mostly sit empty, street-food vendors have disappeared and restaurants closed to diners. Public transport is curtailed, and residents are subject to a 9 p.m. curfew. Most restrictions have been in place for four months, making India’s lockdown one of the world’s strictest.
The extreme shutdown may have initially avoided worse pressure on an under-resourced health system. But the new study suggests the measures are now impoverishing more than protecting the poor. Armies of daily-wage earners have been left dependent on food rations. With so many of them infected, Mumbai might consider loosening restrictions, enabling more people to return carefully to work.
That might, of course, increase the risk of infection for wealthier groups where lifestyle diseases are more common in Mumbai, underlining how important local factors are in managing Covid-19. And one study, however well structured, can’t provide all the answers for a given city, either. But this one does raise the possibility that if any community in the world has achieved something like herd immunity, it may be the residents of Mumbai’s slums.https://www.reuters.com/article/us-health-coronavirus-breakingviews/breakingviews-mumbais-slums-test-lockdown-logic-idUSKCN24V09Z
Jeff Bezos’s antitrust grilling was a reminder of Amazon’s power over its sellers
Jeff Bezos was calm and polite in his first congressional appearance. But he did nothing to quiet a huge concern.
By Jason Del Rey@DelRey Jul 29, 2020, 10:09pm EDT
Share this story
Amazon CEO Jeff Bezos testifies remotely before the House Judiciary Subcommittee on Antitrust, Commercial and Administrative Law hearing on “Online Platforms and Market Power” on July 29, 2020. Graeme Jennings/AFP via Getty Images
The world’s richest man, Jeff Bezos, testified before US Congress members for the first time on Wednesday, but he said little to assuage one of their biggest concerns: that Amazon’s grip on online retail gives it the power to make or break small merchants on a whim.
Bezos, along with the CEOs of Apple, Google, and Facebook, appeared via videoconference before a bipartisan group of 15 US House members who have been investigating the four tech giants over the last year. The stated goal of this antitrust subcommittee’s investigation has been to document whether these corporate titans abuse their power in industries ranging from retail to social networking, and to evaluate whether the country’s antitrust laws are modern enough to guard against such abuses.
“Their ability to dictate terms, call the shots, upend entire sectors, and inspire fear represent the powers of a private government,” Rep. David Cicilline (D-RI), the chair of the subcommittee, said in his opening remarks at what was a five-hour-plus hearing.
For Bezos, much of the questioning from lawmakers focused on how Amazon competes against, and profits from, the 1.7 million small and mid-sized merchants who help stock Amazon’s digital shelves. Amazon boasts that 60 percent of its retail sales now come courtesy of these sellers rather than from Amazon stocking and reselling goods itself.
But some Amazon sellers have complained over the years that as Amazon’s market share in US online commerce has increased — to about 40 percent today, which is about seven times more than the next competitor — the company has squeezed and otherwise harmed them in new and different ways because they have no viable online alternatives.
According to Cicilline, Amazon sellers have told the subcommittee that “[Amazon has] never been a great partner, but you have to work with them.”
One concern has been the data Amazon uses from its own merchants to help inform what products to develop under its own private-label brands, such as Amazon Basics. In April, the Wall Street Journal published a report stating that Amazon employees have used data from individual sellers to help Amazon decide which private-label products to pursue. That contradicts what a top Amazon lawyer, Nate Sutton, told Congress earlier this year when he said that Amazon’s policy is to only use data on a product when there are at least two sellers selling it.
On Wednesday, Bezos told Rep. Pramila Jayapal (D-WA), who represents Amazon’s hometown of Seattle, that the company’s investigation into violations of the policy outlined in the Journal report was ongoing. “I’m not satisfied that we have gotten to the bottom of it, and we’ll keep looking at it,” he said.
Found at The Big Picture https://ritholtz.com/2020/07/10-thursday-am-reads-298/
With the arrival of a new decade, many people are thinking about making changes toward creating greater happiness in their lives. But how many people truly make sweeping transformations in a year? One way to overcome this trap, especially for overachievers, is to set smaller, more attainable goals.
Resistance to Change
Change of any kind is a challenge, as inertia is the easiest path. Why does it seem so hard to make a shift? Neuroscience researcher Joe Esperanza says, “We’ve in fact conditioned ourselves to believe all sorts of things that aren’t necessarily true—and many of these things are having a negative impact on our health and happiness.” He says we’re addicted to our beliefs and emotions of our past — and we often see our beliefs as truths, not as ideas we can change.
Nevertheless, the mind believes what you tell it. That being the case, you might as well direct it to something spectacular. You have the ability to mitigate negatives and encourage more positive outcomes. Yes, you can redirect your thoughts, beliefs, and expectations, creating a different reality. Your perspectives can be managed, better.
A Case in Point: The Overachiever
Let’s take the example of the overachiever. If you’re like many, you strive to get ahead all the time, be it at work, home, or in your personal life. You may be striving for that promotion, want to organize your apartment, lose 10 pounds, or reach a fitness goal. But somehow that relaxation point of achievement is elusive because you haven’t yet trained your mind on how to shut it off. You’re constantly going, constantly falling into the same routine of setting big, nearly impossible goals.
Aim to Do Less
What if one of your New Year’s Resolutions were to modify your goals into half or one-third? Setting smaller, achievable objectives, even on a daily or weekly basis, can bring you an enormous sense of contentment and achievement—versus life-changing goals that are mentally and physically exhausting.
Remember when you were a kid? Did you ever play “opposite day,” being a contrarian? It may be time to resist your normal habits and dare I say, strive for less—as that will likely yield much more. Why? Because the old way is likely causing you to be overwhelmed. At the end of the day, you wish you had just set out to do two or three items on your never-ending to-do list, not 10.
This may be about one goal that in itself takes an army to complete adequately. You may have trouble delegating some tasks, be torn about the priorities—or have other obstacles that keep you stuck.
Whatever the reason, be kind to yourself and take some concrete steps toward change:
One of my favorite popular quotes about change is, “If you want something you have never had, you must be willing to do something you have never done.” How will you bring meaningful change into your life—differently—in this new decade of opportunity?https://www.psychologytoday.com/us/blog/tame-your-terrible-office-tyrant/202002/change-your-perspective-create-more-happiness?collection=1148006
Disclosure
Lansing Street Advisors is a registered investment adviser with the State of Pennsylvania..
To the extent that content includes references to securities, those references do not constitute an offer or solicitation to buy, sell or hold such security as information is provided for educational purposes only. Articles should not be considered investment advice and the information contain within should not be relied upon in assessing whether or not to invest in any securities or asset classes mentioned. Articles have been prepared without regard to the individual financial circumstances and objectives of persons who receive it. Securities discussed may not be suitable for all investors. Please keep in mind that a company’s past financial performance, including the performance of its share price, does not guarantee future results.
Material compiled by Lansing Street Advisors is based on publicly available data at the time of compilation. Lansing Street Advisors makes no warranties or representation of any kind relating to the accuracy, completeness or timeliness of the data and shall not have liability for any damages of any kind relating to the use such data.
Material for market review represents an assessment of the market environment at a specific point in time and is not intended to be a forecast of future events, or a guarantee of future results.
Indices that may be included herein are unmanaged indices and one cannot directly invest in an index. Index returns do not reflect the impact of any management fees, transaction costs or expenses. The index information included herein is for illustrative purposes only.
OSTK Bottomed at $2.75…..$62 Last

Business Insider.

More than 63,000 Robinhood traders piled into Kodak shares during its 2,100% rally–Ben Winck


https://www.linkedin.com/in/nicholas-lampone-9277986/

The Daily Shot-WSJ
Just as gold bars are lost at sea or $100 bills can burn, bitcoins can disappear from the Internet forever. When all 21 million bitcoins are mined by the year 2040, the actual amount available to trade or spend will be significantly lower.
According to new research from Chainalysis, a digital forensics firm that studies the bitcoin blockchain, 3.79 million bitcoins are already gone for good based on a high estimate—and 2.78 million based on a low one. Those numbers imply 17% to 23% of existing bitcoins, which are today worth around $8,500 each, are lost.

Exclusive: Nearly 4 Million Bitcoins Lost Forever, New Study Says BY JEFF JOHN ROBERTS AND NICOLAS RAPP
https://fortune.com/2017/11/25/lost-bitcoins/
$NDX Daily Sentiment. The 50d reached Top 2.5% most overbought in history (20 years) and the highest since 2011. See the break below its 50d, similar to Feb 2018, May 2019, Jan 2020. The 50d has also turned down. If history repeats, this could be finished, or very close.

Big jump in the homeownership rate today, mostly driven by younger households. We saw a spike in the number of owners, and a decline in the number of renters. This is the highest rate of homeownership since 2008.


I’m staring at a pile of paper on my desk that is my stack of things I found on the Internet that I want to read.
It’s a bit ironic to write this on a blog, but if I come across something on my computer or phone that is longer than a page or two, I print it out and read it on paper.
I have found that when I read on a computer screen or phone, I tend to skim. That’s fine for a short email or a short blog post (as this will be).
But it is not great for an eight page blog post, a white paper on a new crypto project, or a memo from one of my colleagues or portfolio companies.
When I read on paper, I often will use a pen to underline or mark-up the document. I find that leads to better comprehension and retention of the concepts.
I’ve noticed that our children, all of whom are in the mid to late 20s, also read books in paper form and mark them up when reading them. So while reading on paper may be a generational thing, I believe it is also a valuable technique for all ages and all generations.
Found at Abnormal Returns Blog www.abnormalreturns.com
Disclosure
Lansing Street Advisors is a registered investment adviser with the State of Pennsylvania..
To the extent that content includes references to securities, those references do not constitute an offer or solicitation to buy, sell or hold such security as information is provided for educational purposes only. Articles should not be considered investment advice and the information contain within should not be relied upon in assessing whether or not to invest in any securities or asset classes mentioned. Articles have been prepared without regard to the individual financial circumstances and objectives of persons who receive it. Securities discussed may not be suitable for all investors. Please keep in mind that a company’s past financial performance, including the performance of its share price, does not guarantee future results.
Material compiled by Lansing Street Advisors is based on publicly available data at the time of compilation. Lansing Street Advisors makes no warranties or representation of any kind relating to the accuracy, completeness or timeliness of the data and shall not have liability for any damages of any kind relating to the use such data.
Material for market review represents an assessment of the market environment at a specific point in time and is not intended to be a forecast of future events, or a guarantee of future results.
Indices that may be included herein are unmanaged indices and one cannot directly invest in an index. Index returns do not reflect the impact of any management fees, transaction costs or expenses. The index information included herein is for illustrative purposes only.

