1. Nasdaq, Tech, Growth Keep Going
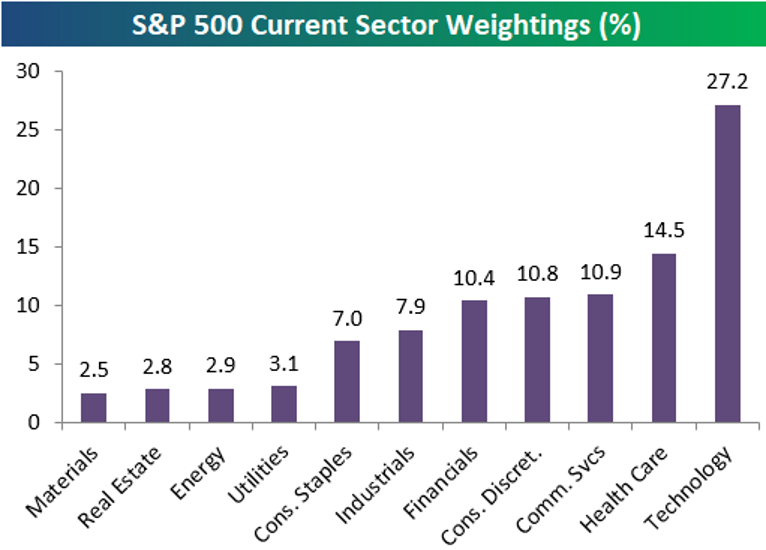
With Technology rallying and once again outperforming to start the new trading week, we wanted to note that the sector’s weighting in the S&P 500 has pushed above 27% recently up to 27.2%. That’s nearly twice as big as the next biggest sector in the S&P — Health Care — at 14.5%. Just three other sectors have weightings above 10%, and they’re all just only slightly above the 10% mark — Communication Services, Consumer Discretionary, and Financials. We’d note that Amazon (AMZN) makes up about a quarter of the Consumer Discretionary sector’s 10.8% weighting in the S&P, and while it is technically a retailer, between its web services division, and strong technology platform, you could argue that its just as much a Technology stock as it is Consumer Discretionary.
Industrials and Consumer Staples have seen their weightings dip below 8%, and the four smallest sectors each have weightings of just 2-3%.
At the moment, Tech’s 27.2% weighting in the S&P is larger than the weightings of the six smallest sectors combined.