1. Nasdaq, Tech, Growth Keep Going
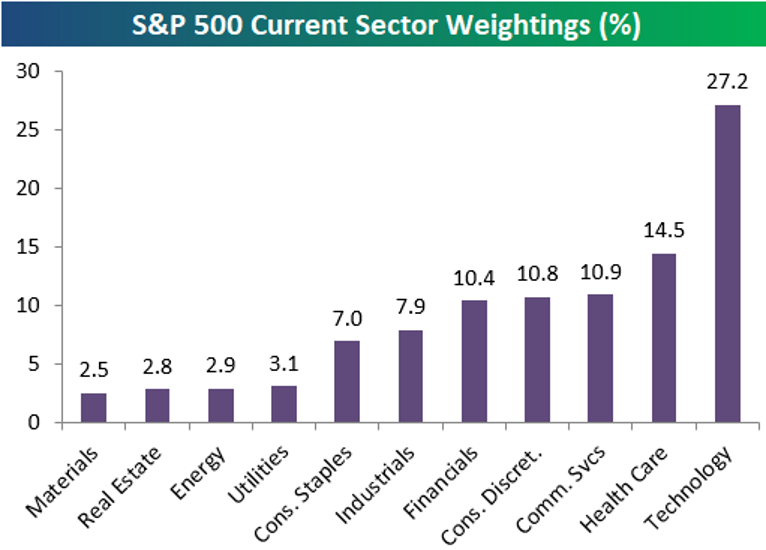
With Technology rallying and once again outperforming to start the new trading week, we wanted to note that the sector’s weighting in the S&P 500 has pushed above 27% recently up to 27.2%. That’s nearly twice as big as the next biggest sector in the S&P — Health Care — at 14.5%. Just three other sectors have weightings above 10%, and they’re all just only slightly above the 10% mark — Communication Services, Consumer Discretionary, and Financials. We’d note that Amazon (AMZN) makes up about a quarter of the Consumer Discretionary sector’s 10.8% weighting in the S&P, and while it is technically a retailer, between its web services division, and strong technology platform, you could argue that its just as much a Technology stock as it is Consumer Discretionary.
Industrials and Consumer Staples have seen their weightings dip below 8%, and the four smallest sectors each have weightings of just 2-3%.
At the moment, Tech’s 27.2% weighting in the S&P is larger than the weightings of the six smallest sectors combined.
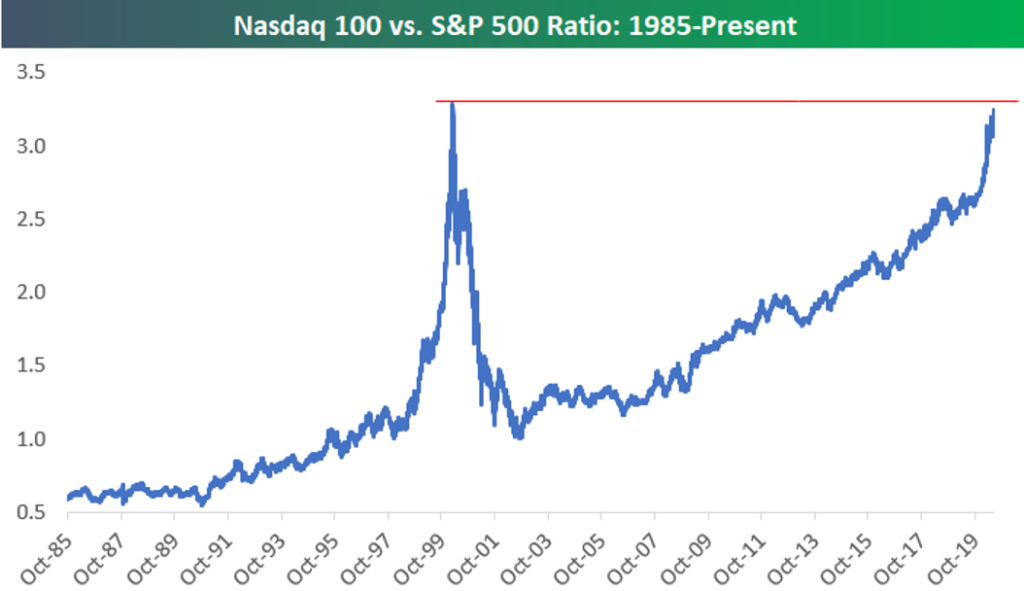
The tech-oriented Nasdaq 100 continues to outperform as well. Below is a chart of the ratio between the index levels of the Nasdaq 100 vs. the S&P 500. The ratio has been on a non-stop march higher since the end of the Dot Com bust in late 2002.
There have only been three trading days in history where the Nasdaq 100 to S&P 500 ratio was higher than the 3.25 level it’s at right now. Those three days came on March 8th, March 9th, and March 10th of the year 2000 — the very peak of the Dot Com Bubble.
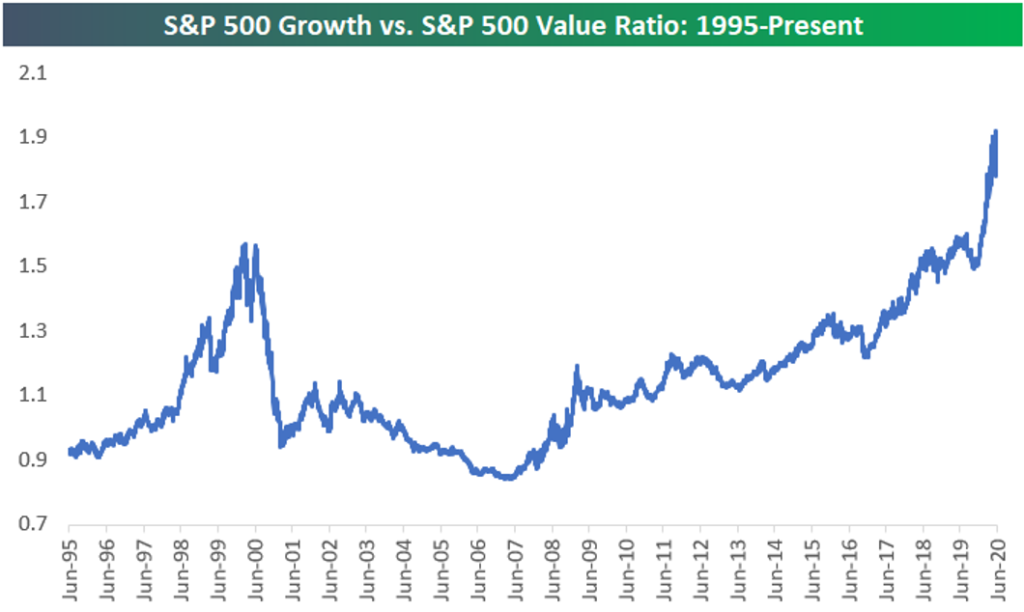
Finally, the Growth vs. Value trade remains lopsided towards growth. Below is a chart of the ratio between the S&P 500 Growth and S&P 500 Value index since 1995. This ratio actually took out its highs from the Dot Com Bubble in mid-2019, and it has exploded even higher over the last year. Value did outperform for a bit in May and early June, but over the last two weeks we’ve seen Growth soar and the ratio has once again made new highs. Click here to view Bespoke’s premium membership options for full access to all of our research.
https://www.bespokepremium.com/interactive/posts/think-big-blog/nasdaq-tech-growth-keep-going
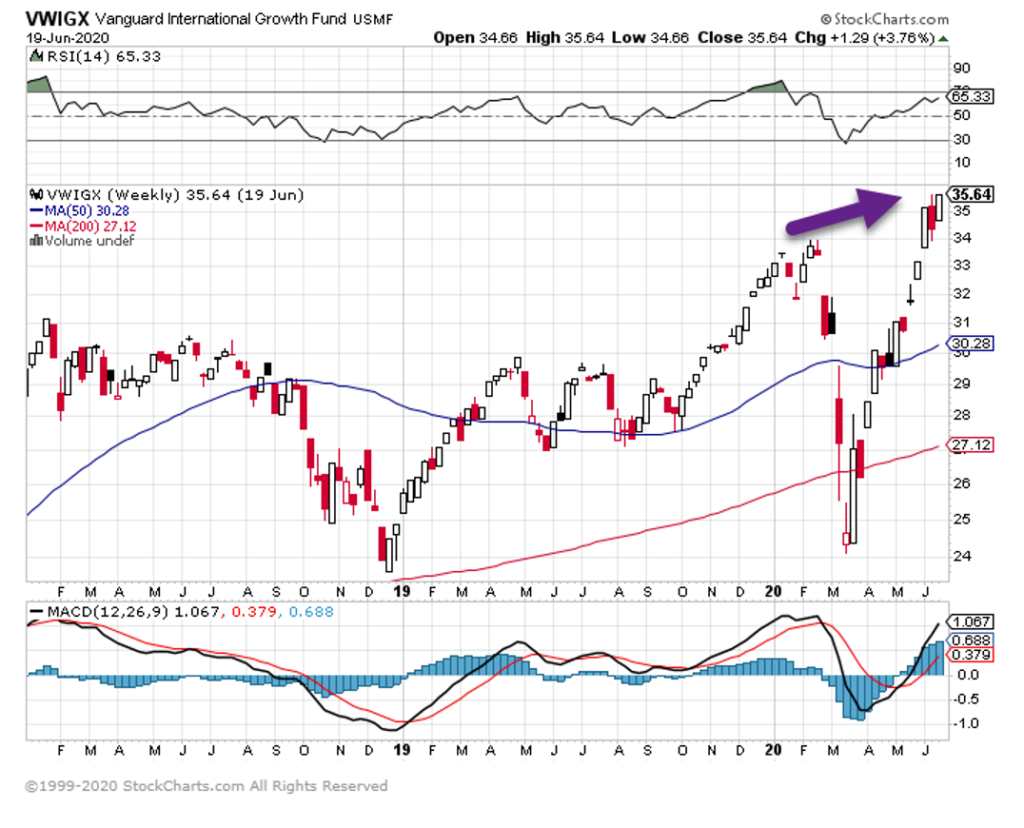
2.Vanguard International Growth Fund Breaks Out to New Highs
S&P 500 has crushed international indices for 10 years but Vanguard International Growth hits new highs before S&P
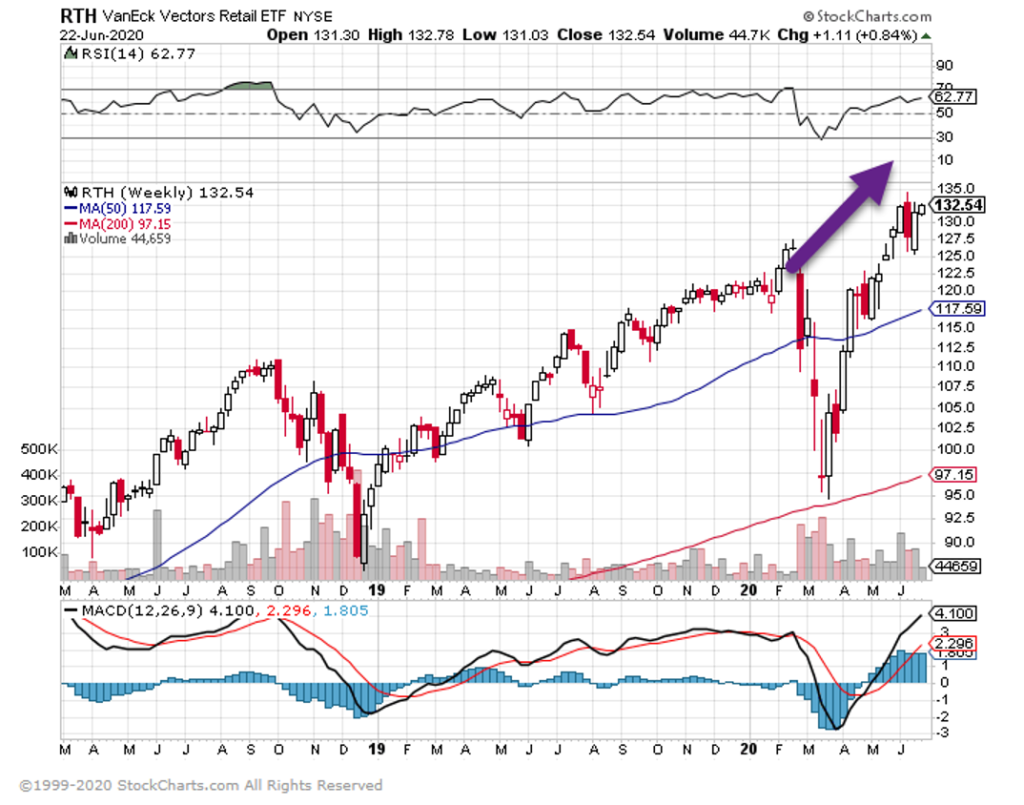
3. Retailers ETF Hit New Highs Before S&P
With Covid RTH Retailer ETF Still Hits Highs
4. Gasoline and Jet Fuel Consumption from the Bottom
Wolf Street
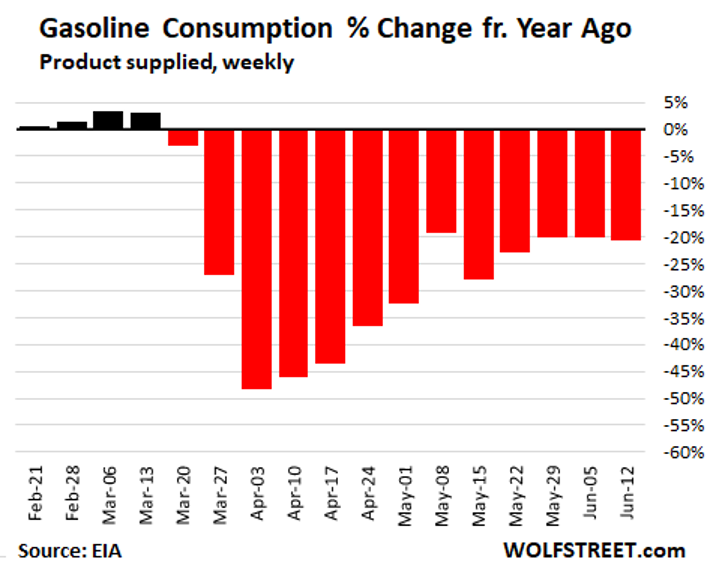
Demand for gasoline collapsed in a stunning and historic manner, starting in mid-March when the measures to slow down the spread of the pandemic took effect, when working from home became the new thing, and when millions of people lost their jobs on a weekly basis and stopped driving to work. Gasoline consumption, after bottoming out in the week ended April 3 with a year-over-year plunge of -48%, to 6.7 million barrels per day, the lowest in the EIA’s data going back to 1991, the great recovery began – and fizzled.
Gasoline consumption in the week ended June 12, at 7.87 million barrels per day, was still down 20.7% year-over-year, according to data reported by the EIA today. It has been about the same 20% year-over-year decline four weeks in a row:
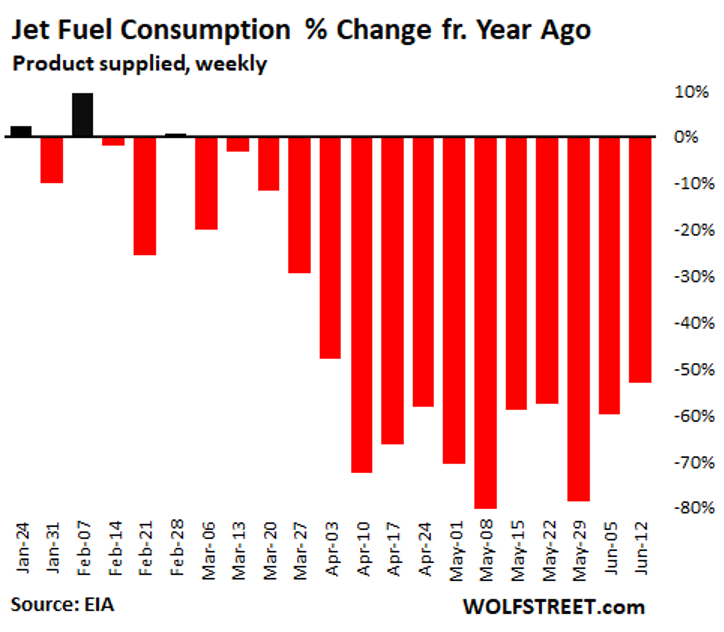
Jet fuel.
Consumption of jet fuel (kerosene type) in the US – based on jet fuel supplied, the EIA’s proxy for consumption – began to get hit in February as flights from the US to China were being cancelled. In April and May, demand for jet fuel collapsed by as much as 80% year-over-year in the two worst weeks. And in the week ended June 12, according to data released today by the EIA, consumption of jet fuel, was still down 53% from a year ago:
Update on the WTF Collapse of Demand for Gasoline, Jet Fuel, and Dieselby Wolf Richter By Wolf Richter for WOLF STREET.
5. TIPS AND GOLD PRICES
President of Yardeni Research YARDENI RESEARCH: In recent Zoom video meetings, a few accounts wondered why the price of gold hasn’t moved much higher in response to the implementation of Modern Monetary Theory by the Fed and the Treasury during the week of March 23.
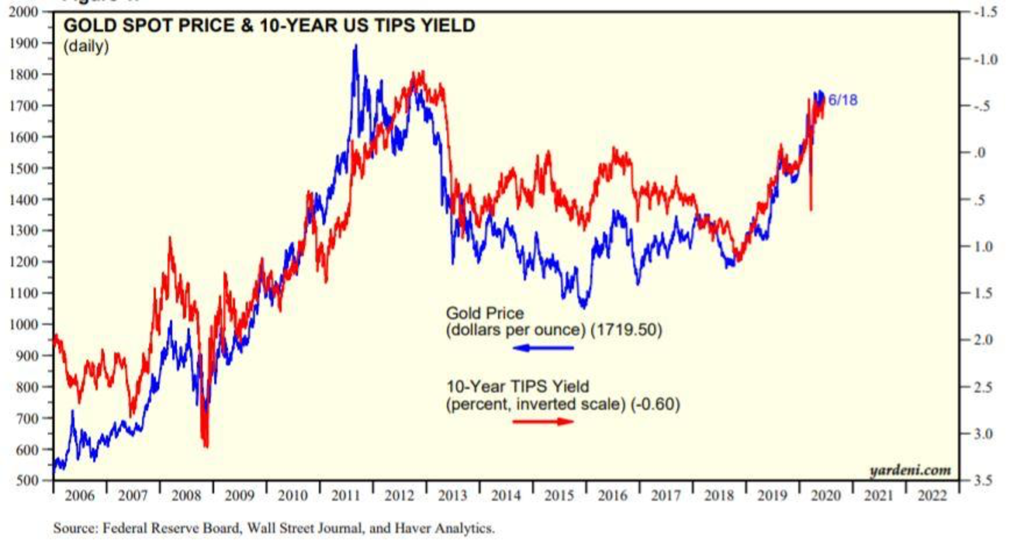
I typically refer to the chart below in these discussions.
There has been a very good inverse correlation between the gold price and the 10-Year TIPS yields since 2006. One possible explanation for this relationship is that the yield is a proxy for the inflation-adjusted cost of borrowing money to buy gold and store it. When the yield is falling (rising), the price of gold rises (falls).
The TIPS yield has fallen from a recent high of 1.17% on November 8, 2018 to -0.60% on Thursday, June 18. Over this same period, the price of an ounce of gold has increased 42%, in line with the TIPS yield.
It seems to me the yield tends to fall when the economy is getting weaker and to rise when the economy is getting stronger. If so, then it should move higher in coming months as the economy reopens and recovers. That could put a lid on the price of gold.
Do you have a better explanation for this strong inverse relationship?
#economy#economics#markets#investing#finance#business#gold#money
https://www.linkedin.com/in/edward-yardeni/
6. These 10 stocks were the most-bought on Robinhood over the last week
5. Disney
Robintrack.net
Disney was the fifth most popular stock added to Robinhood accounts over the past week.
Robintrack shows 24,243 Robinhood accounts bought shares in the company, bringing the total to 611,884 as of Thursday.
The 4% increase in Robinhood account ownership was accompanied by a 3% decline in the stock price, signaling that Robinhood traders that are buying the stock are buying the dip.
4. Amazon
Robintrack.net
Amazon was the fourth most popular stock added to Robinhood accounts over the past week.
Robintrack shows 24,903 Robinhood accounts bought shares in the company, bringing the total to 248,686 as of Thursday.
The 11% increase in Robinhood account ownership was accompanied with flat price action in the stock, signaling that Robinhood traders that are buying the stock continue to add in anticipation of further price gains.
3. TOP Ships
Robintrack.net
TOP Ships was the third most popular stock added to Robinhood accounts over the past week.
The $67 million micro-cap company operates tanker vessels worldwide. Robintrack shows 25,926 Robinhood accounts bought shares in the company, bringing the total to 186,859 as of Thursday.
The 16% increase in Robinhood account ownership was accompanied with a 16% decline in the stock, signaling that Robinhood traders that are buying the stock are buying the dip.
2. Apple
Robintrack.net
Apple was the second most popular stock added to Robinhood accounts over the past week.
Robintrack shows 29,614 Robinhood accounts bought shares in the company, bringing the total to 447,956 as of Thursday.
The 7% increase in Robinhood account ownership was accompanied with flat price action in the stock, signaling that Robinhood traders that are buying the stock continue to add in anticipation of further price gains.
Apple recently hit all-time highs and RBC upgraded the stock, saying it can rise 11% from current levels.
1. Genius Brands
Robintrack.net
Genius Brands was the most popular stock added to Robinhood accounts over the past week.
The $250 million small-cap develops and licenses animated children cartoons. Robintrack shows 30,449 Robinhood accounts bought shares in the company, bringing the total to 195,727 as of Thursday.
The 18% increase in Robinhood account ownership was accompanied by a 36% decline in the stock price, signaling that Robinhood traders that are buying the stock are buying the dip.
Near its peak, the children’s media company saw a 2,500% stock rally over the past two months.
These 10 stocks were the most-bought on Robinhood over the last week-
Matthew Foxhttps://markets.businessinsider.com/news/stocks/robinhood-stocks-top-most-added-last-week-bought-purchased-robintrack-2020-6-1029322911#8-nikola-corp-3
7. Financial Wellness
8. Only 10 Percent of People Are Natural Leaders. The Rest of Us Have to Work on Developing These 3 Qualities
The transition to leadership requires a transformation of thought.
BY MICHAEL SCHNEIDER, HUMAN CAPITAL SPECIALIST, WELLTOWER@MSCHNEIDERTWTS
At one point or another, we all experience great leadership. Although difficult to articulate, the impact is profound. Whether it’s a boss, teacher, parent, or coach, their example leaves a lasting impression, and we’re happier, more engaged, and perform better as a result of their guidance.
Unfortunately, this experience is not the norm. According to the global analytics firm Gallup, about one in 10 people actually possess the talent to manage.
However, in my experience, most companies average more than one manager for every 10 employees. So, with a short supply, where do these other leaders come from?
Carey Smith: The Value of Being Honest With Your Employees
The ironic thing is that the skills getting most people promoted often have nothing to do with being an effective manager. To ensure they don’t lose technical experts to other organizations, many organizations promote prematurely. I believe that’s a big part of the reason why Gallup also found that companies fail to choose the right candidate for the job 82 percent of the time.
The transition to leadership requires a transformation of thought.
If you commit, the results are significant. Organizations with great bosses, on average, produce 147 percent higher earnings per share than their competitors. This boost comes from higher quality work, discretionary effort, and productivity.
Over the past few years of hiring and training managers, and analyzing what makes them great, I’ve narrowed the list down to my top three key traits.
1. Great leaders have a growth mindset and project it onto their teams.
It’s a simple belief that intelligence and talent can be cultivated over time. As opposed to a fixed mindset (the belief that skills and abilities are predetermined), leaders with a growth mindset are more positive and committed to the learning process.
Simple in theory, significant when practiced.
Google, for example, found that managers who have a growth mindset are more eager to learn, challenge themselves, and experiment, and it eventually boosts their performance.
For their teams, it translates into an environment where employees feel safe to try new things. At the first sign of failure, they don’t give up. They embrace challenging work and persevere. They see failure as a part of the learning process, welcome feedback, and believe that potential is limited only by effort.
I don’t know about you, but that’s a manager and a team I would want to work for.
2. Great leaders leverage team diversity by creating safe environments where everyone feels comfortable.
We’ve all been there. Due to the fear of seeming incompetent, we’ve held back questions or ideas. I get it. It’s unnerving to feel like you’re in an environment where everything you do or say is under a microscope.
If a manager doesn’t tackle this head-on and intentionally seek to create a culture where employees feel safe to speak up, then bureaucracies and bias will run meetings and limit the team’s effectiveness. Employees will internalize thoughts and feelings to fit in– and the team will suffer as a result.
Unfortunately, I see this scenario play out too often. Companies do a great job of attracting and hiring diverse talent but never utilize their experience for fear of change.
Instead, managers must foster judgment-free environments and provide air cover so employees feel comfortable letting down their guard. At that point, employees will offer up suggestions, and the team will benefit.
3. They create clarity and energize their teams.
The most effective teams that I’ve been a part of had clear goals, everyone knew what their role was, and the work had a personal significance to each one of us. As a result, we had structure and clarity on what was important, could depend on one another’s contributions, and felt a sense of connection towards our work.
If a manager can’t instill a sense of order by creating a clear mission and purpose, then competing priorities, individual agendas, and confusion will slow the team down. Plus we all want to know why we exist.
For even the most committed employees, daily work can be a grind at times. In a vacuum, tasks can seem menial and unimportant. Without a connection to meaningful work, employee engagement and commitment are tough to come by. However, when people believe their efforts are serving the greater good, tenacity and energy are byproducts–and those are essential traits of high-performing teams.
We may all not be natural leaders. But the good news is, leadership is a trait that can be learned and perfected over time. These three qualities will get you heading down the right path.
Volume 0%
Disclaimer
Lansing Street Advisors is a registered investment adviser with the State of Pennsylvania..
To the extent that content includes references to securities, those references do not constitute an offer or solicitation to buy, sell or hold such security as information is provided for educational purposes only. Articles should not be considered investment advice and the information contain within should not be relied upon in assessing whether or not to invest in any securities or asset classes mentioned. Articles have been prepared without regard to the individual financial circumstances and objectives of persons who receive it. Securities discussed may not be suitable for all investors. Please keep in mind that a company’s past financial performance, including the performance of its share price, does not guarantee future results.
Material compiled by Lansing Street Advisors is based on publically available data at the time of compilation. Lansing Street Advisors makes no warranties or representation of any kind relating to the accuracy, completeness or timeliness of the data and shall not have liability for any damages of any kind relating to the use such data.
Material for market review represents an assessment of the market environment at a specific point in time and is not intended to be a forecast of future events, or a guarantee of future results.
Indices that may be included herein are unmanaged indices and one cannot directly invest in an index. Index returns do not reflect the impact of any management fees, transaction costs or expenses. The index information included herein is for illustrative purposes only