1.Broad Based 1700 Stock Chart Breaks Out.
I am not familiar with this chart but interesting.
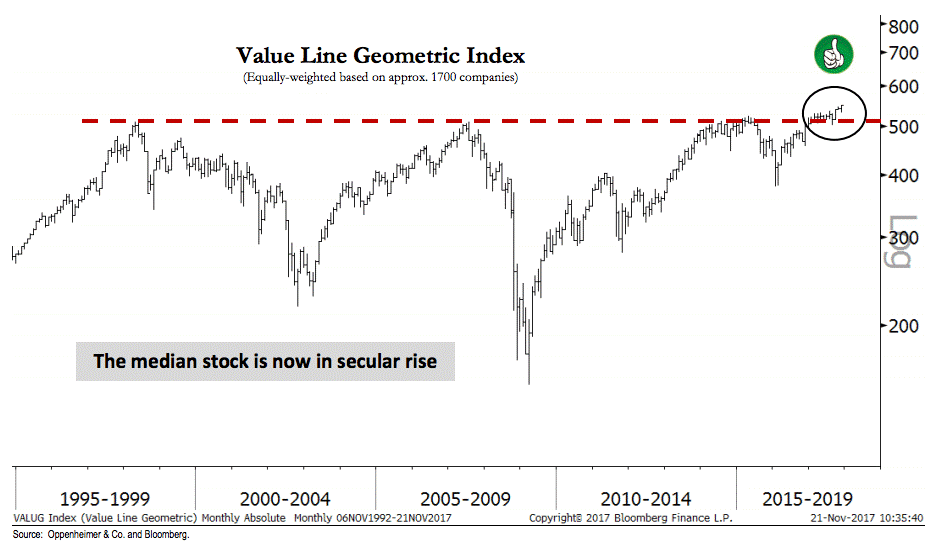
Here’s Ari’s chart and comment:
Advance Is Broader than Many Realize
The message coming from our research is that the S&P 500 is in the midst of a healthy middle innings advance and investors should participate by buying cyclical sectors, like Technology, Financials, and Industrials. One key point we continue to stress is the broad-based nature of the rally. For instance, the Value Line Geometric index, an equal-weighted aggregate of approximately 1,700 companies, has broken above secular resistance dating back to the year 2000, and is accordingly positioned for additional gains, in our view. Rallies that include the participation of many stocks are typically the rallies that continue (or conversely, internal breadth typically narrows into a market top), and with the S&P 400 and S&P 600 indexes also making new highs with the S&P 500, we expect strength to continue.
Josh here – last week witnessed a new all-time high for the Nasdaq 100, Dow Jones Industrial Average, Russell 2000, NYSE Advance-Decline Index and a new 52-week high for the All Country World Index-ex US. You’re welcome to interpret that as a negative indicator if you feel the need to, but you’d be on the wrong side of one hundred years of market history.
These things end with a narrowing, not a broadening. Which could certainly happen – it’s just not happening right now.
Source:
Technical Analysis: Inflection Points
Oppenheimer & Co – November 25th 2017
From Josh Brown Blog.
http://thereformedbroker.com/2017/11/26/secular-bull-takes-flight/