1.100 Year Bond +20%
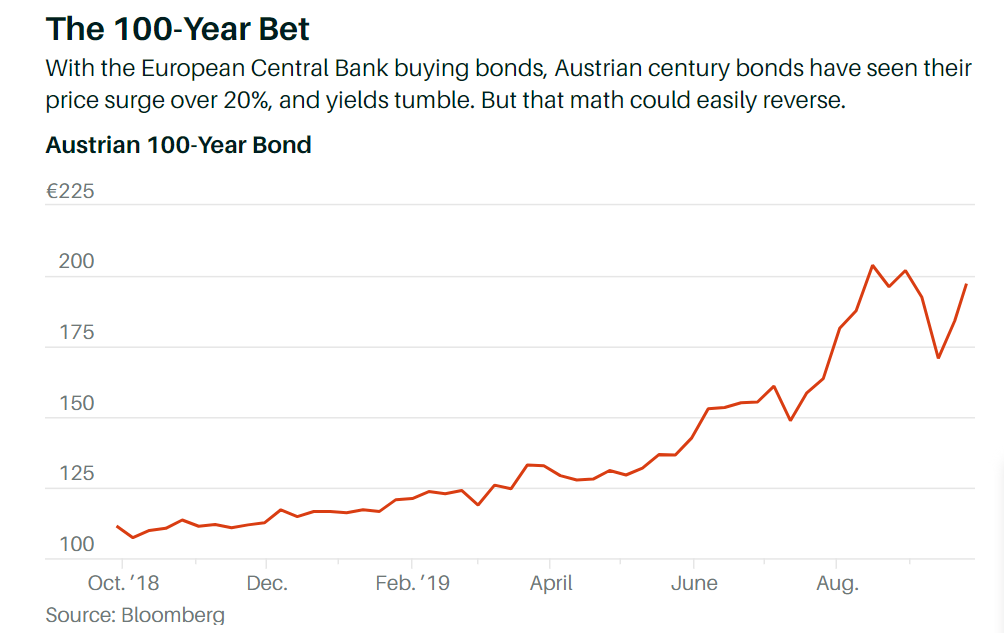
The Bubble Is Deflating for 100-Year Bonds
That valuation still seems bubblicious; a 1% yield on a bond is analogous to a stock with a price/earnings multiple of 100. With a high P/E stock, you’re betting on big growth down the road. A bond returns only face value at maturity, assuming it’s paid off as promised.
The drop in Austria’s century bond’s price to 168 from 210 still qualifies as a bona fide bear-market decline of 20%. Brigden’s price target is for a further fall, to 143.50. Such price swings typically are associated with tech stocks, not stodgy government bonds.
None of the negative bond yields (still totaling $12.8 trillion) would be possible without European Central Bank policies, Brigden points out. “The ECB brought European yields down by two policies; quantitative easing (a pseudo fiscal policy) and negative rates (punishing thrift to boost asset prices).” Those policies may be reaching their limits, however.
Not only is the ECB close to running out of bonds to buy, in the case of German and Dutch debt, he writes, but other European monetary authorities are beginning to question the usefulness of negative policy rates, notably Sweden’s Riksbank. An article published earlier this year by the Federal Reserve Bank of San Francisco also questioned the effectiveness of the Bank of Japan’s negative interest rates.
Write to Randall W. Forsyth at randall.forsyth@barrons.com
Continue reading