1.Speculative Short VIX Positions at Extreme Levels ….Going Back to 2011 Well Below End of 2018 Anomaly.

https://e-markets.nordea.com/#!/article/54825/week-ahead-where-did-all-the-vol-love-go
Continue readinghttps://e-markets.nordea.com/#!/article/54825/week-ahead-where-did-all-the-vol-love-go
Continue readingWhen you’re born has a huge impact on lifetime investment returns. Genetics play a role in our health, and when we’re born has a big effect on our portfolio. An investor born in 1902 that invested 100% in U.S. stocks (VTI) from 1932 to 1962 earned 10.2% per year – turning $100,000 into an inflation-adjusted $1.8 million.
Shifting the investment window to 1965 to 1995 results in only earning $343,000. We can’t control when we’re born, so it’s important to focus on what we can control: saving more money, reducing fees, and increasing diversification.
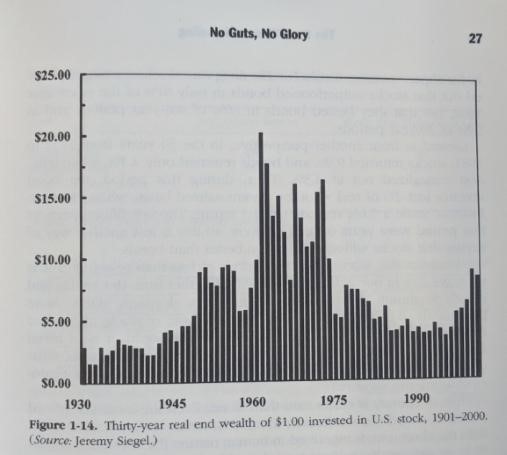
Source: Page 27 of The Four Pillars of Investing
https://seekingalpha.com/article/4286243-book-summary-four-pillars-investing
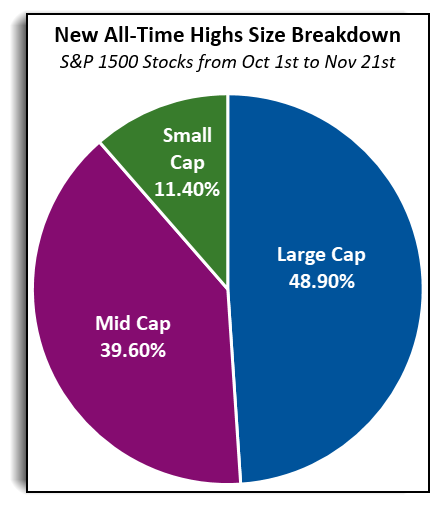
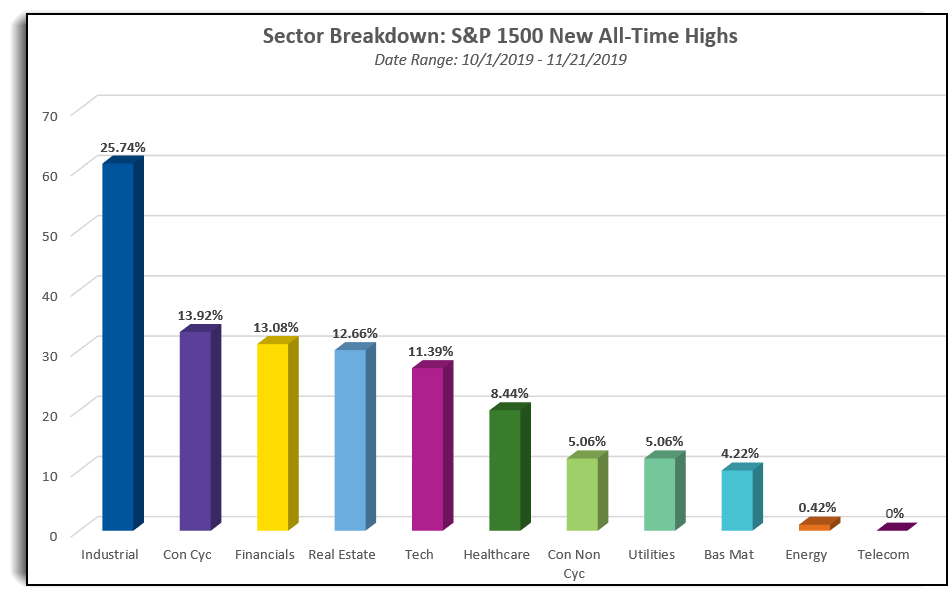
Continue readingWhen we examine these areas of the broader market by way of the aggregated S&P 1500 Index, we find that a total of 237 stocks (about 16%) within the index have moved to new all-time highs since October 1st. As shown in the chart below, we can see that some areas of the market are participating more in this rally than others. Large caps have led the way, not only by performance but also by headcount, accounting for 116 of the 237 stocks (48.9%) moving to new highs. Mid-caps are next in line with 94 stocks (39.6%), followed by small caps with 27 stocks (11.4%).
From Nasdaq Dorsey Wright www.dorseywright.com
Continue reading“Jason DeSana Trennert, who runs Strategas Securities, notes that the M2 money measure—cash, checking, savings deposits, small certificates of deposit, and money-market funds—has been growing at a rapid 10.4% annual clip over the past three months.
Supporting that growth has been the rapid expansion of the Federal Reserve’s balance sheet, which has climbed at a 31% yearly rate over that span. While the Fed says its monthly buying of $60 billion of Treasury bills doesn’t represent quantitative easing—the central bank’s past rounds of securities purchases to stimulate the economy—Trennert calls it a “distinction without difference for owners of risk assets,” such as stocks. The expansion has been international, adds Evercore ISI, which points out that the balance sheets of the European Central Bank and the Bank of Japan also are headed higher.”
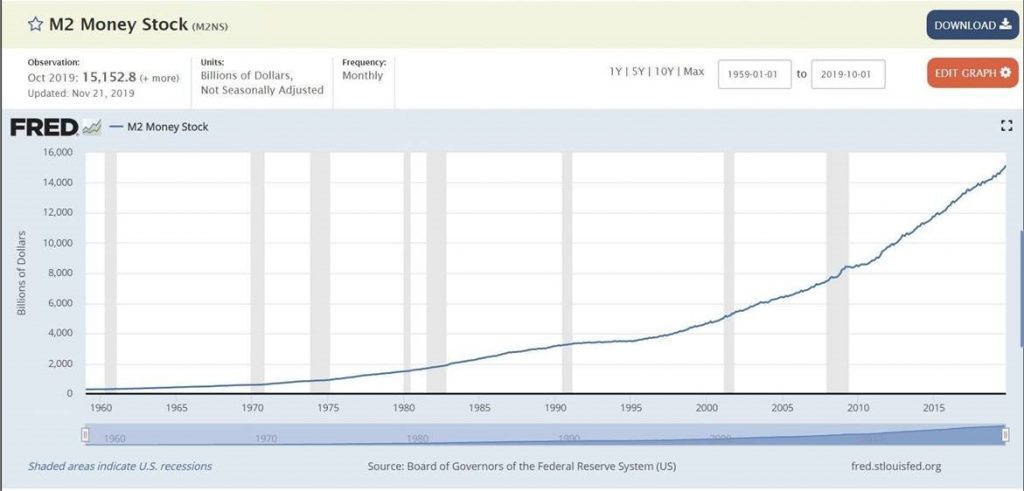
https://fred.stlouisfed.org/series/M2NS
Continue reading
