1. Hot Areas of the Market Already Corrected 20-50%
Market’s “Hot Pockets” Take Some Hits

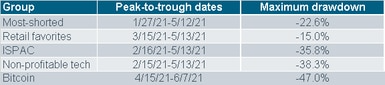
Market’s “Hot Pockets” Take Some Hits
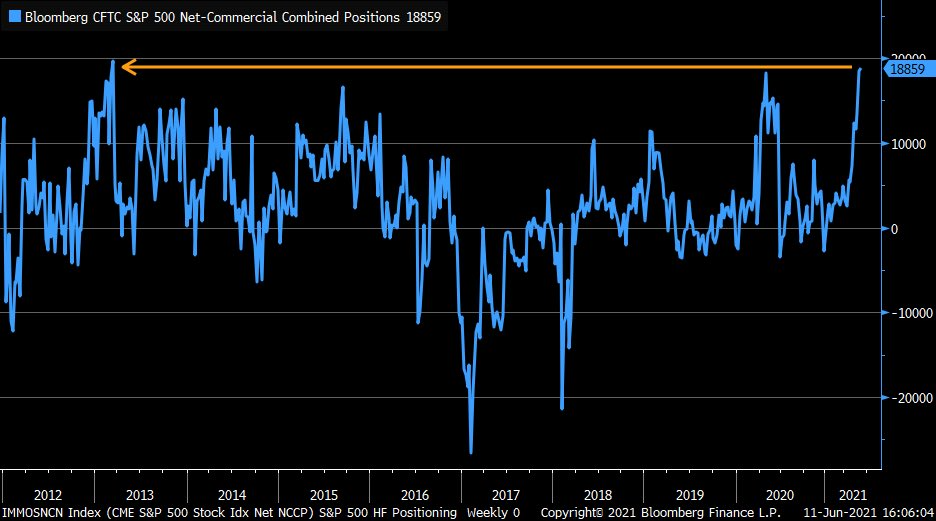
Hedge funds continuing to boost their S&P 500 bets … positioning is most bullish since 2013
Liz Ann Sonders, @LizAnnSonders
Big difference with interest rates 5% 1999 vs. 1.5% 2021


