1. S&P Profit Estimates
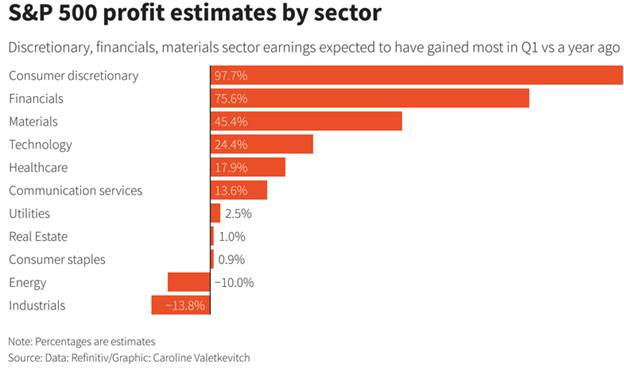
Earnings Kicks off this week – The 20 S&P 500 companies that reported earnings as of Thursday topped analyst estimates by 11% on average. That is about 1.5 times the average for those companies over the last three years and about triple the longer-term average – JPMorgan Chase is due to report Wednesday, and results from other big banks are also due during the week.
Dave Lutz at Jones Trading
2. Q2 2021 Largest Upgrade to Earnings Estimates 10 Years
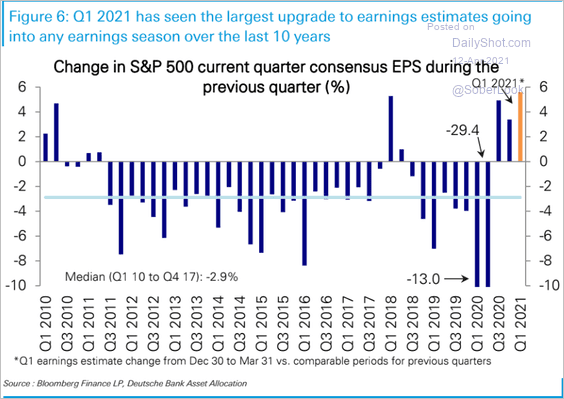
The Daily Shot https://dailyshotbrief.com/the-daily-shot-brief-april-12th-2021/
3. Bitcoin Volatility not Matching Previous Rallies
Holger Zschaepitz, https://twitter.com/Schuldensuehner

4. 10 Year Returns – Bitcoin #1
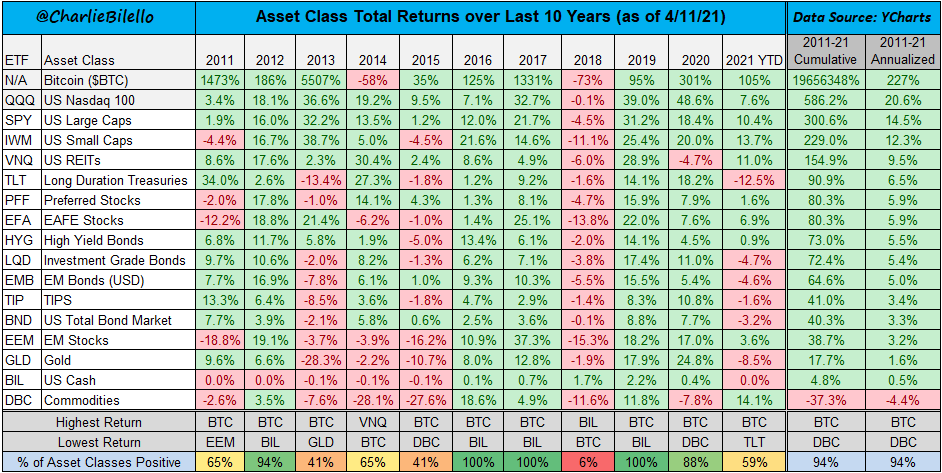
From Barry Ritholtz Blog https://ritholtz.com/2021/04/10-monday-am-reads-306/
5. Rising P/E-This chart shows how much the SPDR S&P 500 ETF Trust’s SPY, +0.04% weighted aggregate forward price-to-earnings ratio has increased over the past five years:
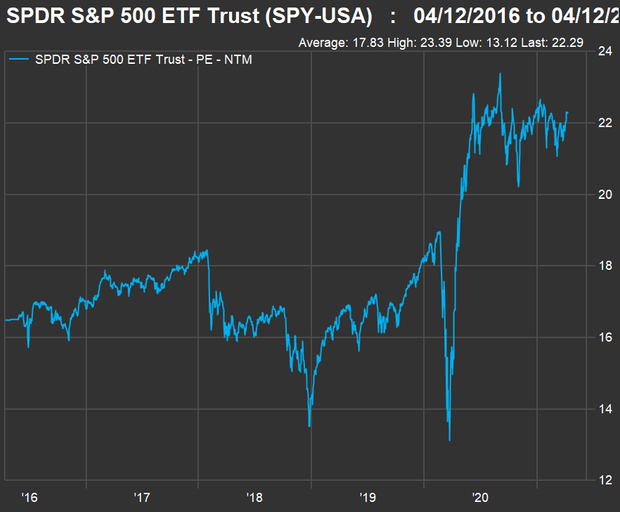
(FACTSET)
These stocks are cheap when you factor in how much their sales are expected to rise
Philip van Doorn
6. THE FED AND THE WEALTH EFFECT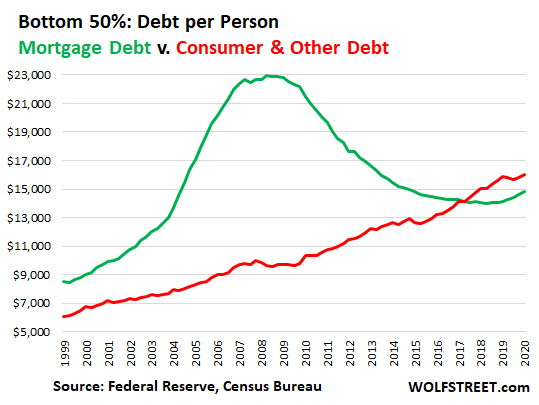
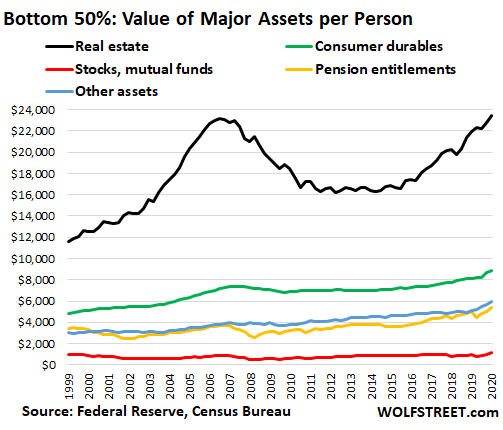
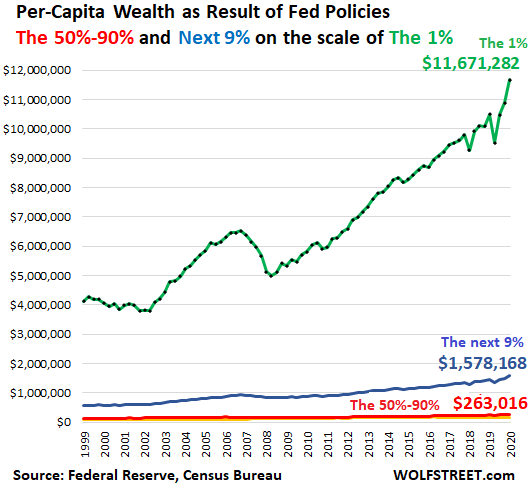
WOLF STREET HTTPS://WOLFSTREET.COM/2021/04/12/I-NOW-TRACK-THE-MOST-IMPORTANT-MEASURE-IN-THE-FEDS-VISION-OF-THE-ECONOMY-THE-WEALTH-EFFECT-AND-HOW-IT-IMPACTS-AMERICANS-INDIVIDUALLY/
7. MCHI China ETF -15% from Highs.
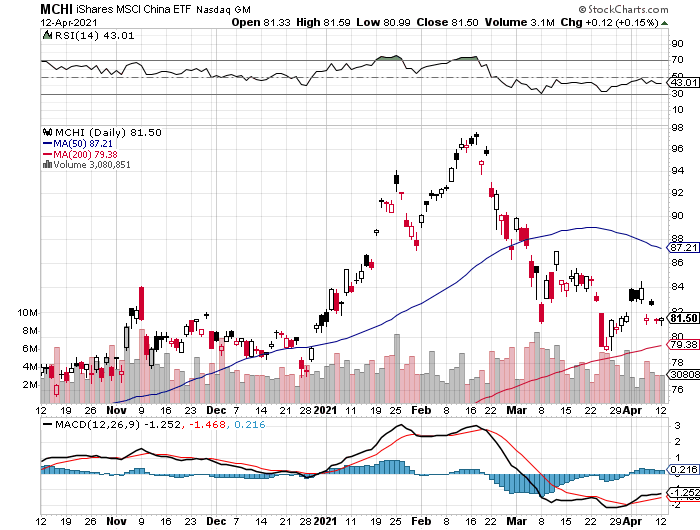
©1999-2021 StockCharts.com All Rights Reserved
8. 360 Million Square Feet of Warehouse in Pipeline
However, one of the largest jumps in the nation is expected in Austin, Texas. In contrast to the 1.7 million square feet of Austin industrial space completed last year, the market is projected to see nearly 10.4 million square feet of deliveries this year — a 511% jump. More than half of this square footage is being added by just two properties: Giga Texas — Tesla’s four-million-square-foot manufacturing facility — and Seefried Industrial Properties’ 3.8-million-square-foot behemoth in Pflugerville, which Amazon will be leasing in its entirety.
Top 10 U.S. Markets for Industrial Completions in 2021
| # | Market | 2021 Deliveries Total Sq. Ft. | 2021 Deliveries # of Buildings |
| 1 | Dallas | 27,947,802 | 81 |
| 2 | Phoenix | 18,439,861 | 65 |
| 3 | Chicago | 16,963,767 | 41 |
| 4 | Inland Empire | 16,390,922 | 104 |
| 5 | Denver | 12,916,791 | 33 |
| 6 | Philadelphia | 12,706,231 | 22 |
| 7 | Memphis | 11,217,638 | 16 |
| 8 | Atlanta | 10,831,662 | 29 |
| 9 | Austin | 10,384,778 | 46 |
| 10 | Houston | 10,345,563 | 55 |
Data provided by CommercialEdge
U.S. Commercial Search Blog=But not all markets are growing. Houston, for instance, is planning completion of 10.3 million square feet this year, which marks a decrease of 41% compared to the more than 17.5 million square feet of new Houston industrial space delivered in 2020. The city has been hit hard by the recent collapse in oil prices — made even worse when they went negative last year. And, while logistics are important, market share seems to be bleeding to Austin and Dallas.
2021 U.S. Industrial Pipeline – Top 10 Projects
| Property | Sq. Ft. | City, State | Completion | Owner |
| Project Rodeo | 4,000,000 | Colorado Springs, CO | June | Amazon |
| Giga Texas | 4,000,000 | Austin, TX | December | Tesla |
| LogistiCenter at I-95 Wilmington | 3,833,950 | Wilmington, DE | June | Dermody Properties |
| 2020 Northgate Commerce Pkwy | 3,800,000 | Suffolk, VA | June | Amazon |
| 2000 East Pecan Street | 3,800,000 | Pflugerville, TX | July | Seefried Industrial Properties |
| 7211 Morgan Road | 3,800,000 | Liverpool, NY | August | Trammell Crow |
| Project Sam | 3,600,000 | Mt. Juliet, TN | April | Amazon |
| Project Arcilla | 3,387,858 | San Diego, CA | June | Amazon |
| Amazon Fulfillment Center at 7001 Zeuber Road | 3,373,876 | Little Rock, AR | March | Fortress Investment Group |
| Project Chico | 2,500,000 | Albuquerque, NM | December | BH DevCo |
Data provided by CommercialEdge
Industrial Property Construction to Hit 5-Year High in 2021, Topping 342 Million Square Feet
By Patrick McGregor https://www.commercialsearch.com/blog/us-industrial-pipeline-2021/
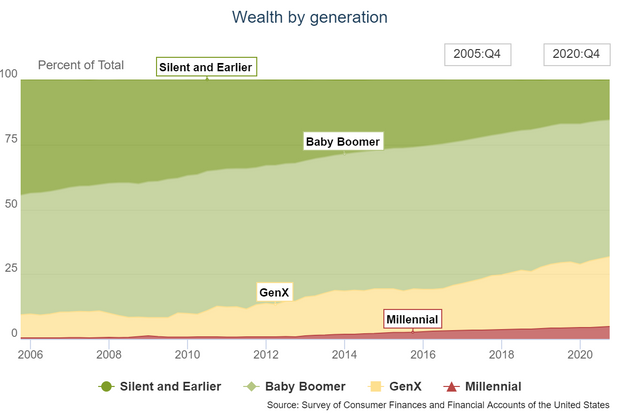
9. Baby Boomers Own Half the Wealth in U.S.
Barrons As of the fourth quarter of 2020, the boomer generation owned just over half of total U.S. household wealth, according to data from the Federal Reserve. That is a $64.72 trillion chunk, versus $5.89 trillion for millennials born after 1980, and $33.06 trillion for Generation X, those born between 1965 and 1980. Boomers saw a substantial boost from early 2020, when that wealth pile was sitting at $56.72 trillion.
by Barbara Kollmeyer
10. Help Your Employees Find Purpose
By Naina Dhingra, Andrew Samo, Bill Schaninger, and Matt Schrimper
Open interactive popup
What employees want—and what they get
Chances are, your employees want more purpose from work than they’re getting. For starters, we know that employees at all levels in the organization say that they want purpose in their lives. Eighty-nine percent of our survey respondents agreed, a proportion that tracks closely with academic research.
Moreover, 70 percent of the employees we surveyed said that their sense of purpose is largely defined by work. Senior executives in our sample nudged that average upward, but even so, two-thirds of nonexecutive employees said that work defines their purpose. This signals a clear opportunity for employers and leaders—an open door to encourage your employees at all levels to develop and live their purpose at work.
Yet when we asked if people are living their purpose in their day-to-day work, the gap between executives and others mushroomed. Whereas 85 percent of execs and upper management said that they are living their purpose at work, only 15 percent of frontline managers and frontline employees agreed. Worse, nearly half of these employees disagreed, compared with just a smattering of executives and upper management (Exhibit 2).
We strive to provide individuals with disabilities equal access to our website. If you would like information about this content we will be happy to work with you. Please email us at: McKinsey_Website_Accessibility@mckinsey.com
Finally, we sought to quantify the scope of the overall challenge for companies by comparing respondents’ answers, regardless of their role, to questions about their desired and actual states.2 This revealed that only 18 percent of respondents believed that they get as much purpose from work as they want. Sixty-two percent said that while they get some purpose from work, they want to get even more.This “purpose hierarchy gap” extends to feeling fulfilled at work. Executives are nearly eight times more likely than other employees to say that their purpose is fulfilled by work. Similarly, executives are nearly three times more likely than others to say that they rely on work for purpose. Interestingly, the group most reliant on work for purpose—across roles—are parents (see sidebar, “Meet the parents”).
Understand the implications
You might consider “getting some but wanting even more” to be pretty good, particularly if you lead or manage big groups of people. You’d be wrong. These less satisfied respondents reported lower average work and life outcomes than more satisfied peers did—everything from reduced feelings of energy and life satisfaction to lower engagement, satisfaction, and excitement about work (Exhibit 3). Negative work and life outcomes for employees inevitably translate to negative outcomes for the business.
Exhibit 3
We strive to provide individuals with disabilities equal access to our website. If you would like information about this content we will be happy to work with you. Please email us at: McKinsey_Website_Accessibility@mckinsey.com
Moreover, the subtlety of some of the findings around frontline employees masks deeper issues. Why, for example, are frontline managers and employees so much less likely than others to rely on work for purpose? The numbers suggest that shortsighted leaders may be conditioning them to feel this way. Indeed, when we dug further into the data we saw that frontline managers and employees were ten times less likely than management-level colleagues to say that they’d had opportunities to reflect on their purpose, and nine times less likely to say that they’d had a manager foster opportunities for them to work on purposeful projects. Similarly, managers don’t seem to be doing much to share the “big picture” with frontline colleagues, who were three times less likely than leaders to say that they can see a connection between their daily work and the organization’s purpose.
While such gaps should distress you—many of the employees closest to your products and customers may have stopped relying on you for the purpose they say they want—the findings also offer hope.
When employees at any level say that their purpose is fulfilled by their work, the work and life outcomes they report are anywhere from two to five times higher than those reported by their unfulfilled peers. And this finding holds regardless of whether employees currently rely on work for purpose. In other words, organizations should aspire to ensure that their employees’ purpose is fulfilled at work, whether or not employees initially think they rely on work for this. Employees—and the organization—stand to benefit anyway.