Good Riddance Ben…The Passed Up Dunk that Ended It All

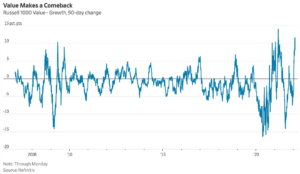
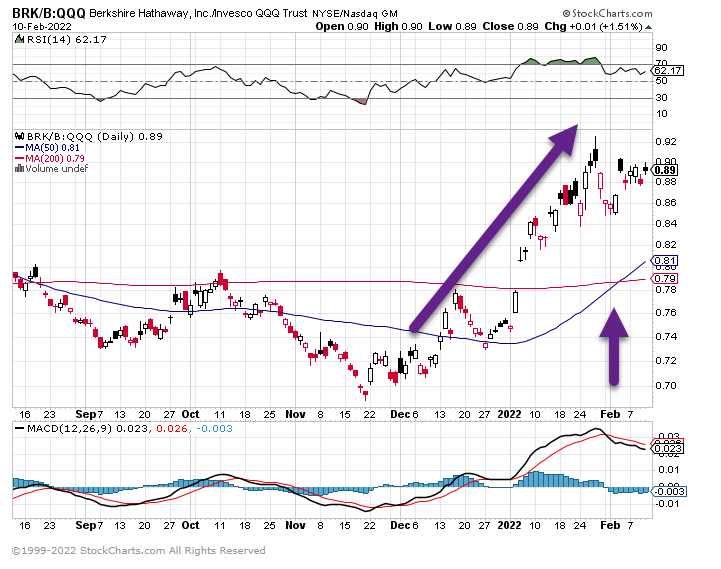
1. Warren Buffett Returns….BRK/B +7% vs. QQQ -10% Year to Date
This chart shows Berkshire vs. QQQ….50day thru 200day to upside
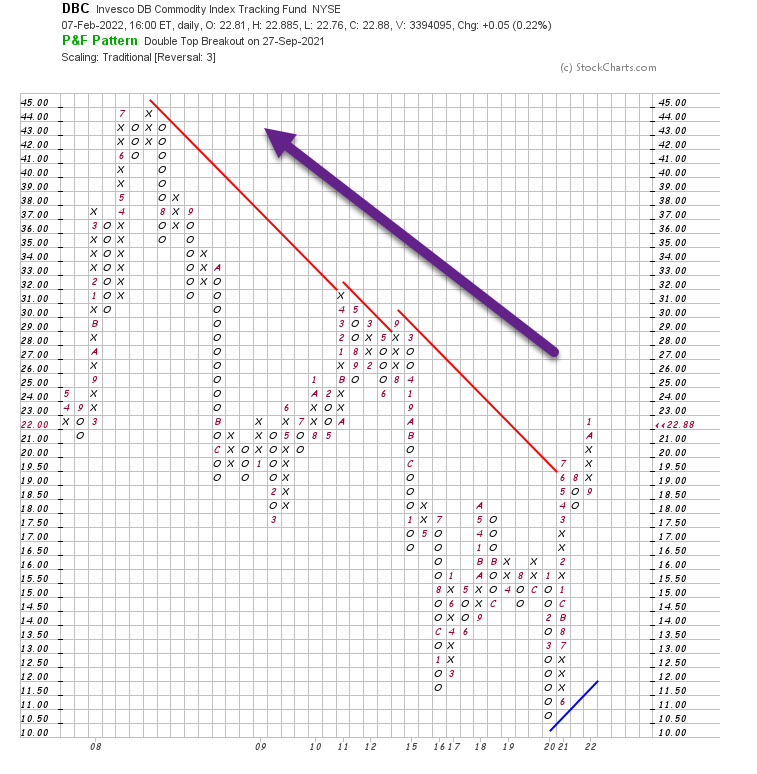
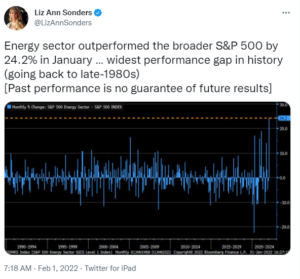
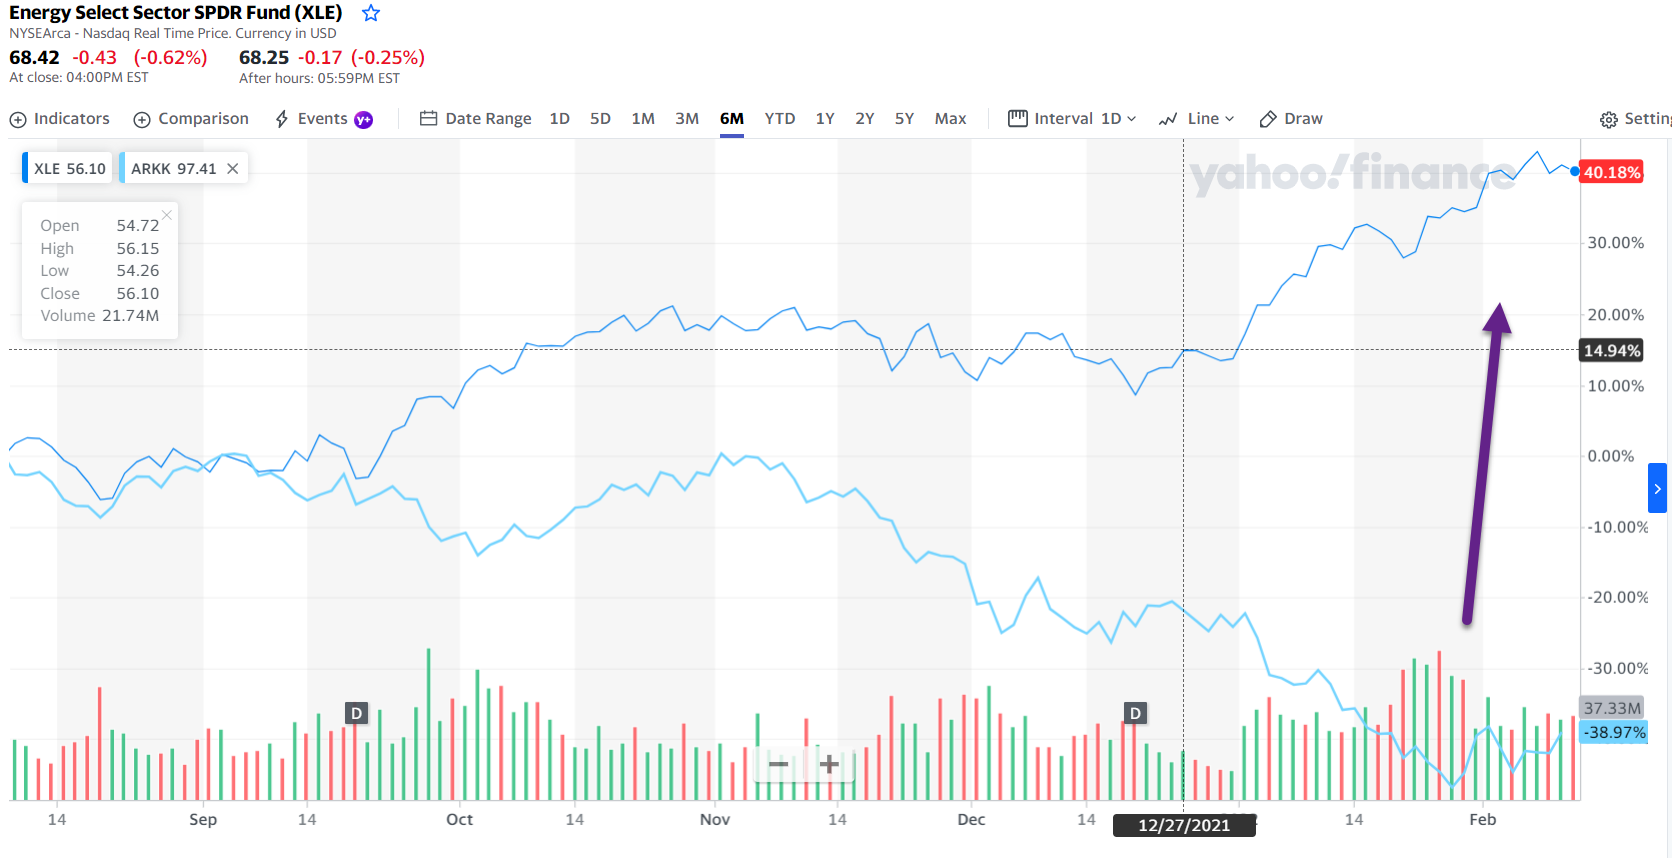
2.Energy is Back…….6 Months-XLE Energy ETF +40% vs. ARKK -40%
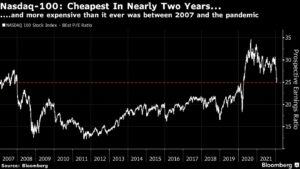
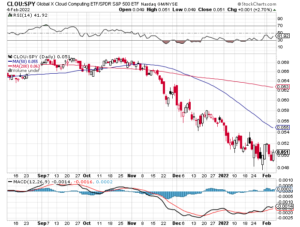
3.Tech Stocks vs. Utilities Ratio Eclipsed 20 Year High
Bespoke Investments–The S&P 500 Technology (XLK) to Utilities (XLU) ratio is another interesting sector ratio chart. This ratio exploded higher during the late 1990s Tech Bubble, but then it plunged from the peak in early 2000 and continued lower right through the Financial Crisis that ended in early 2009. After hitting 2.5 at the peak of the Dot Com Bubble, the ratio got all the way down to 0.5 at its low. Just recently, the ratio briefly ticked above 2.5, eclipsing its prior high made more than 20 years ago. While the Tech sector has struggled over the last couple of months as the prospect of higher interest rates has weighed on growth stocks, this ratio shows that there is still A LOT to unwind if a new secular shift has begun.

https://www.bespokepremium.com/interactive/posts/think-big-blog/sector-and-index-ratios
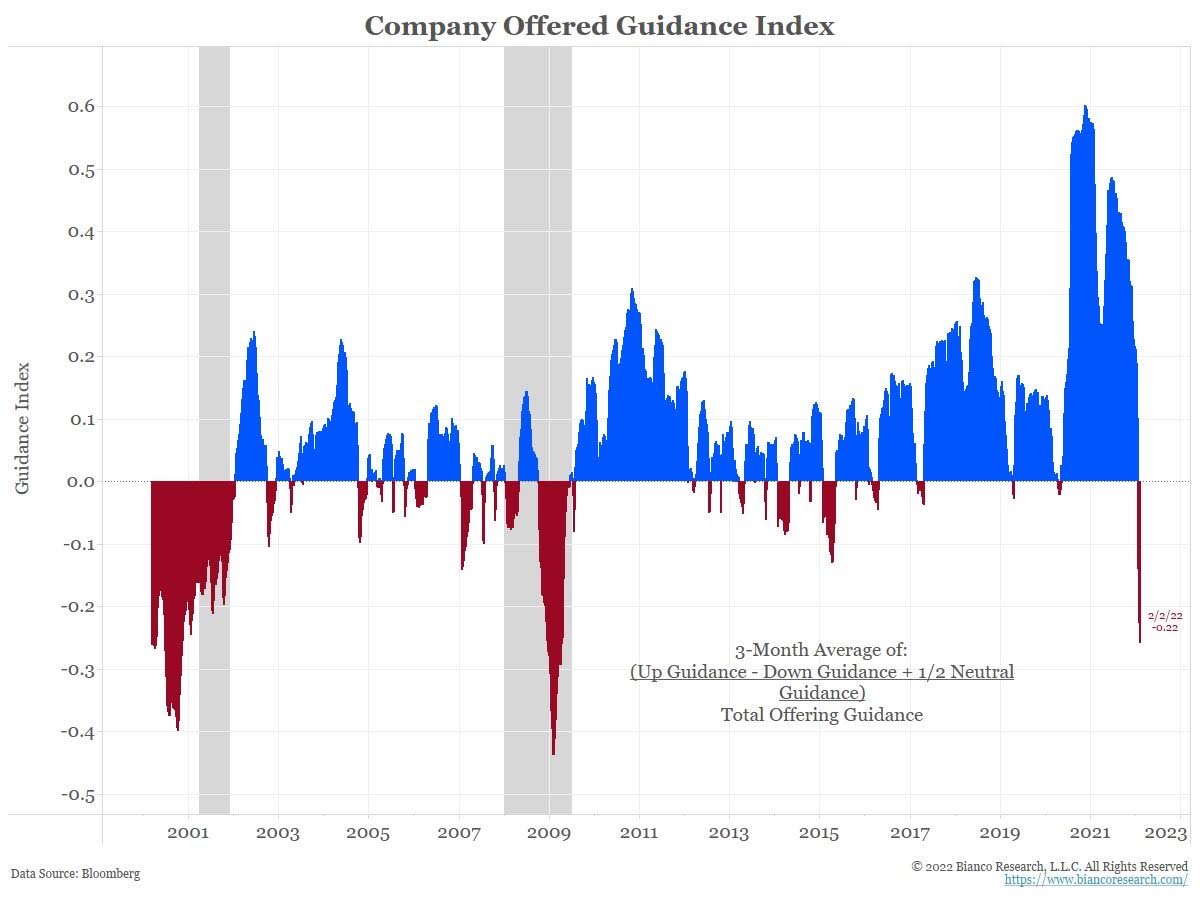
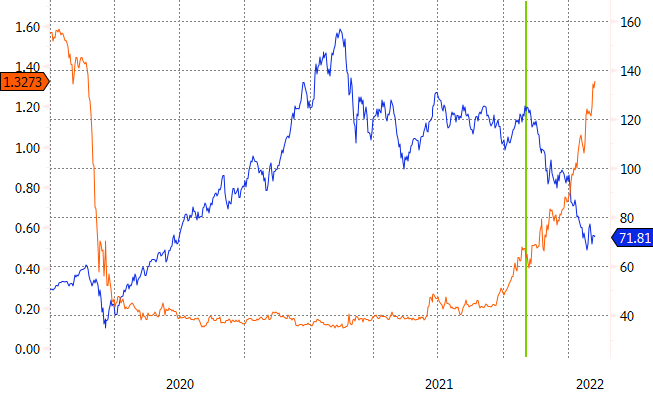
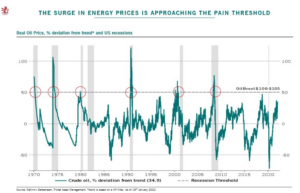
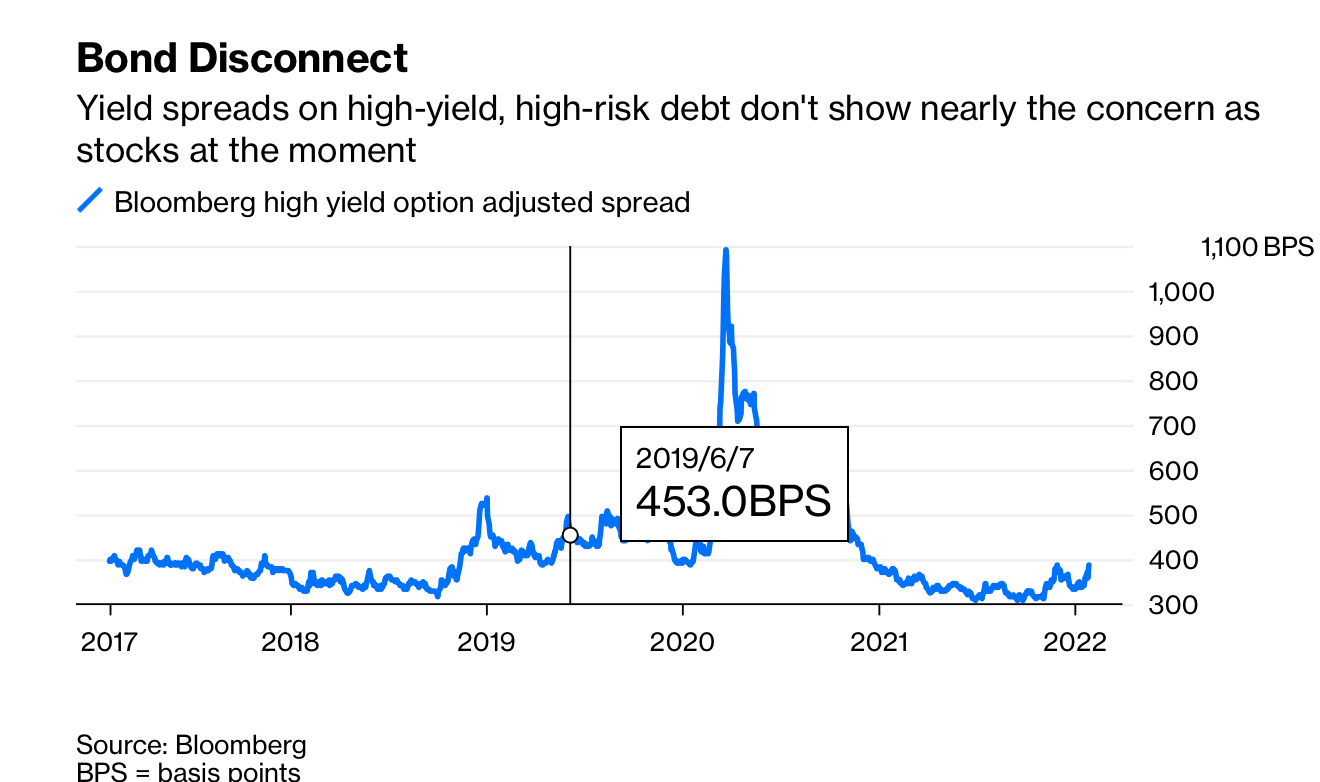
4.Interest Rates and Inflation….Disconnect Takes Another Leg Up
Morningstar-Even as many in the markets continue to expect inflation to begin heading lower over the course of 2022, bond prices fell after the CPI data, sending yield on the widely-followed U.S. Treasury 10-year note toward 2%, its highest level since July 2019. Short-term bond yields also rose.

https://www.morningstar.com/articles/1078786/7-charts-on-the-big-cpi-rise-fed-rate-hike-outlook
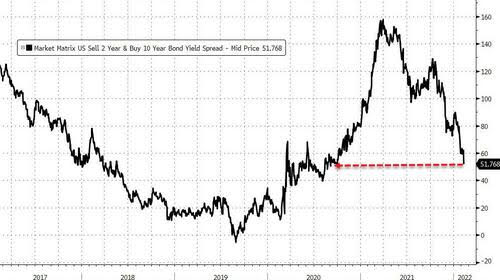
5.Next Watch is Inverted Yield Curve
Zerohedge
The yield curve is collapsing (2s10s)…
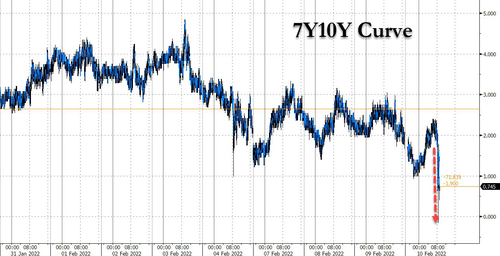
And 7s10s briefly inverted…
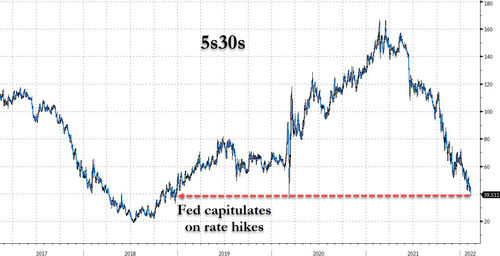
The last time 5s30s spread was this low, The Fed folded on its policy tightening stance…
https://www.zerohedge.com/economics/rate-hike-odds-spike-after-hottest-cpi-40-years
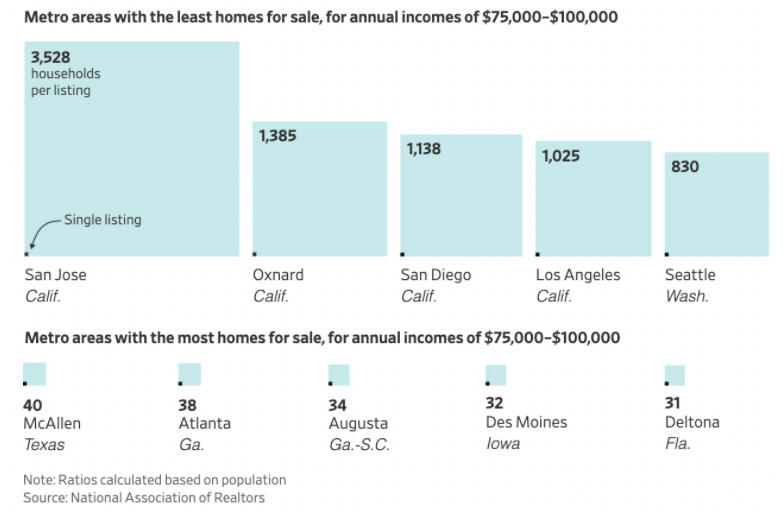
6.Michael Batnick with a Hard to Believe Chart….You Can’t Buy a Home if You Make $75k-$100k
Irrelevant Investor Blog….
https://theirrelevantinvestor.com/2022/02/09/animal-spirits-inflation-at-disney-world/
7. Crypto M&A volume jumped nearly 5,000% in 2021 with the average deal size tripling in value, PwC says
Fernando Gutierrez-Juarez/picture alliance via Getty Images
- The total volume of crypto M&A deals skyrocketed nearly 5,000% in 2021, according to PwC.
- The average transaction size tripled in value from $52.7 million to $179.7 million.
- PwC also found that deals shifted back to the Americas with 51% of them occurring in the region.
Business Insider…The total volume of cryptocurrency mergers and acquisitions skyrocketed nearly 5,000% in 2021, mirroring the stunning rally in the price of digital assets, according to PwC.
In a report published in early February, the Big Four accounting firm revealed that the number of deals surged by 4,846% in 2021 with the average transaction size tripling in value from $52.7 million to $179.7 million.
This was boosted by a number of blank-check deals worth billions of dollars. The top 10 deals, in fact, were all well above that level, led by Bullish Limited, which was acquired for $8.1 billion.
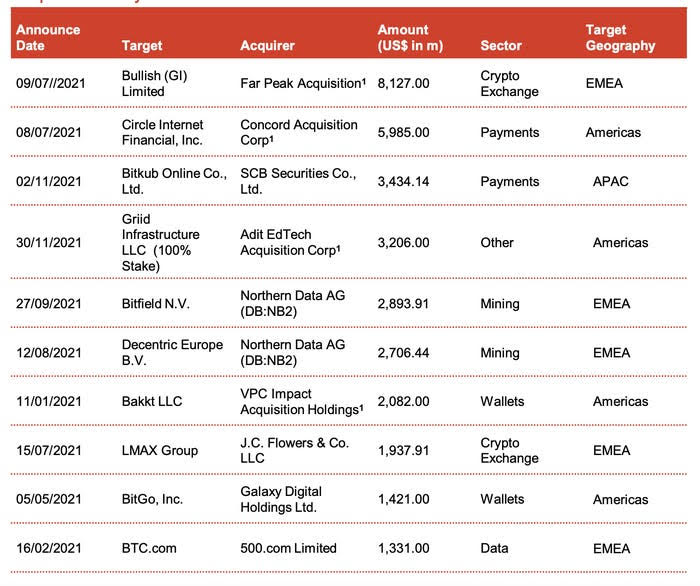
Top 10 crypto M&A deals in 2021 by deal size PwC Analysis, MergerMarket, Capital IQ, Crunchbase, Pitchbook, CoinDesk, CoinTelegraph
Meanwhile, the total value of crypto fundraising deals leapt 645% to $34.3 billion in 2021, with the average fundraising amount up 143% to $26.3 million. The previous year also saw players tap into the SPAC boom.
Below is a the top five investors by deal count in 2021, according to PwC.
| Rank | Investor Name | Selected Investments |
| 1 | AU21 Capital | Chainflip, DEIP, Arcana Network, reBaked, Decentral Games |
| 2 | Genesis Block Ventures | Highstreet, Coin98 Finance, Pyth Network, Calaxy, Dex Lab |
| 3 | Genblock Capital | NearPad, Biconomy, ClayStack, DexLab, Unbound Finance |
| 4 | Coinbase Ventures | Chainflip, MobileCoin, CoinDCX, Liquality, Pintu |
| 5 | Moonwhale | SoldexAI, Beyond Finance, DeepDAO, Chronicle, Panther Protocol |
The firm also found that transactions shifted back to the Americas, with 51% of deals occurring in the region, up from the previous year’s 41%.
However, the Europe, Middle East, and Africa region saw total deal value of $25.5 billion, slightly surpassing that of the Americas despite comprising only 33% of the deals globally. The Asia Pacific region garnered 16% of the total deals at $5 billion.
Digital assets exploded in the past year with various cryptos, from bitcoin to dogecoin, hitting their all-time-highs. The market capitalization of the ecosystem even hit $3 trillion at one point in November, roughly the size of the entire UK economy, amid a broader rally. It has since cooled off and now stands at $2 trillion.
Check out: Personal Finance Insider’s picks for best cryptocurrency exchanges
FTX Chief Reminds Congress That 95% of Crypto Volume Is Offshore–Yueqi Yang
(Bloomberg) — Sam Bankman-Fried, the chief executive officer and co-founder of cryptocurrency exchange FTX, said 95% of crypto trading volume occurs offshore and urged for greater regulatory clarity to attract businesses to the U.S.
“Despite the majority of the intellectual property for the digital asset industry originating from the United States, 95% of volume occurs offshore,” Bankman-Fried told members of the Senate Agriculture Committee during a hearing Wednesday on crypto assets. “The majority of assets are not accessible at all from the United States. It would be great to be able to move that liquidity, that business back on shore.”
Bankman-Fried cited the number as he made his requests for clarity of federal oversight over the digital assets industry. He supported expanding the jurisdiction of the Commodity Futures Trading Commission, which currently regulates the crypto derivatives market, to include spot digital commodity transactions. He also suggested the U.S. create a process to allow digital tokens to be registered in the country, and asked for greater clarity over licensing requirements.
The messages are in line with the request of CFTC Chairman Rostin Behnam, who urged lawmakers during the hearing to give his agency more authority and a bigger budget to oversee trading in the fast-growing cryptocurrency market.
The international FTX.com exchange has seen around $15 billion of assets traded daily on the platform this year, which now represents approximately 10% of global volume for crypto trading, according to Bankman-Fried’s testimony.
https://finance.yahoo.com/
Russia to Regulate Crypto, Dispelling Fears of Ban–Anna Baydakova, Tracy Wang
Instead of banning cryptocurrencies, the Russian government has decided to regulate them, legitimizing a $2 trillion asset class in the world’s 11th-largest economy.
A document setting the principles for the regulation of cryptocurrencies appeared on the government’s official website on Tuesday night. Notably, the plan has the support of the central bank, which had called for a ban on crypto mining and trading.
This is the second major regulatory cloud to have been lifted from the global crypto market in a month. India last week took a step toward legalization with a tax on digital asset transfers. While it carries a hefty rate (30%), the tax was seen by many as putting the fifth-largest economy on track toward legitimizing crypto.
In Russia (population 144 million), residents own over 12 million cryptocurrency accounts and about 2 trillion rubles ($26.7 billion) worth of crypto, according to the government’s document (PDF in Russian).
https://finance.yahoo.com/
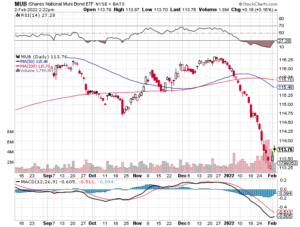
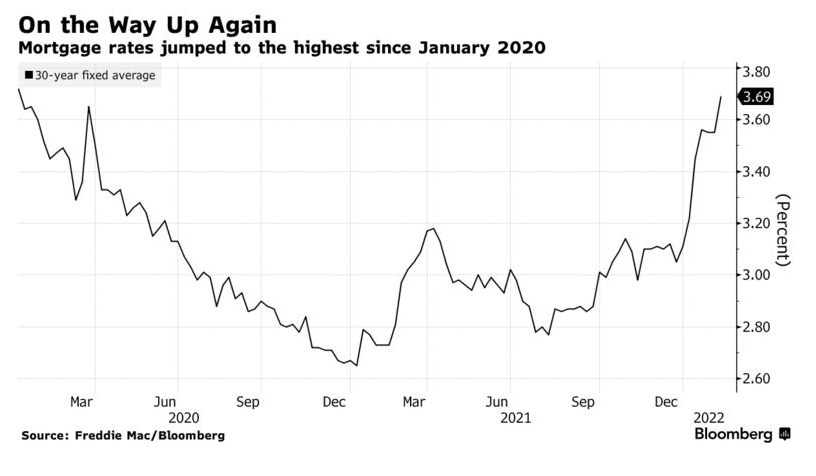
8. U.S. Mortgage Rates Surge to the Highest Level in More than Two Years….4% ?
9.Electric Vehicles Hit 9% of New Cars Sold….Total Cars on Road 6.6m out of 1.4B
CHARTR
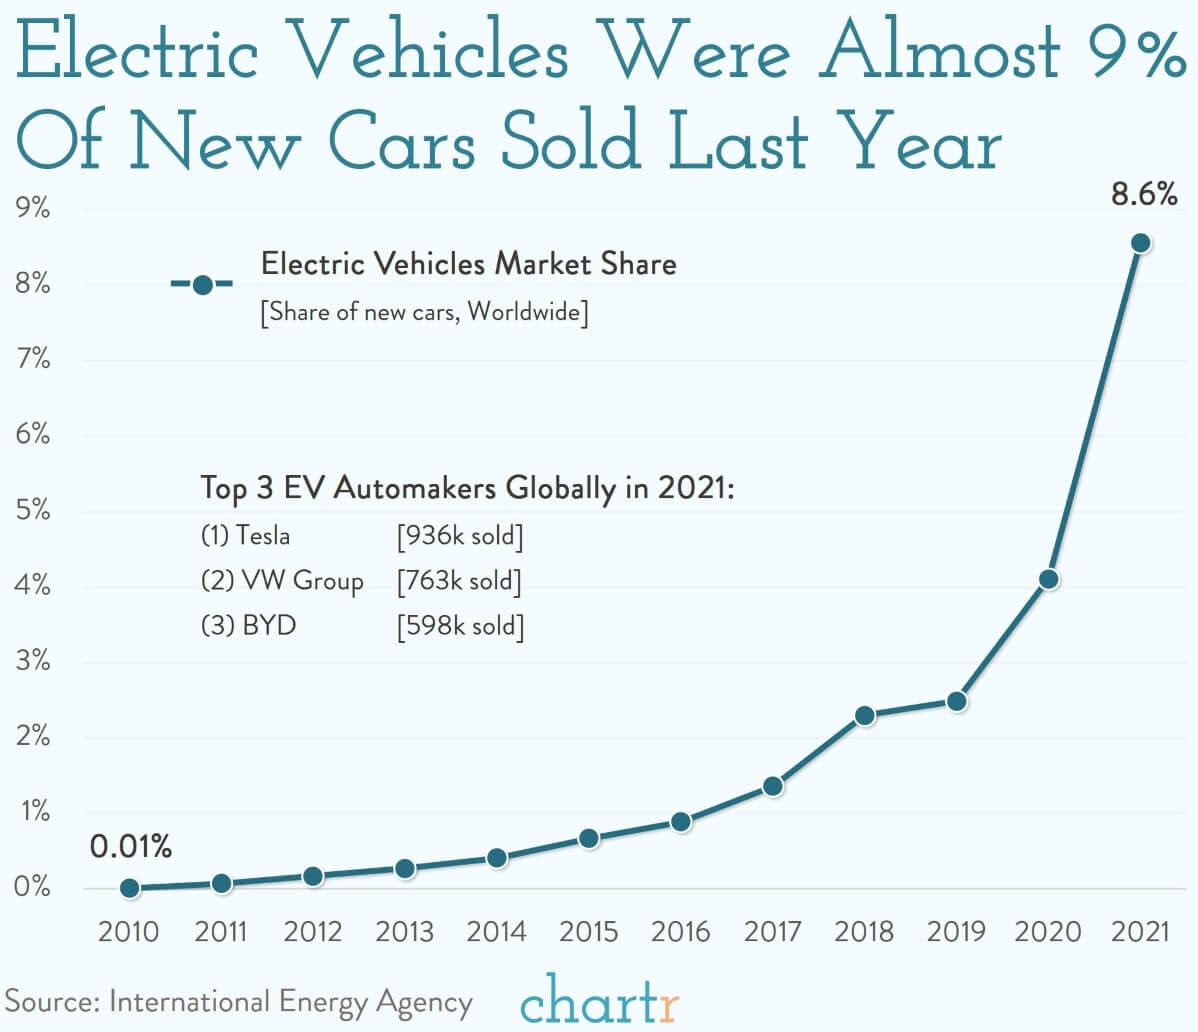
Change: fast, but slow
Almost 9% of all new cars sold last year were electric, according to a new report from the International Energy Agency, more than double the 4% that were electric the year before.
That’s a big leap forward in relative terms, but a more modest one in absolute size. The 9% market share figure represents about 6.6 million actual new electric cars, a tiny, tiny fraction of the 1.3-1.4 billion cars that are estimated to be on the road around the world.
Tesla leads, just
The other interesting data point from this report is that Tesla still leads on electric car deliveries, selling 936k cars last year. That’s ahead of VW Group’s 763k and BYD’s 598k (all of which came in China alone).
Recommended reading: The long road to electric cars.
10.The 6 Most Passive-Aggressive Email Phrases You Use Without Thinking, According to a Recent Study
An ounce of prevention will keep you from sending the wrong message when you hit ‘Send.’
BY SCOTT MAUTZ, KEYNOTE SPEAKER AND AUTHOR, ‘FIND THE FIRE’ AND ‘MAKE IT MATTER’@SCOTT_MAUTZ
Getty Images
Ahh, the art of the email. I’ve always found it to be a terrible medium for communicating--so much can be misconstrued from an unintentionally curt sentence, a light-hearted capitalization–heck, even an emoji that doesn’t convey your mojo the way you meant.
These are the three biggest problems we create for ourselves with email:
1. We don’t communicate enough to get the point across (the biggest problem with communication in general is the illusion that it has actually taken place)
2. We’re not clear enough with the communication
3. Our communication is taken the wrong way (with irritation or offense)
This last one most often happens when we use terms in email that are, in reality, seen as passive-aggressive by the recipient. A recent 1,000-person study by the email platform GetResponse revealed the top 6 phrases perceived as the most passive-aggressive by the receiver.
I’ll reveal them from the least offensive to the most offensive. You can decide to use this information to help you avoid coming across as passively aggressive, or the opposite, depending on your mood.
6. “Going forward I’d prefer…”
Guess what? Going forward the person who reads this line would prefer you not use it again. The “going forward” part is super passive aggressive because it assumes that what happened in the past didn’t work. The reader reads, “Look, what happened in the past is the past, but you can, and will, correct it in the future.” It’s assumptive and dismissive. Even the “I’d prefer” part is weak; it’s language someone uses when they’re beating around the bush on something.
An alternative (and, again, all alternatives that follow are based on the assumption you actually don’t want to come across passive-aggressive, but if that really is your intent, fire away): The alternative here is a good ol’ fashioned face-to-face conversation. When it comes to behavior changes that need to happen, don’t do it over email. Asking change of someone involves emotions, which are always better handled in person.
5. “According to my records…”
Ugh–so formal and uptight sounding. Is this a cross-examination or an email?
An alternative: “I honestly could have this wrong, but from what I think I know…,” or, “The way I see it is…” Fellow columnist Carmine Gallo wrote a great piece on how Tim Cook uses the power of these 5 words, “The way I see it…”
4. “Any updates on this?”
When I read this, I can’t help but picture the sender standing there by my cubicle, peering over the top of it with arms crossed, feet tapping, and a resting jerk face painted on. Try this test: Say “Any updates on this?” out loud to yourself without sounding snippy. Impossible.
An alternative: “I’m guessing you’re swamped–so, sorry to bug you, but what’s the latest on… It would help to know because…” Being brief in email is key so I’m not preaching verbosity here, but this one requires a bit more couching.
3. “Please let me know if I’ve misunderstood.”
What you’re really saying here is “We both know you’ve got this wrong.” This one is the most disingenuous of the lot because the recipient knows that you do not think you have it wrong in any way, shape, or form.
An alternative: If you actually do suspect you got something wrong, pick up the phone for this one. Misunderstandings tend to get more tangled when not ironed out in person. But if you do use email, consider, “I honestly could have this wrong, but…”
2. “Just a friendly reminder…”
It’s not friendly. You know it and I know it.
An alternative: “I honestly hate when people bug me about something, but I’m forced to be ‘that guy/girl’ here in reminding you that… because…”
1. “As per my last email…”
You may as well say, “You obviously didn’t read my last email, so let me try again, dummy.” This one is just plain rude and smacks of the assumption that the recipient has nothing better to do than to sit around waiting for your email to flow into their inbox like gorgeous salmon swimming upstream.
An alternative: “If you don’t mind my reinforcing a point I made before, only because it’s so important…”
We all get enough emails. No one wants more than they need, nor do they want them peppered with what more or less amounts to sass. You can still get your point across by using alternatives.
So, before you hit send, think of the message you’re sending.