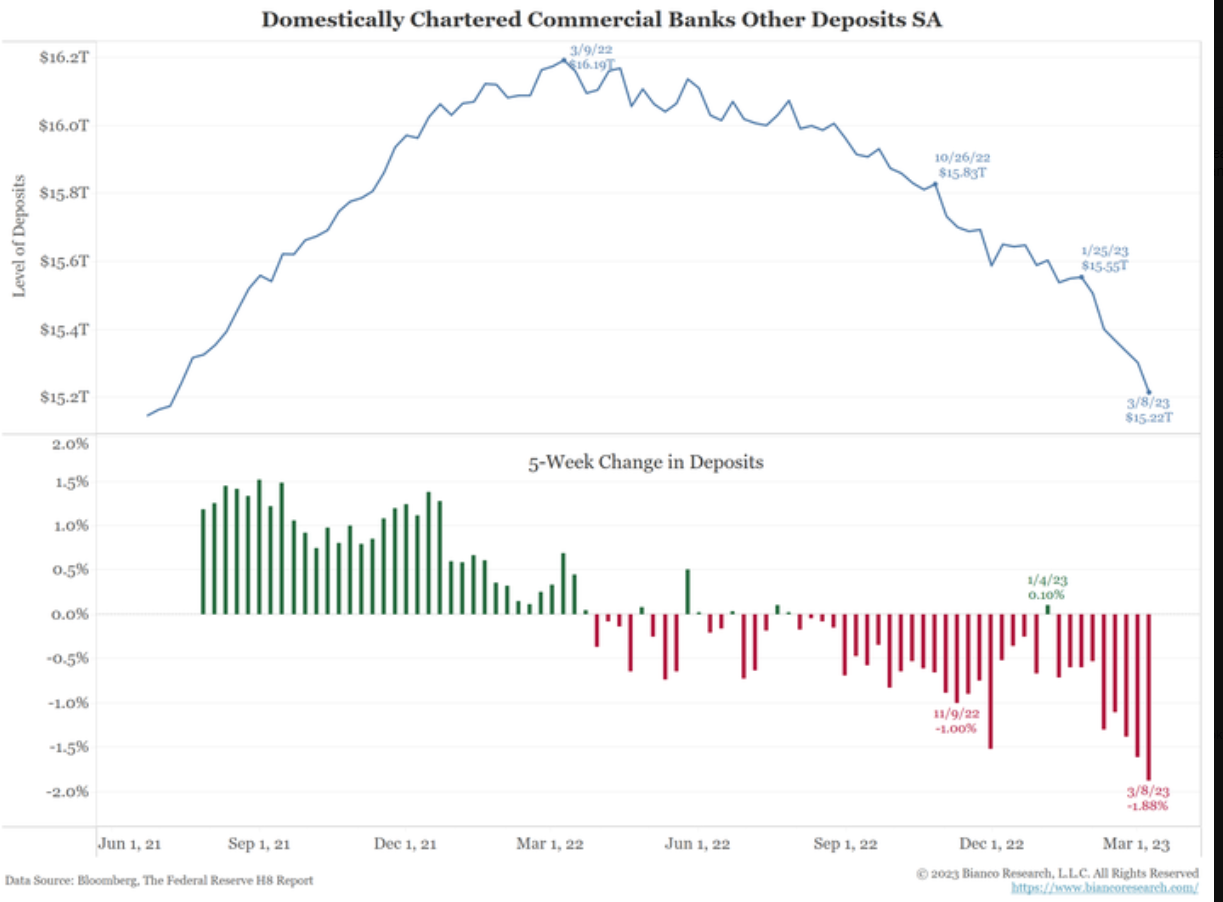
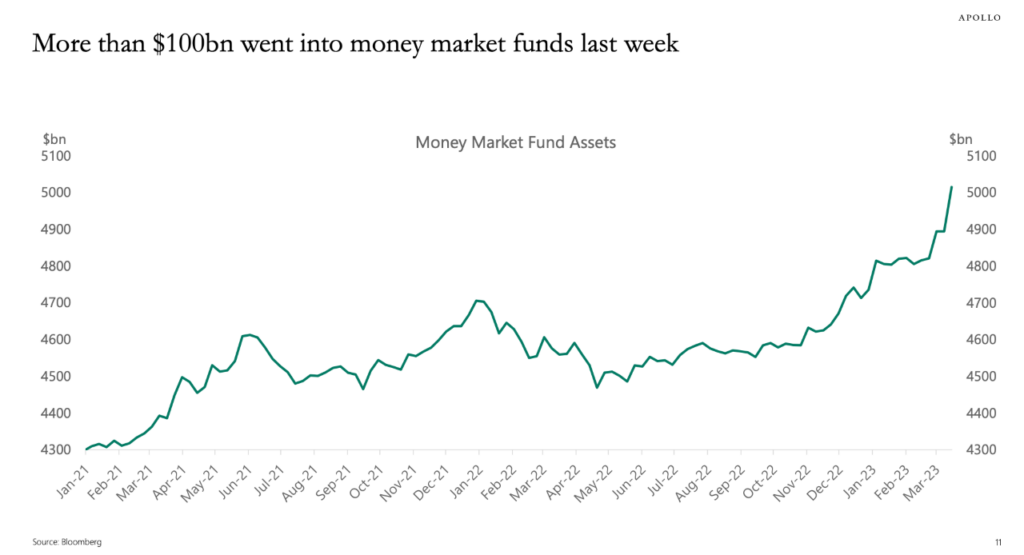
1. History of Spikes in One-Week Money Market Flows.
Irrelevant Investor @michaelbatnick

https://twitter.com/michaelbatnick
2. Fed Fund Rate Now Above Core PCE (the Fed’s preferred measure of inflation)
@Charlie BilelloIn looking at the recent inflation data, the Fed seems to finally have room to pause.
Importantly, the Fed Funds Rate is now above Core PCE (the Fed’s preferred measure of inflation), suggesting that monetary policy is now entering a contractionary stage.

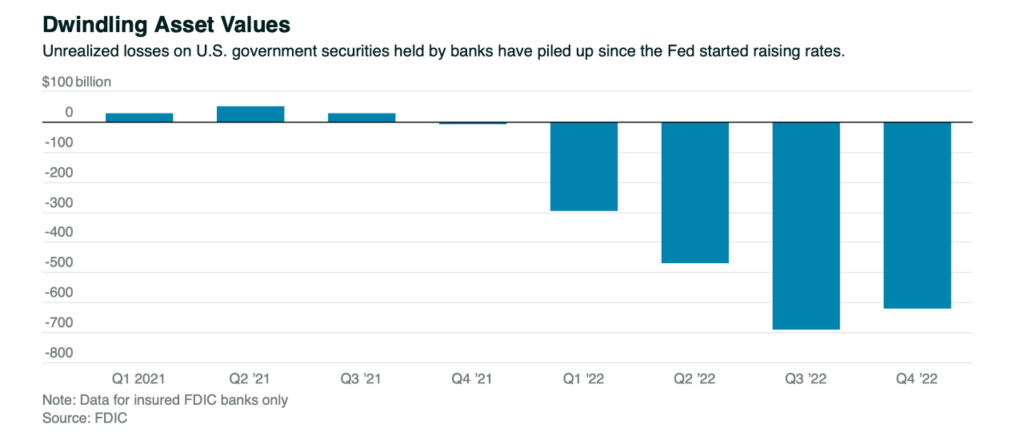
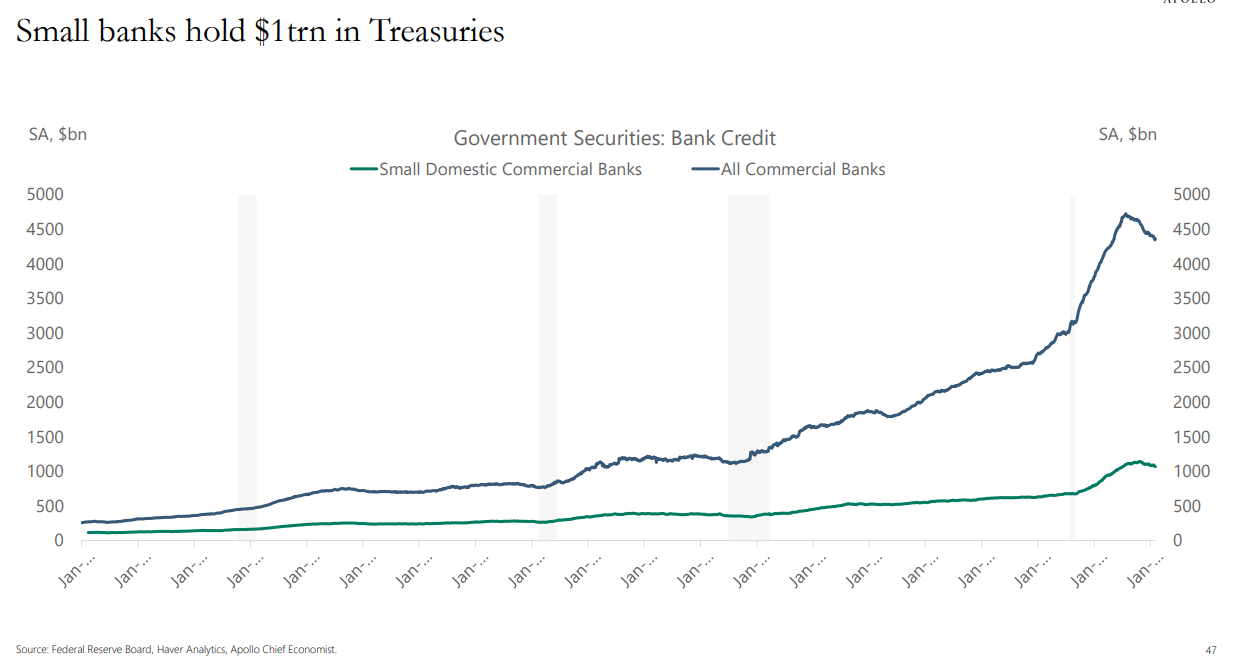
3. Small Banks Hold $1Trillion in Treasuries
Torsten Slok Apollo Group
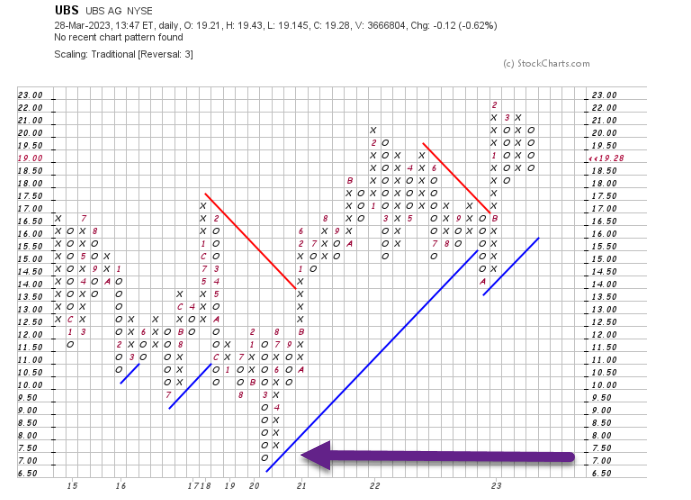
4. UBS Chart Update…UBS Held 200-Week Moving Average Post CS Buyout

UBS Hit $7 During Covid Crisis
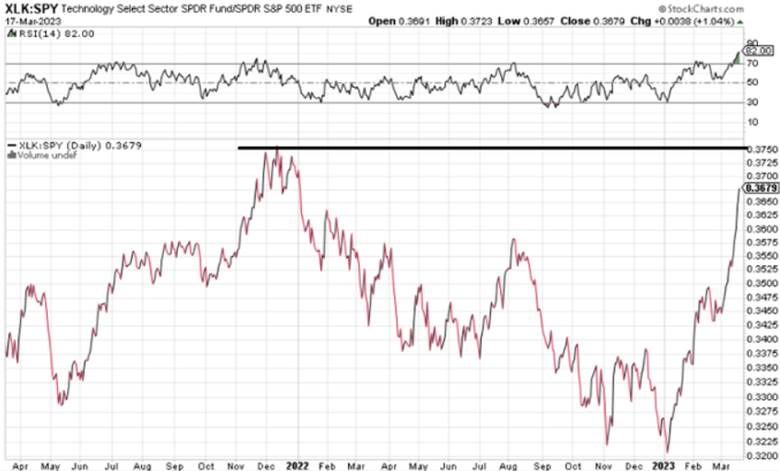
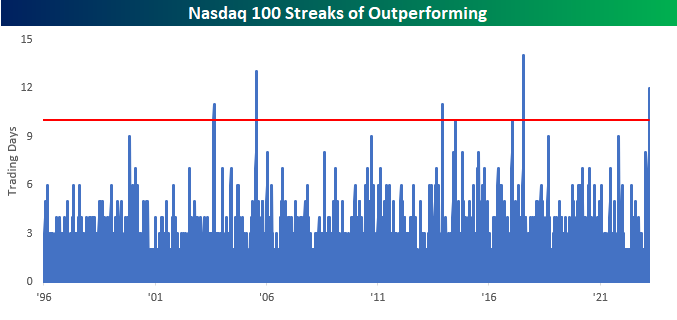
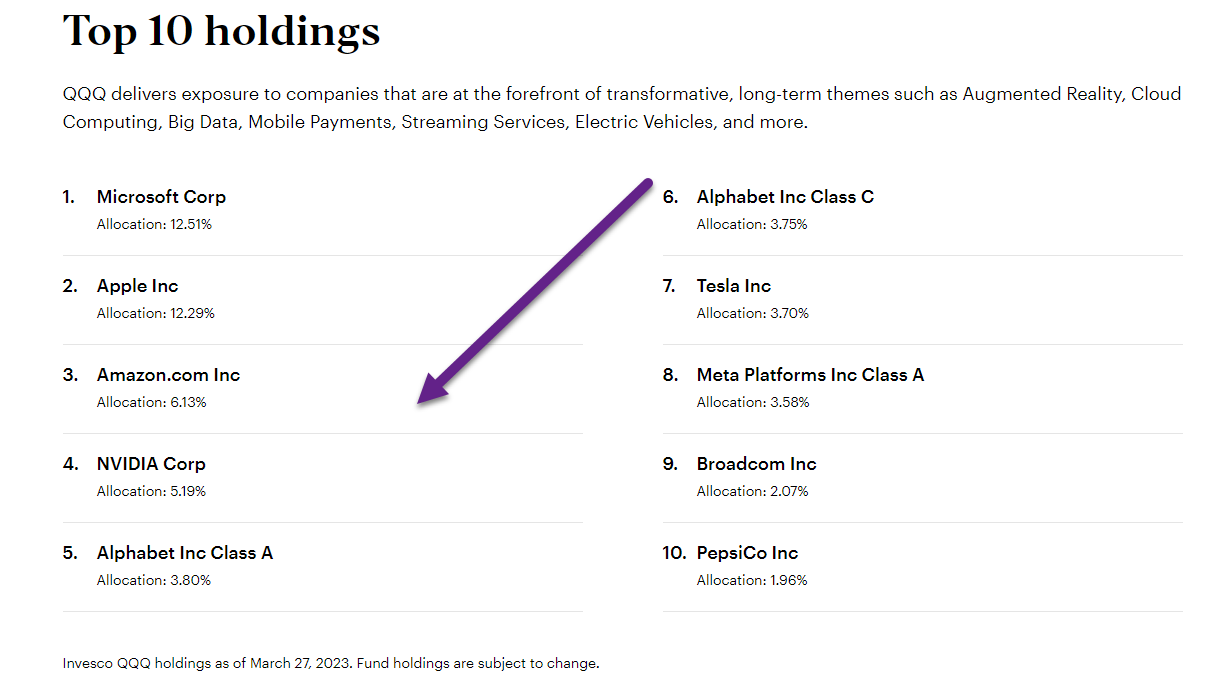
5. Nasdaq 100 Leading 2023…Top 5 Holdings 40% of ETF.
MSFT, AAPL, AMZN, NVDA…40% of QQQ.
6. Cyclical vs. Systemic (structural) Bear Markets.
Jack Ablin Cresset—Good Picture of S&P Corrections

7. Value Vs. Growth Recent History Chart
Zerohedge Value has outperformed Growth for 3 straight days… but note where the reversal happened (this is Russell 1000 Value / Russell 1000 Growth)…

https://www.zerohedge.com/markets/banks-big-tech-breakdown-credit-calm-bitcoin-bullion-bounce
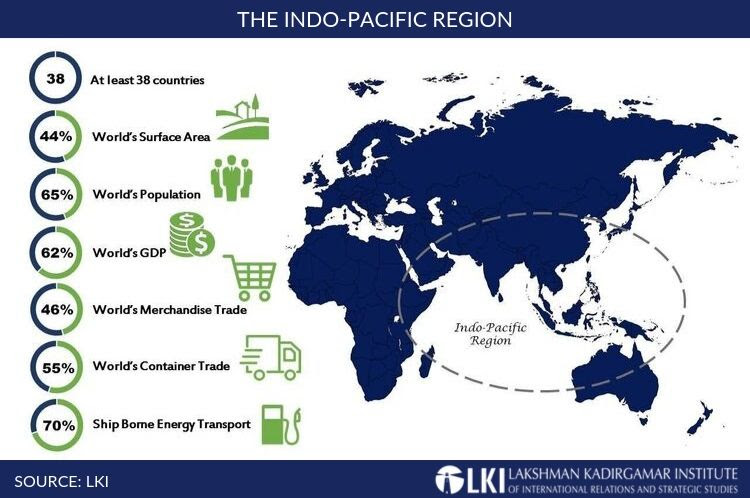
8. Indo-Pacific Region 65% of World Population

9. Ski resorts in California got so much snow they’re going to stay open through June
By Zoe Sottile, CNN A snowboarder speeds down a run at Mammoth Mountain Ski Area. Peter Morning/Mammoth Mountain Ski Area CNN —
The slopes are open for summer, at least in California.
Several California ski resorts have announced they have received so much snow that they plan to stay open until well into the summer months.
Mammoth Mountain, a popular four-season resort located in the Eastern Sierra mountains, announced earlier this week it would be open for skiing at least until the end of July. This is the earliest in the year the resort has ever announced it would be open so late, communications director Lauren Burke told CNN over email.
Burke said that the resort was just 5 inches away from breaking its season snowfall record of 668” inches, set in 2010.
“We aim to keep lifts spinning until as long as conditions allow, which definitely could go into August this season,” she wrote. “Spring skiing and riding conditions are going to be the best we’ve ever seen with the mountain in mid-winter form.”
Snow blankets Mammoth Mountain.
Peter Morning/Mammoth Mountain Ski Area
Similarly, Palisades Tahoe announced on Thursday it would continue to operate the Alpine portion of the resort until the July 4 weekend. They attributed the extension to “Lake Tahoe’s second snowiest winter on record.”
California has faced dramatic weather conditions in the past weeks. The state has been racked by powerful, atmospheric river storms that have brought a deluge of rain and snow after a yearslong, historic megadrought. The onslaught of moisture has relieved the drought and replenished crucial reservoirs, but has also triggered flooding and mudslides in some parts of the state.
Last week, the National Oceanic and Atmospheric Administration reported that it expects the West’s influx of rain and snow will likely turn off in April.
10. A CEO shares the 5 toxic personality types he sees ‘over and over’ again—‘watch for these signs’
Matt Higgins, Contributor@MHIGGINS
The world is filled with toxic people, and working with them is a pain. The key is to learn how to identify them early on, but this can be challenging.
When you meet a person for the first time, you are seeing them at their best selves. So when I find someone hard to get along with or who displays behavior I can’t explain, I get away quickly.
In my 10-plus years of being a CEO, investor and founder, I’ve worked with thousands of people in business, and there are five types of toxic personalities I see over and over again.
To avoid working with these people as much as possible, watch for these signs:
1. Withholders
Withholders are unable to deliver praise or feel happy when someone else steps up and contributes to a group success. They are wired by insecurity or the need for domination.
They resent anyone who possesses skills they don’t have or who doesn’t feel the same self-loathing that they are plagued with. If you are thriving, they see it as their mission to bring you down.
How to handle them: Withholders take advantage of those who don’t speak up. Actively point out the strengths you each bring to the table. Demonstrate that, with your combined efforts, you can both achieve positive results.
2. Hijackers
It’s not always so brazen and extreme, but Hijackers are essentially Withholders with the added bonus of aggression. They want to trade on your vulnerability, take what you are great at, and claim it for themselves.
I’ve seen a lot of Hijackers in managerial roles. What they don’t understand is that to extract value from creatives, they must be empathetic to other people’s deficiencies — instead of trying to exploit them.
How to handle them: Own your achievements and demand credit when it’s due. Hijackers are less likely to bully someone who is assertive and who displays a strong sense of confidence.
3. Victims
Generally, good performers live in a place of gratitude. They don’t feel entitled to success, so they’re thrilled and thankful when it arrives.
But Victims live in a place of constant injustice. They see every bump in the road as confirmation that they are being unfairly targeted.
How to handle them: A Victim’s central argument might be that they are burdened with an undue workload. So raise your hand to volunteer, but know that your offer will likely be rejected. Going forward, remind them that you are willing to help, while also shouting out colleagues who are team players.
4. Martyrs
Martyrs are like victims who actually do the work, but they don’t do it well enough to justify the psychological drain they place on an organization.
They take on as much as they can handle — not to help the broader team, but to confirm the narrative they carry around about themselves as unjustly forced to take on the burdens of others.
How to handle them: Convince them that the greatest service they can do in pursuit of a cause is to delegate to people best suited to perform the individual tasks. Encourage them to redirect their energy into deploying others, instead of taking everything on by themselves.
5. Gaslighters
Gaslighters will spend their energy trying to rewrite reality, to the detriment of everyone around them. They often possess narcissistic traits.
They combine the qualities of Withholders, Hijackers, Victims and Martyrs all in one, attempting to convince people that they are not seeing what’s going on right in front of their eyes.
How to handle them: Put guardrails in place to keep them on track to deliver whatever value they can, and ignore the rest. If you don’t spend any energy engaging with their view of the world, the fire they’re trying to ignite will never take hold.
Matt Higgins is an investor and CEO of RSE Ventures. He began his career as the youngest press secretary in New York City history, where he helped manage the global press response during 9/11. Matt’s book, “Burn the Boats: Toss Plan B Overboard and Unleash Your Full Potential,” is out now. Follow him on Twitter @mhiggins.