
1.Will Corporations Switch from Buybacks to Capital Spending in 2017?
Buyback ETF vs. S&P…New Trend?? Buybacks added fuel to this bull run.
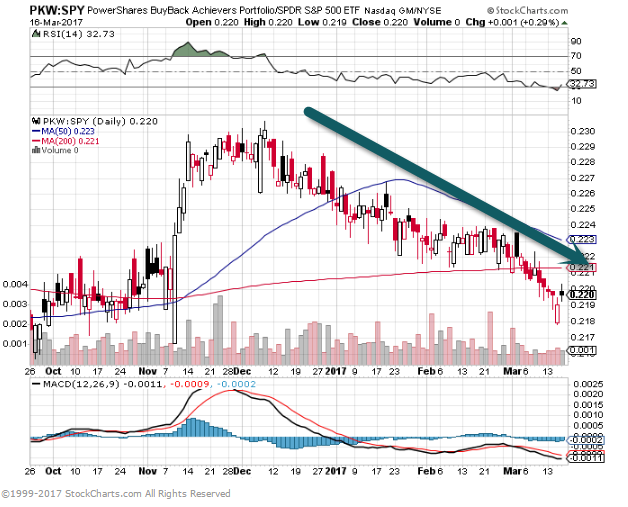
Buybacks 4th qt. 2016 half the previous qt. and lowest since 2014
For years, American companies’ loved nothing more than using their cash to buy their own stock. But tastes may be changing.
But the data also suggest a shift is underway. In the fourth quarter, nonfinancial companies bought back a net $323 billion in equities, at a seasonally adjusted annual rate, half as much as in the previous quarter and the lowest amount since the second quarter of 2014.
And unlike the third quarter, companies’ capital spending surpassed their cash flows, which is a return to normal. Companies usually borrow to spend, betting the payoff from the investments more than pay off the debt.
https://www.wsj.com/articles/stock-buybacks-are-so-yesterday-1489088699
Continue reading →
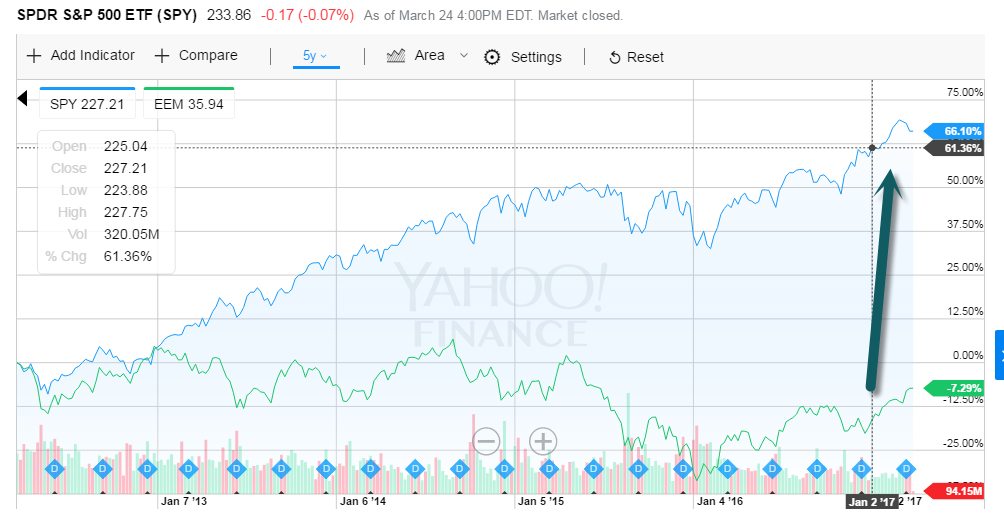
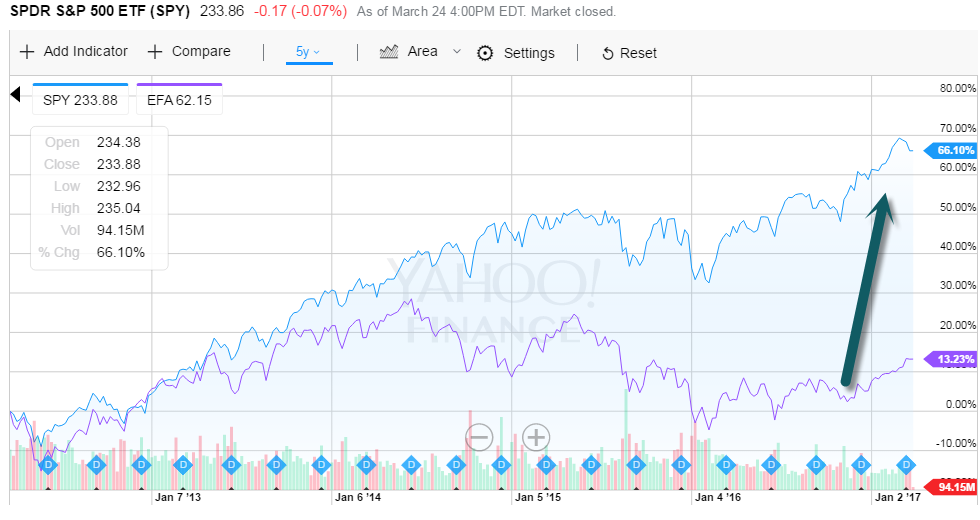 www.yahoofinance.com

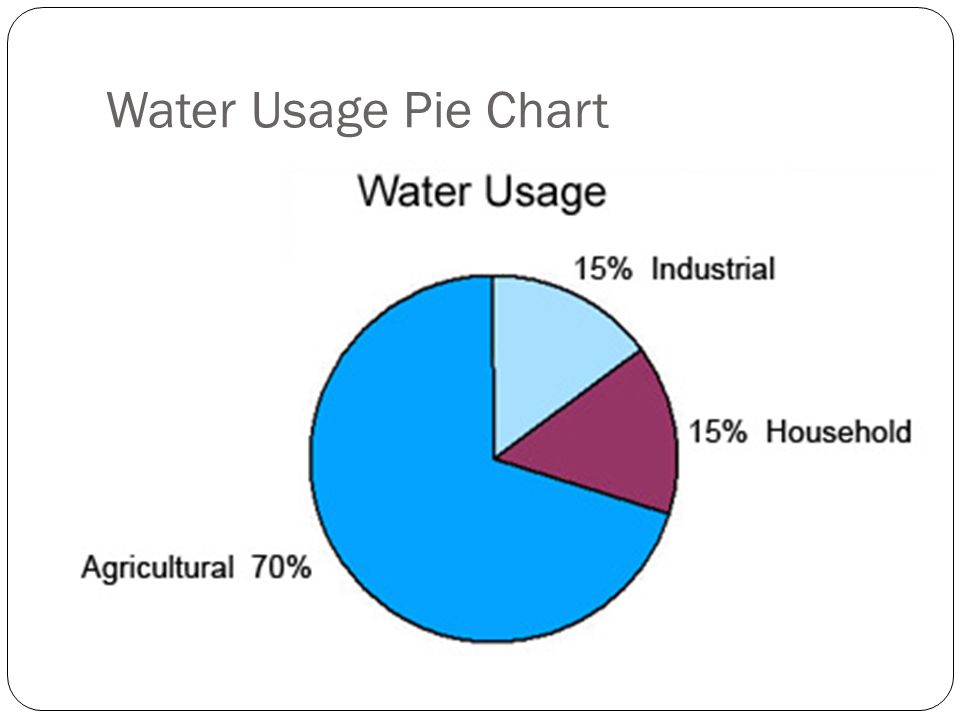 http://slideplayer.com/slide/6632427/