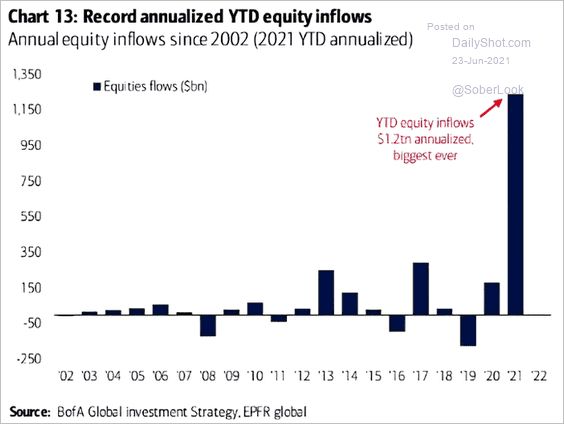
Topley’s Top 10 – June 24, 2021 June 24, 2021 Matt TopleyDaily Top Ten No Comments 1. Record Annualized Equity Flows Continue. Continue reading →
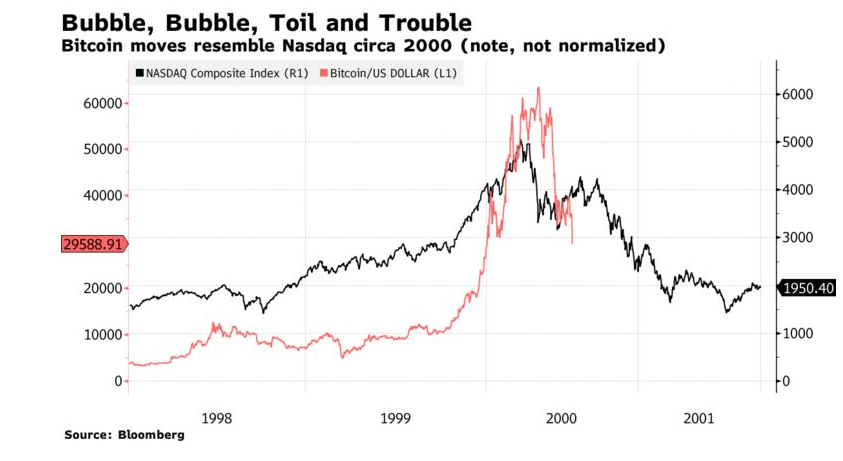
Topley’s Top 10 – June 23, 2021 June 23, 2021 Matt TopleyDaily Top Ten Quarterly No Comments 1. Bitcoin vs. Nasdaq 2000 Bubble Continue reading →
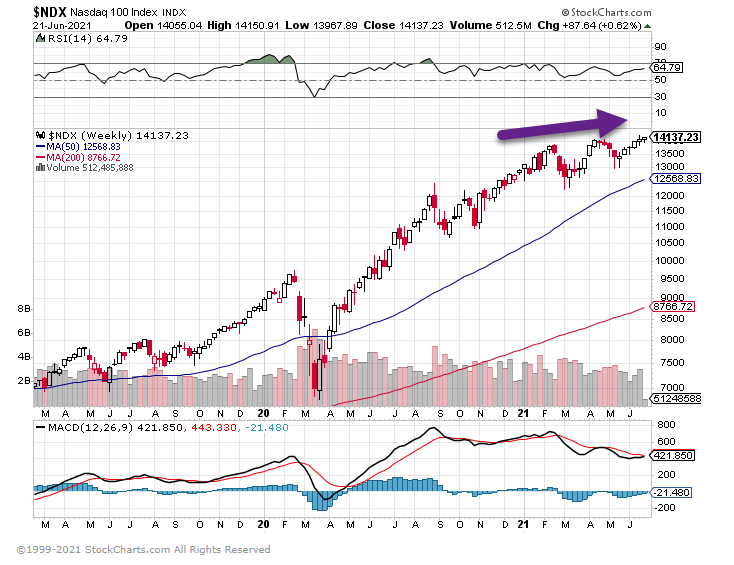
Topley’s Top 10 – June 22, 2021 June 22, 2021 Matt TopleyDaily Top Ten Quarterly No Comments 1. Nasdaq 100 Hit New Highs. Continue reading →
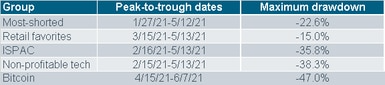
Topley’s Top 10 – July 21, 2021 June 21, 2021 Matt TopleyDaily Top Ten No Comments 1. Hot Areas of the Market Already Corrected 20-50% Market’s “Hot Pockets” Take Some Hits Continue reading →
Topley’s Top 10 – June 17, 2021 June 17, 2021 Matt TopleyDaily Top Ten Quarterly No Comments 1. FAANMG Premium Valuation vs. Tech Gone Snippet Finance FAANMG | Snippet Finance Continue reading →