1. Least Amount of Back to Back Down Days in 70 Years.
Irrelevant Investor-Michael Batnick
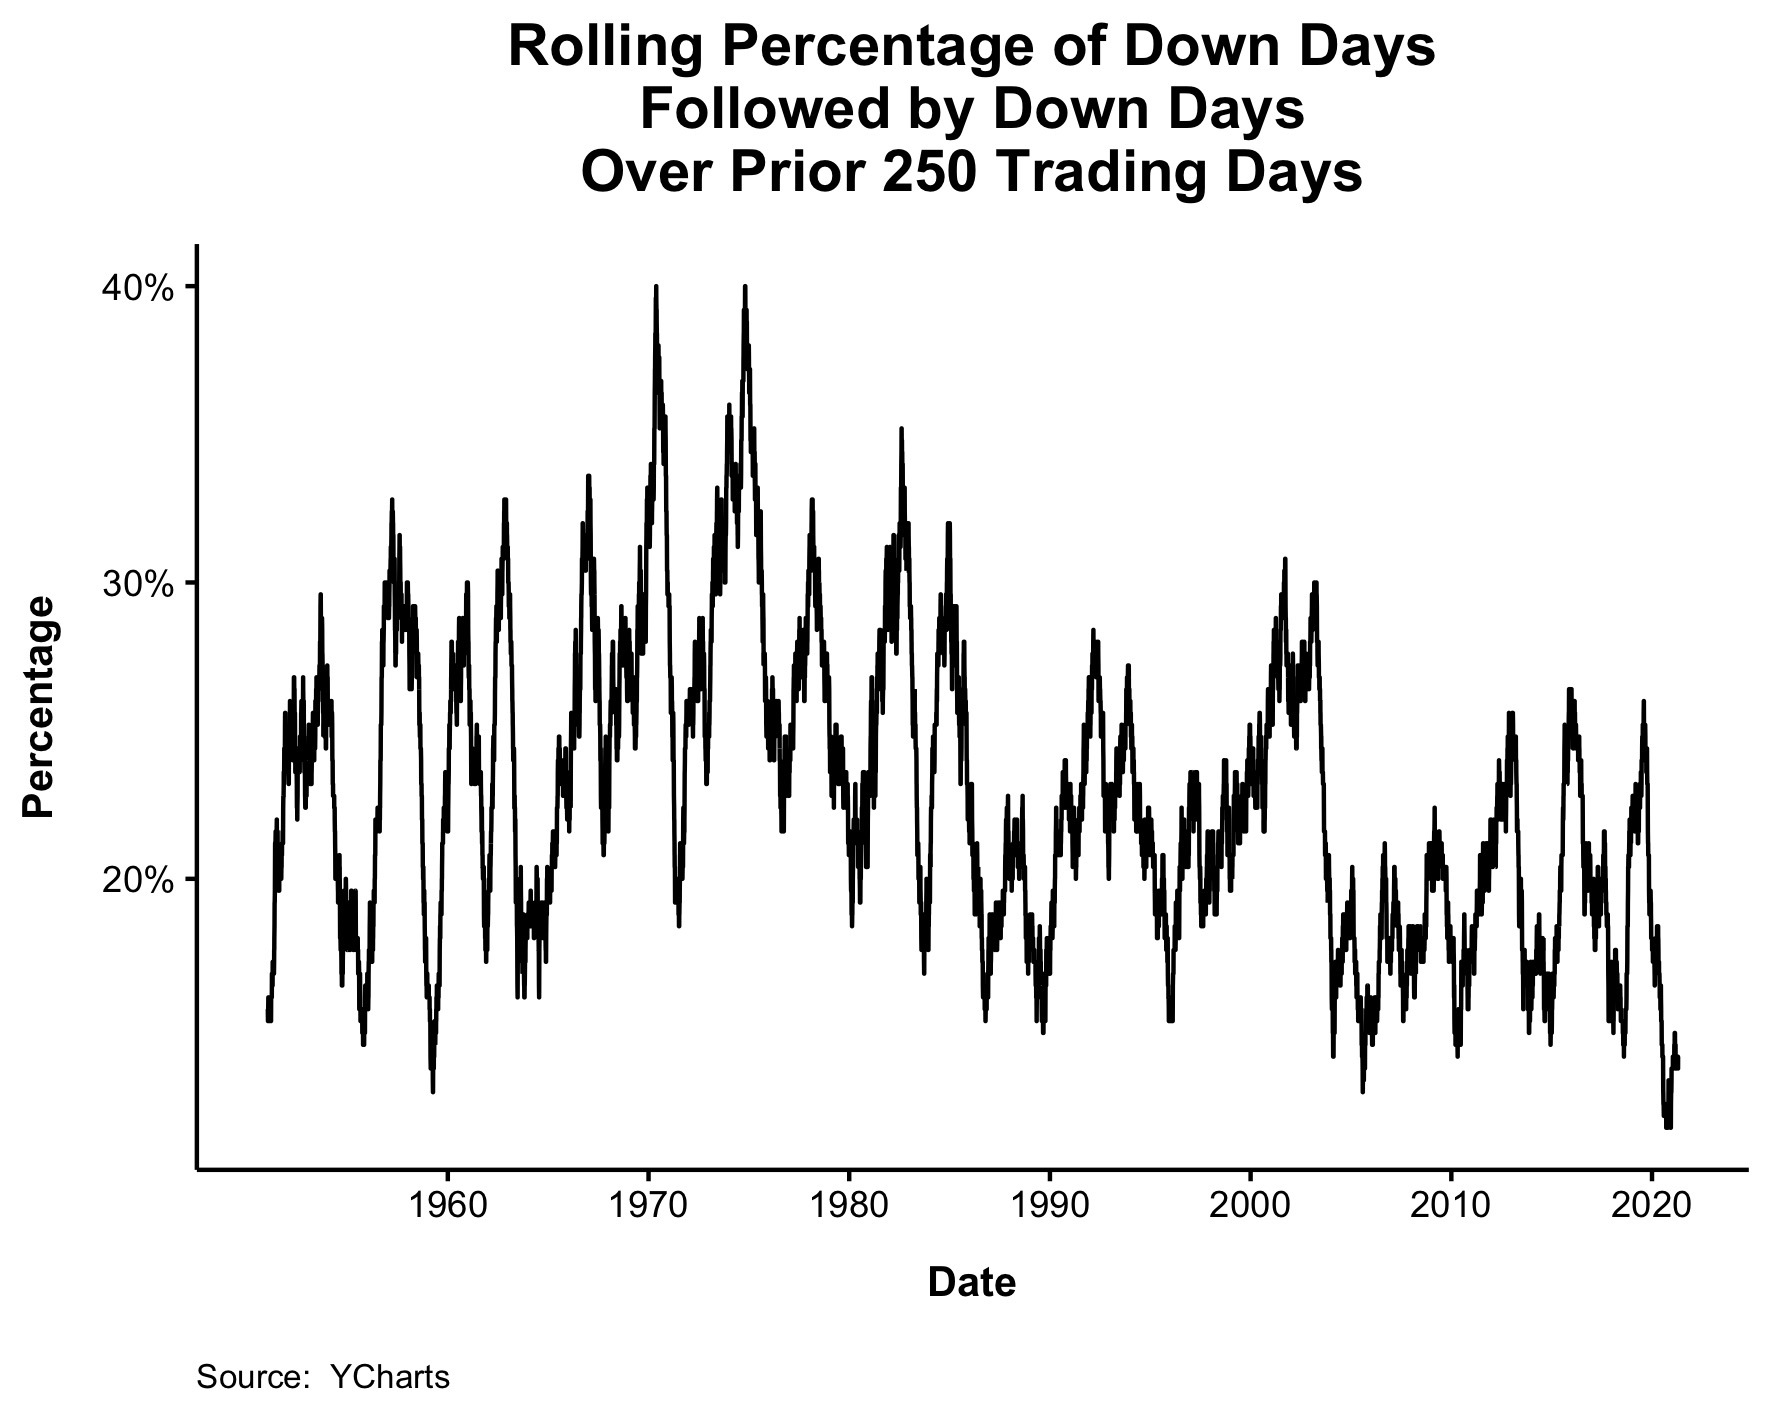
We just lived through a year with the least amount of back-to-back down days (going back to 1950).
Irrelevant Investor-Michael Batnick
We just lived through a year with the least amount of back-to-back down days (going back to 1950).
URA Chart—50day blue line thru 200day red line to upside….Bars show the increase in volume on rally.
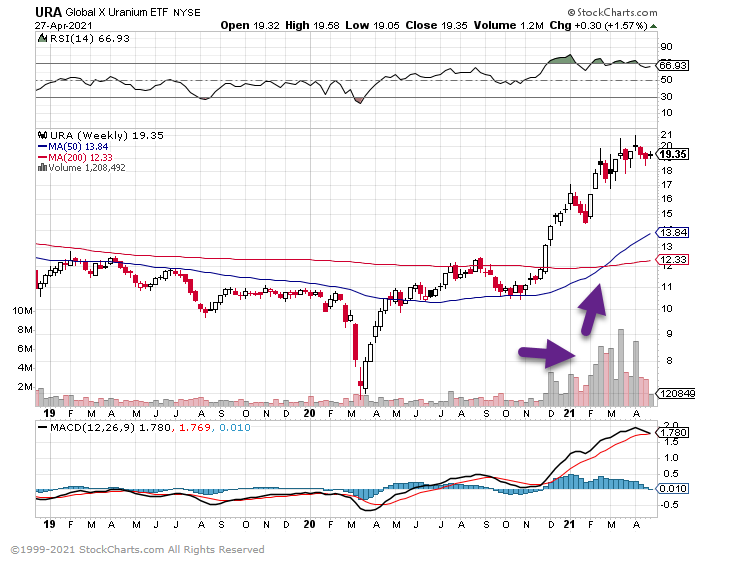
Exhibit A: the chart below showing the number of mentions of “inflation” during earnings calls which exploded, more than tripling YoY per company so far, the and the biggest jump in history since BofA started keeping records in 2004.

Virtually no relationship between changes in capital gains tax rate & S&P 500 returns in year of change … last time cap gains went up (in 2013), S&P 500 had stellar year (up 30%)