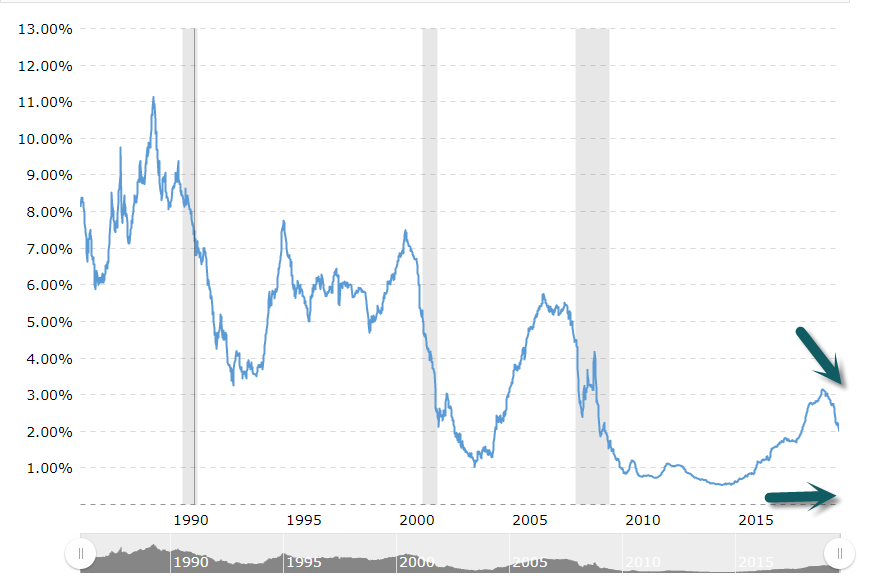
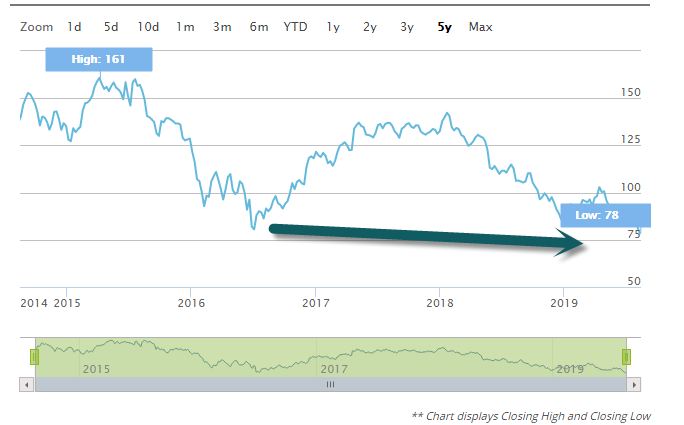
1.LIBOR-The Most Widely Used Global Benchmark for Short-Term Interest Rates….Rolling Over But Above Lows.
1 Year LIBOR Rate – Historical Chart
Interactive chart of
the 12 month LIBOR rate back to 1986. The London Interbank Offered Rate is the
average interest rate at which leading banks borrow funds from other banks in
the London market. LIBOR is the most widely used global “benchmark” or
reference rate for short term interest rates. The current 1 year LIBOR rate as
of August 09, 2019 is 1.99%.
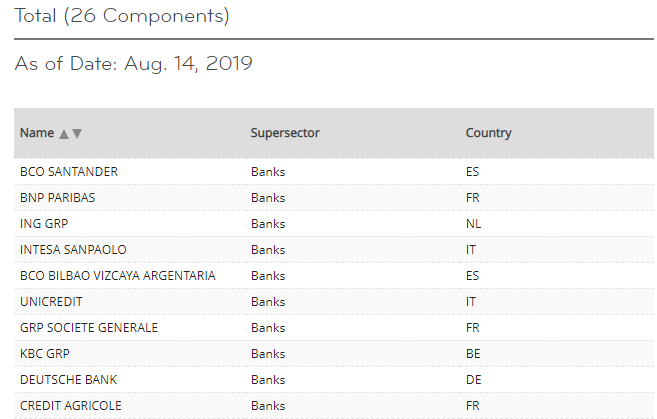
The STOXX Sector indices are available for global markets as
well as for Europe, the Eurozone and Eastern Europe. Using the market
standard ICB Industry Classification Benchmark, companies
are categorised according to their primary source of revenue. This
categorisation guarantees a professional and accurate classification of
companies in their respective business environments. There are four levels of
classification ranging from broad to very detailed: 10 industries are broken
down into 19 supersectors, 41 sectors and 114 subsectors.
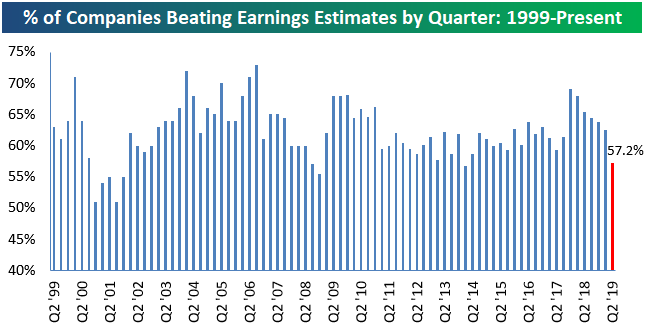
1.Bottom-Line
Earnings Beat Rates Down This Season
Mon, Aug 12, 2019
The unofficial Q2 earnings reporting period comes to an end on Thursday when Wal Mart (WMT) releases its numbers. More than 2,000 companies have reported earnings since the season began in early July, and 57.2% of them have beaten consensus analyst EPS estimates. As shown in the chart below, this quarter’s earnings beat rate is down significantly from recent quarters where 60%+ was pretty much a guarantee. If the current reading holds through Thursday, it will be the lowest beat rate since the Q1 2014 reporting period (April and May 2014).
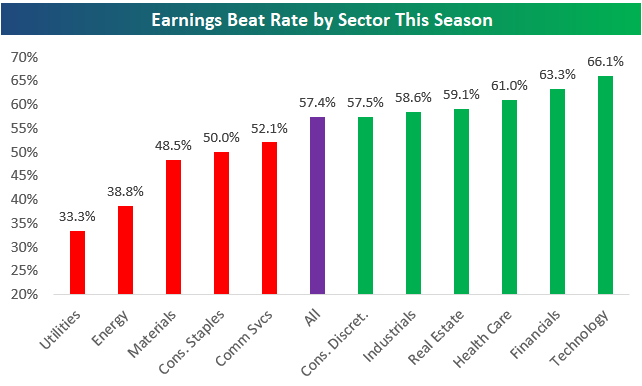
Below is a look at earnings beat rates by sector this season. Technology has the strongest beat rate at 66.1%, followed by Financials at 63.3%. Utilities and Energy have the weakest beat rates at 33.3% and 38.8%, respectively.
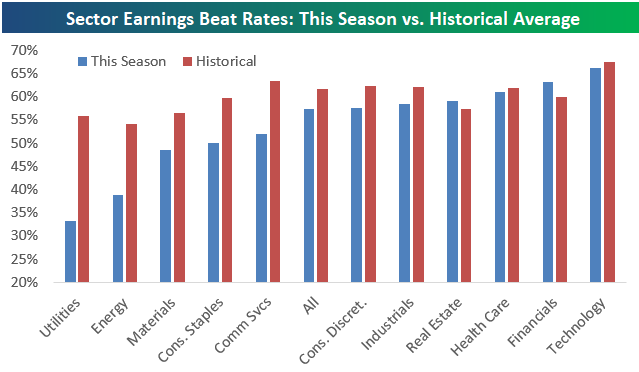
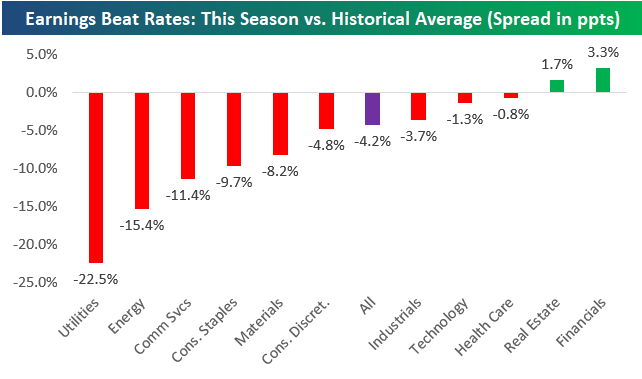
Below we show this season’s earnings beat rates by sector versus the sector’s historical earnings beat rate going back to 2001. All but two sectors have beat rates this season that are below their historical average. The Financial and Real Estate sectors are the only two that have seen stronger-than-normal beat rates. Start a two-week free trial to Bespoke Institutional to access our Trend Analyzer, Chart Scanner, Earnings Explorer and much more.
1. Microsoft, Apple, Amazon, Alphabet, and Facebook Make Up Half of Tech’s Market Cap.
In late 2018, shares of Silicon
Valley’s finest tanked some 16% in three months. Since then, Big Tech has been
busy climbing back near record highs. And, as The Economist points out,
listed tech firms now make up more than 25% of the value of U.S. stock
markets.
The last time tech was this
important was 2000, when the sector briefly made up one-third of the value of
all U.S.-listed equities. Back then, the concern was that tech firms were “too
flimsy” for their valuations. We all know how the dotcom bubble ended, but…
Today’s a different story—tech’s
big five (Microsoft, Apple, Amazon, Alphabet, and Facebook) account for 12% of
pre-tax profits among the U.S.’ non-finance firms, up from 4% in 2010.
Zoom out: Those big
five make up half the tech industry’s market value, meaning new worries
for the new millennium. Today, the concern is less
about financials and more about the idea that Big Tech has accumulated too much
power.

