1. September….Nasdaq 1% Move Everyday So Far.

2. Seasonal Volatility Just Getting Started
Bespoke -The market’s day-to-day volatility has picked up in September after experiencing more stable trading action during the summer months. This is not out of the ordinary. Historically, the most volatile time of the year for stocks has been between September and early November. You can see this in the chart below that shows the average absolute daily percentage change for each trading day of the year beginning on the first trading day of January through the last trading day of December. As shown, daily volatility is very consistent around the +/-0.70% level over the first eight months of the year, but then it starts to pick up beginning in September until it reaches a peak during the first week or two of November. From there, the holiday season takes over and daily volatility plummets right through the end of the year. As shown in the chart, unfortunately we’ve still got a ways to go to get to the top of the volatility mountain, so make sure you’ve got your climbing gear ready for the next six to eight weeks!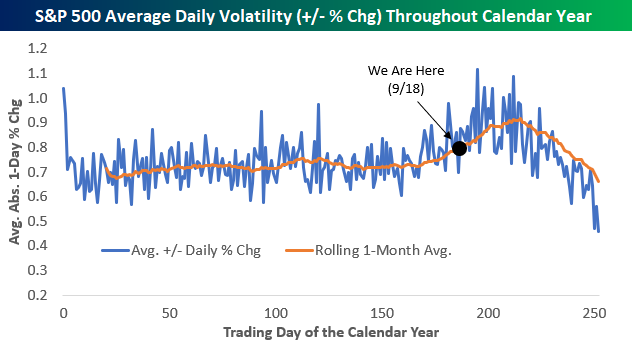
3. APPLE -17% This Month.
Apple’s stock closed below its 50-DMA on Thursday for the first time since April 21, then accelerated lower with a 3.2% drop on Friday to a seven-week low.
With the stock down 17.2% so far this month, it was on track for the biggest monthly decline since it tumbled 18.4% in November 2018.

FACTSET, MARKETWATCH
This chart signal says stop buying megacap technology stocks
4. FED, BOJ and ECB Balance Sheet Hits $21 Trillion.
Just to keep things into perspective: Combined balance sheet of Fed, BoJ and ECB has hit to fresh ATH at $21.3tn, equal to US GDP, meaning that paper money continues to be devalued, which may not be reflected in consumer prices, but in asset prices.

5. Gridlock or sweep? Equities have gone up either way
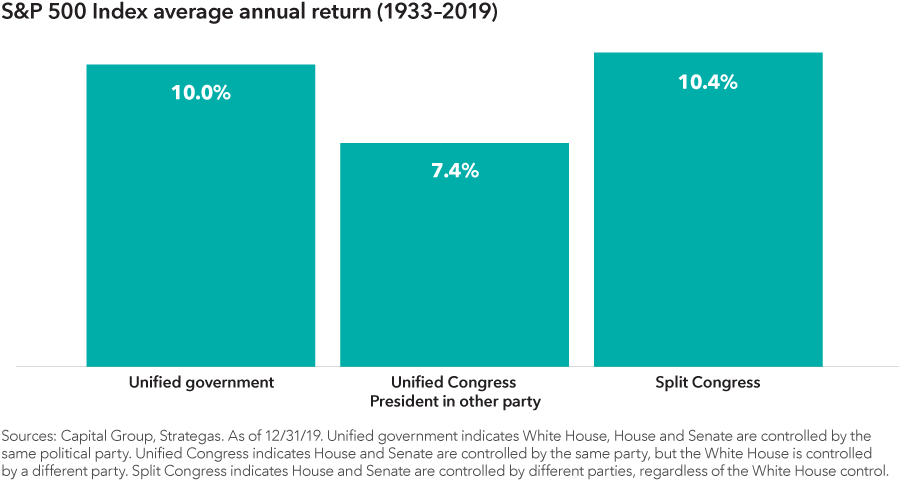
One of the biggest concerns investors have this election cycle is the possibility of a Democratic sweep of the White House and Congress. Many assume this so-called “blue wave” will lead to a reversal of policies like deregulation or the Tax Cuts and Jobs Act of 2017. While it’s true that a new party typically brings its own policy agenda, assuming such an outcome will lead to meaningfully lower stock prices is probably over-simplifying the complexities of stock markets.
History shows that stocks have done well regardless of the makeup of Washington. Since 1933, there have been 42 years where one party has controlled the White House and both chambers of Congress at the same time. During such periods, stocks have averaged double-digit returns. This is nearly identical to the average gains in years when Congress was split between the two parties. Historically the “least good” outcome has been when Congress is controlled by the opposite party of the president. But even this scenario notched a solid 7.4% average return.
What does this mean for 2020? This year’s election will almost certainly end in either a unified government under a blue wave or a split Congress, which could happen with either a Trump or Biden victory. Voters may have a strong preference, but investors should take comfort that both scenarios have historically produced strong equity returns.
https://www.capitalgroup.com/advisor/insights/articles/how-elections-move-markets-5-charts.html
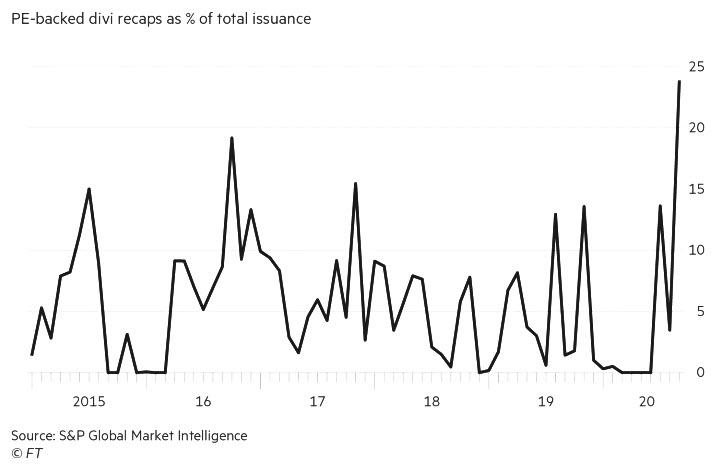
6. Record Numbers Of Companies Drown In Debt To Pay Dividends To Their Private Equity Owners

by Tyler Durden
One week ago we used Bloomberg data to report that in the latest Fed-fuelled bubble to sweep the market, now with Powell buying corporate bonds and ETFs, private equity firms were instructing their junk-rated portfolio companies to get even deeper in debt and issue secured loans, using the proceeds to pay dividends to owners: the same private equity companies. Specifically, we focused on five deals marketed at the start of the month to fund shareholder dividends, which accounting for half of the week’s volume, and the most in a week since 2017, according to Bloomberg.
Now, a little over a week late, the FT is also looking at these dividend recap deals which have become all the rage in the loan market in recent weeks, among other reasons because they are “ringing alarm bells since they come on top of already high leverage and weak investor protections and against a backdrop of economic uncertainty.”
Having updated our calculation, the FT finds that in September a quarter (24% to be exact) of all new money raised in the US loan market has been used to fund dividends to private equity owners, up from an average of less than 4% over the past two years: that would be the highest proportion since the beginning of 2015, according to S&P Global Market Intelligence.
https://www.zerohedge.com/markets/quarter-all-new-loan-issuance-going-pay-private-equity-dividends
7. Amazon Plans to Put 1,000 Warehouses in Neighborhoods
Spencer Soper 4 days ago
Amazon Plans to Put 1,000 Warehouses in Neighborhoods
(Bloomberg) — Amazon.com Inc. plans to open 1,000 small delivery hubs in cities and suburbs all over the U.S., according to people familiar with the plans. The facilities, which will eventually number about 1,500, will bring products closer to customers, making shopping online about as fast as a quick run to the store. It will also help the world’s largest e-commerce company take on a resurgent Walmart Inc.
Amazon couldn’t fulfill its two-day delivery pledge earlier this year when shoppers in Covid-19 lockdown flooded the company with more orders than it could handle. While delivery times have improved thanks to the hiring of 175,000 new workers, Amazon is now consumed with honoring a pre-pandemic pledge to get many products to Prime subscribers on the same day. So with the holidays approaching, Chief Executive Officer Jeff Bezos is doubling down by investing billions in proximity, putting warehouses and swarms of blue vans in neighborhoods long populated with car dealerships, fast-food joints, shopping malls and big-box stores.
Historically, Amazon gnawed away at brick-and-mortar rivals from warehouses on the exurban fringes, where it operated mostly out of sight and out of mind. That worked fine when the company was promising to get products to customers in two days. Now Walmart and Target Corp. are using their thousands of stores to beat Amazon at its own game by offering same-day delivery of online orders. Walmart also recently started is own Prime-style subscription service, upping the competitive ante.
A recently opened warehouse in Holyoke, Massachusetts, exemplifies Amazon’s answer to this existential challenge. Located not far from a once vibrant mall, it’s just a short drive from more than 600,000 people. The goal is to creep closer to almost everyone in the U.S.
Beyond Amazon’s retail rivals, the mass opening of small, quick-delivery warehouses poses a significant threat to United Parcel Service Inc. and the U.S. Postal Service. Being fastest in the online delivery race is so critical to Amazon’s business that it doesn’t trust the job to anyone else and is pulling back from these long-time delivery partners. Amazon is basically duplicating UPS’s logistics operation. Many of Amazon’s new hubs are within walking distance of UPS facilities.
“In just a few years, Amazon has built its own UPS,” says Marc Wulfraat, president of the logistics consulting firm MWPVL International Inc., who estimates Amazon will deliver 67% of its own packages this year and increase that to 85%. “Amazon keeps spreading itself around the country, and as it does, its reliance on UPS will go away.”
© Bloomberg Inside A United Parcel Service Inc. Consolidation Hub As Company Warns Of Temporary Delays
Amazon declined to comment on its expansion plans, and the company has said its last-mile delivery efforts are meant to supplement, not replace, its long-time partners. “Our dedicated last-mile delivery network just delivered its 10 billionth package since launching over five years ago, and we’re proud to provide a great service for our customers,” an Amazon spokeswoman said.
The company’s appetite for real estate is so strong that many analysts have speculated that Amazon would convert vacant department stores into distribution centers. In fact, that option is only a last resort, said the people privy to the company’s plans, who requested anonymity to discuss an internal matter.
Department stores such as J.C. Penney are often two stories and lack sufficient loading capacity, they said, meaning they require extensive remodeling to accommodate an Amazon delivery hub. Moreover, mall leases with existing tenants often prohibit the owner from introducing a delivery hub that could spoil the shopping experience, and city officials might not quickly approve an industrial use in a retail area. It’s more likely that dead malls will be bulldozed to make way for an Amazon warehouse, as they have in the Midwest, than for an Amazon delivery station to sprout in a half-vacant mall to coexist with Kay Jewelers and Cinnabon.
Still, analysts expect underutilized retail space to make way for more e-commerce delivery stations due to rising rents for industrial space, along with a surge in store vacancies. “Any time you see retail being occupied by non-traditional retail uses, they’re just holding off what’s inevitable,” says Rick Stein, principal at Urban Decision Group, who estimates the U.S. has 50% more retail real estate than it needs. “It’s a Band-Aid, and at some point that mall is coming down.”
In the past three years, 13.8 million square feet of retail space has been converted to 15.5 million square feet of industrial space, including vacant shopping malls razed to make room for new warehouses, according to a July report by the commercial real estate firm CBRE Group Inc. That trend will continue but not quickly enough for Amazon, which is building new facilities and moving into existing warehouses where it’s faster to get a hub up and running.
Amazon usually puts new delivery stations inside existing warehouses or signs long-term leases with development firms like ProLogis Inc. to build them to its exacting specifications. Typical delivery stations are about 200,000 square feet—about one-fourth the size of one of the company’s giant fulfillment centers—with large lots where workers can park their personal vehicles and Amazon can stage delivery vans. About 20 tractor-trailers arrive each night to drop off packages, which are loaded into hundreds of vans each morning before drivers fan out to make their rounds. In the afternoons, hundreds more Amazon Flex drivers, who use their own cars, arrive to deliver whatever’s left. A typical hub can generate more than 1,000 vehicle trips each day, often in areas where roads are already congested.
8. Top Metros for Net Inflows.
Top 10 Metros by Net Inflow of Users and Their Top Origins
| Rank | Metro* | Net Inflow (Q2 2020)† | Net Inflow (Q2 2019) | Portion of Searches from Users Outside the Metro (Q2 2020) | Portion of Searches from Users Outside the Metro (Q2 2019) | Top Origin | Top Out-of-State Origin | Median Sale Price (June 2020) |
| 1 | Phoenix, AZ | 9,428 | 8,232 | 35.1% | 33.8% | Los Angeles, CA | Los Angeles, CA | $310,000 |
| 2 | Sacramento, CA | 8,935 | 6,860 | 46.6% | 42.6% | San Francisco, CA | Reno, NV | $445,000 |
| 3 | Las Vegas, NV | 7,136 | 5,687 | 46.6% | 44.4% | Los Angeles, CA | Los Angeles, CA | $309,000 |
| 4 | Austin, TX | 6,770 | 5,403 | 35.6% | 32.8% | San Francisco, CA | San Francisco, CA | $341,795 |
| 5 | Atlanta, GA | 6,680 | 6,157 | 26.4% | 26.7% | New York, NY | New York, NY | $269,900 |
| 6 | Dallas, TX | 5,605 | 4,101 | 27.6% | 23.9% | Los Angeles, CA | Los Angeles, CA | $315,000 |
| 7 | Tampa, FL | 4,955 | 4,178 | 57.4% | 56.4% | Orlando, FL | New York, NY | $259,000 |
| 8 | Miami, FL | 4,279 | 3,938 | 27.3% | 25.7% | New York, NY | New York, NY | $340,500 |
| 9 | Nashville, TN | 3,616 | 2,321 | 35.4% | 29.1% | New York, NY | New York, NY | $320,000 |
| 10 | Charlotte, NC | 3,380 | 2,912 | 39.7% | 40.0% | New York, NY | New York, NY | $289,945 |
*Combined statistical areas with at least 500 users in Q2 2020
†Negative values indicate a net outflow; among the one million users sampled for this analysis only
New York, San Francisco, Los Angeles, Washington, DC and Chicago are the top five places with the biggest net outflows in the second quarter. Expensive coastal cities typically see the most out-migration.
https://www.redfin.com/blog/q2-2020-housing-migration-trends/
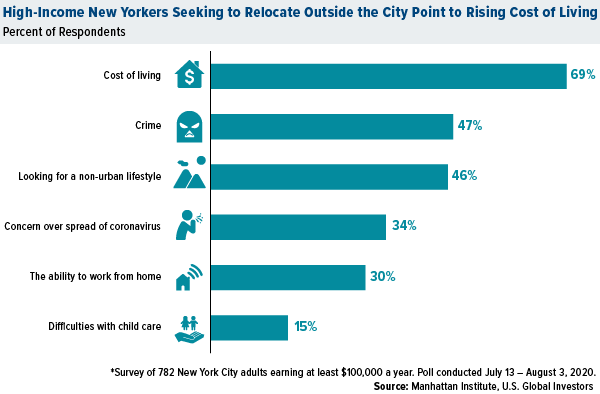
9. Cost of Living and Crime Primary Reason for Relocations.
Violence and crime are top of mind among many people looking to move out of cities. The free-market think tank Manhattan Institute found that nearly half of high-income New Yorkers who were seeking to relocate cited crime as a contributing factor. At 47 percent, that was the number two reason for moving, number one being cost of living (69 percent).
The number of empty Manhattan apartments rose to a record 15,025 in August, up more than 166 percent from the same month in 2019, according to the Elliman Report. This brought the borough’s vacancy rate up to 5.1 percent, the highest in the report’s 14-year history. Movers in New York City are reportedly so busy right now, they’re having to turn people away.
Respondents to the Manhattan Institute’s survey aren’t overreacting over crime. Gun-related homicides across the U.S. are on track to be the worst since 1999. This past July was Chicago’s deadliest month in 28 years.
The Urban-to-Suburban Exodus May Be the Biggest in 50 Years
by Frank Holmes of U.S. Global Investors, 9/18/20
10. Eight Questions to Ask and Answer Before Saying Yes to a Good Idea
It sounds counterintuitive to kill off good ideas, but chase too many of these darned things and you will find your business moving nowhere quickly. In the article “If You’re the Boss, Start Killing More Good Ideas,” it credits Steve Jobs with the following theme at a management conference at Yahoo: “Jobs advised them that killing bad ideas isn’t that hard. He insisted that what is really hard—and a hallmark of great companies, is killing good ideas. For any single good idea to succeed, it needs a lot of resources, time and attention.”
You should repeat that last phrase daily.
When consulting with a major retailer a few years ago, one of the most visible signs of the culture was a frenetic energy around moving ideas off of the whiteboard and into formal projects.
It was widely understood that the best way to catch the eyes of senior management was to either lead and gain approval for a project, or to find a way to attach yourself to the big ideas and expansive project teams of the firm’s fast-trackers.
Ideas were everywhere. Projects multiplied like rabbits. It was chaos.
The result of this idea-fueled project culture run amok was a classic case of too many projects chasing too few resources. There were dozens of great ideas being pursued by project teams, yet few finished and even fewer made a difference to the firm’s results.
At the height of the firm’s success in the market, the internal engine charged with refreshing, renewing, and sustaining success creaked and groaned and eventually failed, opening the doors for some much more focused and disruptive competition.
The word “no” is one of the most powerful management tools in your toolkit. It is also one that is under-utilized.
“Don’t say maybe if you want to say no.” – Paulo Coelho
Here are 8 questions for you and your team to ask and answer before saying “Yes” to yet another interesting idea:
1. Does the idea support our core strategy?
If not, kill it. If your strategy is not clear and it is not providing a mechanism for filtering ideas, solve this problem first. In the absence of a clear strategy, all ideas seem viable.
2. Is there a customer experiencing significant and visible pain that this idea resolves?
If you are focusing on benefits only, beware. Be careful attempting to justify a new initiative because of all of the perceived benefits it delivers. At the end of the day, burden relief typically outsells benefits.
3. Is the idea a “me-too” initiative in direct response to a competitor?
If yes, work harder to find a way to differentiate your offering or firm from your competitor. Playing “follow the competitor” is typically a formula that guarantees you will lose.
“You have to change the set, stay ahead of the curve.” – Carson Daly
4. Are your current customers screaming for this feature?
Remember Henry Ford‘s famous advice: “If we had asked our customers what they wanted, they would have said faster horses.” Customers are notoriously poor at articulating their true needs. Before blindly working to meet their needs for a particular feature, spend time observing your customers and strive to understand the underlying issues or challenges leading to the request. Chances are, there’s a genuine need lurking somewhere under the surface request.
5. Will a customer have to change his/her operating processes to adopt this idea?
While this alone is not an idea killer, beware of banking on ideas that require clients to quickly change behaviors. That almost never happens.
6. How will we evaluate whether this idea is successful or unsuccessful?
Or, for longer range initiatives, how will we measure progress and know that the idea is on track to contribute? Establishing the criteria for success or failure helps identify whether something may just be an interesting experiment versus an initiative that quickly contributes to revenue and profits.
7. What is our time horizon for this idea?
Well-managed firms treat ideas and projects like a portfolio of stocks. Some are intended to deliver results immediately and others require patience and nurturing. Beware of overloading the short-term portion of your portfolio and underfunding the longer-range initiatives.
8. How will our team members respond to this initiative being added to their “To Do” lists?
Audible groans from the people responsible for the work is an indicator of potential overload. Be careful!
The Bottom-Line for Now
In our fast-changing world, we are bombarded with the need to be agile and adaptable. The risk in all of this adaptability and agility is that we rationalize taking on too many ideas at any one time, starving all of them for the much needed care and feeding. You most definitely want a culture that generates a lot of ideas. You also want to create a culture that optimizes the odds of your best ideas becoming successful in the market. Learning to say “No” is a critical part of success.
How do you determine whether you say ‘yes’ or ‘no’ to someone when you only have a certain amount of hours in the day? Share your advice with everyone below!
Disclosure
Lansing Street Advisors is a registered investment adviser with the State of Pennsylvania..
To the extent that content includes references to securities, those references do not constitute an offer or solicitation to buy, sell or hold such security as information is provided for educational purposes only. Articles should not be considered investment advice and the information contain within should not be relied upon in assessing whether or not to invest in any securities or asset classes mentioned. Articles have been prepared without regard to the individual financial circumstances and objectives of persons who receive it. Securities discussed may not be suitable for all investors. Please keep in mind that a company’s past financial performance, including the performance of its share price, does not guarantee future results.
Material compiled by Lansing Street Advisors is based on publicly available data at the time of compilation. Lansing Street Advisors makes no warranties or representation of any kind relating to the accuracy, completeness or timeliness of the data and shall not have liability for any damages of any kind relating to the use such data.
Material for market review represents an assessment of the market environment at a specific point in time and is not intended to be a forecast of future events, or a guarantee of future results.
Indices that may be included herein are unmanaged indices and one cannot directly invest in an index. Index returns do not reflect the impact of any management fees, transaction costs or expenses. The index information included herein is for illustrative purposes only.