1. How Current Returns Stack Up to History
Thu, Oct 1, 2020
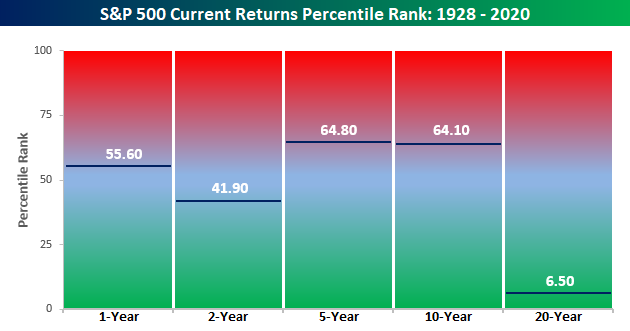
Even after September’s weakness, the S&P 500’s trailing 12-month total return stood at an impressive 14.9%. Given the events of the last 12 months, one could even say that performance is remarkable. What’s even crazier is that the S&P 500’s performance over the last 12 months is more than three times stronger than the 12 month period before that (+4.25%). The chart below compares the S&P 500’s annualized total returns over the last one, two, five, ten, and twenty years and compares that performance to the historical average return of the index over those same time periods.
The S&P 500’s historical average 12-month return is 11.7%, so the current 14.9% gain exceeds that average by more than three full percentage points. Over a two-year window, though, the S&P 500’s annualized return of 9.4% is more than a full percentage point below the historical average. Looking further out, the S&P 500’s trailing five and ten-year annualized return has been much stronger than average, which makes sense given the long bull market we were in. Over a 20 year window, though, the S&P 500 is only just starting to work off some of the declines from the dot-com bust and as a result, the 6.4% annualized gain is four and a half percentage points below the long-term average of 10.9%.
Below we show how the current performance of the S&P 500 in each of the time frames shown compares to all other periods on a percentile basis. The S&P 500’s performance over the last year ranks just below the 56th percentile of all other periods, while the two-year performance ranks just below the 42nd percentile. Even as the five and ten-year periods have seen well above average returns, they still rank in just the mid-60s on a percentile basis. The S&P 500’s ranking over a 20-year time period is a completely different story ranking in single-digits on a percentile basis. Even with the equity market right near record highs, the last two decades have been forgettable for US equities. Click here to view Bespoke’s premium membership options for our best research available.
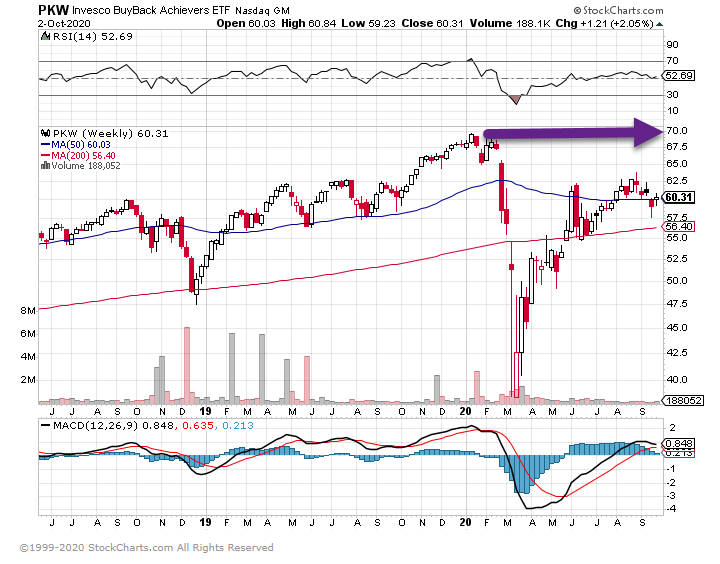
2. Another Bull Market Chart That Has Not Made New Highs….PKW—Buyback ETF
3. Negative Real Interest Rates…..But Record Bond Inflows
Chart of the Day

2020 is the year of the bond ETF.
Found at Abnormal Returns Blog. www.abnormalreturns.com
4. 30 Year Bond Duration is the Highest in History…..The effective duration of a 30-year Treasury is about 21 years,
If interest rates rose 1%…30 Year Treasury would drop -21%Historical yields on the 30-year U.S. Treasury have included the following:
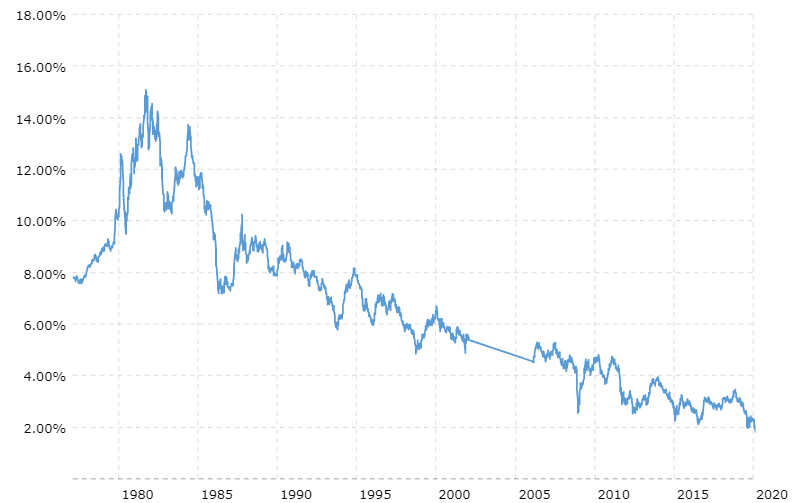
Historical 30-Year Treasury Yields.
Source: MacroTrends
https://www.investopedia.com/terms/l/longbond.asp
5. Without Dividends German Market Since 2000 Would Be Negative
Good Morning from Germany where dividends matter & artificially dope benchmark index Dax. Without dividends, German stocks’ return since 2000 high would be negative. While Dax has gained 60% since then, Dax Price Index, which like S&P500 does not incl dividends, has dropped 11.1%

6. Housing Affordability Has Rarely Been Better
We start with housing affordability, which has rarely been higher on lower mortgage rates and growing wages:

https://www.zerohedge.com/commodities/visualizing-us-housing-frenzy-34-charts
7. Big 4 Bank Stocks Market Cap Back to 2004 Levels
The Big Four bank stocks.
JPMorgan Chase [JPM] is down 32% ytd. At $96.27 today, it’s back where it first was in October 2017. Having about doubled since the peak before the Financial Crisis, it’s the least-dirty shirt of the batch.
Bank of America [BAC] is down 33% ytd. At $24.09, shares are down 56% from the peak before the Financial Crisis, and are back where they’d first been in December 1996, well, 24 years ago.
Wells Fargo [WFC] is down 56% ytd. At $23.53, shares are down 61% from December 2017 and are back where they’d first been in October 2000.
Citigroup [C] is down 46% ytd. At $43.11, shares – adjusted for its infamous 1-for-10 reverse stock split in March 2011 – are back where they’d first been in 1993.
My Big Four Bank Index, based on market capitalization, closed today at $685 billion (yup, $60 billion below Facebook’s market cap). That’s down 46% from its peak ($1,258 billion) on January 26, 2018. You see, banks got hit two years before the Pandemic. And the index is now back where it had first been on December 28, 2004, nearly 16 years ago (data from YCharts):
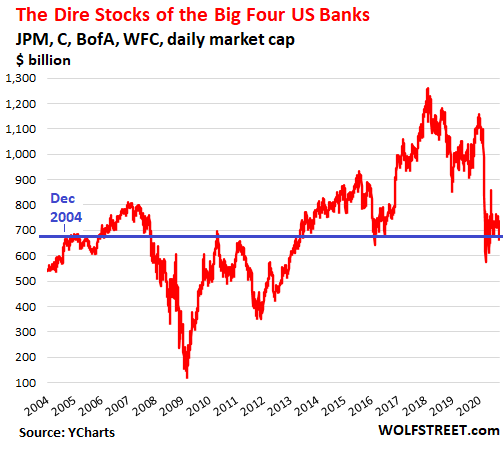
My Big-Four Bank Index already got crushed back to 2004 level.
By Wolf Richter for WOLF STREET.
8. 53% of NYC Tax Revenue Generated From Real Estate

REBNY: Real Estate Generates More Than 50% of NYC Tax Revenues
New York City’s real estate industry generated $31.9 billion in taxes over the last fiscal year, representing 53% of the city’s tax revenue, according to an analysis by the Real Estate Board of New York, which is holding its 124th Annual Banquet Thursday evening. The industry’s share of revenues is more than twice as large as the next closest contributor: personal income tax, with a 21% share.
The $31.9 billion comes from commercial and rental apartment buildings. It doesn’t include one-and-two family homes, cooperatives and condominiums or schools, hospitals and other publicly-funded structures.
“This report demonstrates the importance of real estate related tax revenue to our thriving city,” said REBNY president James Whelan. “If we want a progressive city, then we need a prosperous city. These findings underscore that policies that limit the amount of tax revenue generated by our industry are counterproductive to improving the lives of New Yorkers they aim to help.”
9. The staggering numbers that prove just how far Bryson DeChambeau is hitting the golf ball these days
Bryson DeChambeau hits his tee shot on the 16th hole during the Rocket Mortgage Classic golf tournament at Detroit Golf Club. Brian David Gordon·
Bryson DeChambeau‘s radical transformation of his body and game has been one of the most polarizing issues of the summer. Just how crazy has DeChambeau been off the tee? Consider that over the five PGA Tour events since the three-month coronavirus shutdown, DeChambeau has hit 29 drives at least 350 yards, by far the most of any player. In fact, it’s more than the next two players combined. That is nearly the same number of drives of at least 350 yards as he had all of last season (30).
Most 350-Yard Drives Since PGA Tour Restart
| PLAYER | NUMBER OF DRIVES LONGER THAN 350 YARDS |
| Bryson DeChambeau | 29 |
| Matthew Wolff | 15 |
| Cameron Champ | 12 |
DeChambeau was not always this long off the tee. He’s averaging 323 yards per drive this season, up over 20 yards (+20.5) from 302.5. He is on pace to be the first player since 2005 to increase his driving distance by 20 yards over one season. The next-largest increase belongs to Tiger Woods, who increased his driving distance by 14.2 yards from 2004 to 2005.
Largest Year-Over-Year Increase In Driving Distance Last 15 Years
| YEAR | PLAYER | DISTANCE INCREASE IN YARDS |
| 2019-20 | Bryson DeChambeau | +20.5 |
| 2005 | Tiger Woods | +14.2 |
| 2017-18 | Graeme McDowell | +13.7 |
The massive distance has left DeChambeau just 149.2 yards to the hole on average for his approach shots this season. That is on pace to pass Bubba Watson (149.8 in 2014-15 season) for the shortest distance in a single season since 2005.
Shortest Average Distance To Hole After Tee Shot In Single Season Since 2005
| YEAR | PLAYER | DISTANCE TO HOLE AFTER TEE SHOT |
| 2014-15 | Bubba Watson | 149.8 |
| 2012 | Bubba Watson | 152.2 |
| 2011 | J.B. Holmes | 152.7 |
| 2016-17 | Rory McIlroy | 152.9 |
| * DeChambeau currently at 149.2 this season |
Another way to look at it: DeChambeau’s drives have covered more than 67% of the courses’ yardage this season. That’s (again) on pace to pass Bubba Watson’s mark from back in 2014-15.
Highest Percentage Of Yardage Covered By Tee Shots Single Season Since 2005
| YEAR | PLAYER | PERCENTAGE OF DISTANCE COVERED BY TEE SHOT |
| 2014-15 | Bubba Watson | 67.28 |
| 2016-17 | Rory McIlroy | 67.26 |
| 2012 | Bubba Watson | 67.05 |
| * DeChambeau currently at 67.43 |
As for head-to-head comparisons with Woods, DeChambeau is already on his way to doing something Tiger never did — lead the PGA Tour in driving distance. Woods finished second in driving distance in four different seasons, but he never led the field. However, relative to his peers, Woods’ peak driving distance season (2005) was slightly better when comparing distances to the PGA Tour average. In 2005, Tiger was 27.7 yards longer off the tee than the average player; DeChambeau is currently 27.1 yards longer than the PGA Tour average thus far this season.
10. Preventing Busyness from Becoming Burnout
The Busyness Paradox, Explained
Here’s how the busyness paradox works: When we’re busy and have that high-octane, panicked feeling that time is scarce — what one participant called the “sustained moment of hecticness” through the work day — our attention and ability to focus narrows. Behavioral researchers call this phenomenon “tunneling.” And, like being in a tunnel, we’re only able to concentrate on the most immediate, and often low value, tasks right in front of us. (Research has found we actually lose about 13 IQ points in this state.) We run around putting out fires all day, racing to meetings, ploughing through emails, and getting to 5 or 6 PM with the sick realization that we haven’t even started our most important work of the day.
So we stay late at the office, or take work home in the evenings or weekends, and effectively steal time for work away from the rest of our lives. “If you’re in this firefighting state of time pressure and tunneling, you’re not making time to meet long-term goals. You’re not dealing with any of the root causes that led to the firefighting in the first place,” said Matthew Darling, ideas42 vice president and project lead. “The tendency is to do the stuff that’s easy to check off. That’s all you have the bandwidth for.” Tunneling and busyness are mutually reinforcing, Darling added. “Focusing on short-term tasks makes you not make strategic plans, which causes you to be busy.”
In theory, workers could just ignore any work they didn’t complete before, say, 5 PM, and call it a day. But it’s hard to break out of the tunnel now: Unlike a century ago, when Americans showed their status in leisure time, busyness has become the new badge of honor. So even as we bemoan workplaces where everyone is busy and no one is productive, busyness has actually become the way to signal dedication to the job and leadership potential. One reason for this is is that, while productivity is relatively easy to measure on a factory floor, or on the farm, we have yet to develop good metrics for measuring the productivity of knowledge workers. So we largely rely on hours worked and face time in the office as markers for effort, and with the advent of technology and the ability to work remotely, being connected and responsive at all hours is the new face time. “Tunneling” is no longer something that happens by accident,” Darling explained. “It’s a condition that workers are forced into by standard management practices.”
So how can behavioral science interventions begin to nudge this powerful busyness bias that keeps us all so stressed out?
One key will be to construct new mental modelsof the ideal worker. Right now, the model is someone who comes in early, eats lunch at their desk, stays late, emails at all hours, is always busy and always available to put work first — a definition that excludes anyone with caregiving responsibilities (which, in the U.S., is primarily women) or the desire for a healthy work-life balance.
So the interventions ideas42 are designing to improve work effectiveness and work-life balance may also wind up nudging the idea that an ideal worker in the 21st century is someone who does great work, is well-rested and healthy, and has a great life outside of work — not someone who’s trapped in the busy tunnel, chasing their tail, thinking small and on the road to burn out. These interventions are designed with the very foundation of behavioral science in mind: that human decision-making is shaped not by individual personality or willpower, but by the environment.
3 Ways to Break Your Employees Out of the Busyness Paradox
Recognize the power of social signals. When we’re at work, all we see are other people working. And when we see late-night emails or texts, we assume that our coworker or boss has been working all day or night without interruption, when perhaps they’d been out walking the dog or having dinner with their families. But that life outside work doesn’t register because we don’t see it. (More, we often don’t want to share our lives outside work with coworkers and bosses in order to preserve the busyness myth that we are always working.)
“You end up miscalibrating,” Darling explained, or thinking that people are working more than they actually are, so you automatically think you have to as well in order to keep up. Researchers point to a classic study of such “norm misperception” and how prevalent and damaging it can be: one nationwide surveyfound that a large share of college students overestimated the amount of alcohol their peers consumed. Over time, the best predictor for how much students wound up drinking was how much they thought their peers were drinking, even though, in reality, their peers weren’t drinking that much.
To correct that “always-on” misperception, researchers at ideas42 are testing the idea of making non-work time more visible. They’re asking managers to be more open about: taking lunch breaks, leaving the office on time, working flexibly, going on vacation, talking about life outside of work or care responsibilities, and more demonstrably encouraging others to do the same — potentially even including life events on shared calendars. Another experiment involves automatic reminders. These reminders would go out at the beginning of every year and would prompt people to schedule their vacations.
Researchers are also working with teams to design email, phone, and texting protocols to cut down or eliminate work communication outside of normal hours, particularly from leaders who set expectations for everyone else. Behavior might be tracked and made transparent so that, through the powerful nudge of social comparison, people and leaders would be held accountable and the new systems more likely to stick.
Build in slack for important work. Humans are terrible at estimating how much time and effort are actually needed to accomplish things. It’s called the planning fallacy, and the busyness paradox only exacerbates that tendency to underestimate and overpromise. So one intervention being tested is for workers to intentionally create slack in their calendars every week — in other words, intentionally schedule a block of slack time to finish up any work that got delayed after an emergency popped up, or to finish a project that took longer than you thought it would. The team at ideas42 came up with the idea based on a study of hospital operating rooms that found leaving one room unused for emergencies, rather than booking to 100% capacity, actually increased the number of surgical cases and revenue while cutting down on staff overwork
Another idea is to create “transition days” at work before and after vacations, where the only expectation of workers would be to wrap up work before leaving, and catch up on what they missed while they were out. That would give workers a better chance of truly unplugging and recharging during vacation, and help people ease back into work after. People won’t feel as compelled to answer emails throughout for fear of falling behind, or dread juggling the awaiting inbox with immediate work demands. “You almost always need a lot more slack than you think you will,” Darling explained, “and it is actually markedly important for doing good work.”
Slack time requires a new mental model — recognizing that, no matter how carefully we plan, work emergencies and unexpected demands will always crop up and projects and tasks will usually require more time than we’ve allocated. So creating blank space isn’t slacking off (pun intended); it’s time that enables you to get your most important work done effectively and keeping it from spilling over into the rest of your life.
Increase transparency into everyone’s workload. Many people participating in our project felt they were always busy — going to meetings, answering emails, collaborating with others — but not necessarily productive. They found it difficult to find chunks of uninterrupted time to concentrate on a big project, much less plan or think or strategize. Some even said they used their paid time off just to have a day of uninterrupted, independent work.
So one intervention ideas42 researchers are experimenting with is an effort to “concretize” work by actually scheduling in time to work on the week’s priorities and making actual workloads transparent to bosses and coworkers. The thinking is that that transparency is likely to create positive friction every time someone wants to call a meeting. With priority work made more transparent, calling a meeting won’t be seen as cost free, but a values trade-off: what is everyone not doing because they’re at this meeting? And is the meeting the better use of everyone’s time?
Another idea involves “meeting hygiene” — can meetings become more efficient with a required agenda, limited time, and concrete action plan? Researchers may also test meeting and email black out days to encourage concentrated work time.
In the end, the hope is that these interventions will help people begin to act their way into a new way of thinking. If they see they can work more effectively andhave a healthier work-life balance, perhaps instead of praising people who brag about being super busy and working all the time, they’ll begin to think: If workers aren’t getting their most important work done, are on the verge of burnout, and have little time for life, what needs to change at this organization?
Brigid Schulte is a journalist, author of the New York Times bestselling Overwhelmed: Work, Love and Play When No One has the Time and director of the Better Life Lab at New America.
Disclosure
Lansing Street Advisors is a registered investment adviser with the State of Pennsylvania..
To the extent that content includes references to securities, those references do not constitute an offer or solicitation to buy, sell or hold such security as information is provided for educational purposes only. Articles should not be considered investment advice and the information contain within should not be relied upon in assessing whether or not to invest in any securities or asset classes mentioned. Articles have been prepared without regard to the individual financial circumstances and objectives of persons who receive it. Securities discussed may not be suitable for all investors. Please keep in mind that a company’s past financial performance, including the performance of its share price, does not guarantee future results.
Material compiled by Lansing Street Advisors is based on publicly available data at the time of compilation. Lansing Street Advisors makes no warranties or representation of any kind relating to the accuracy, completeness or timeliness of the data and shall not have liability for any damages of any kind relating to the use such data.
Material for market review represents an assessment of the market environment at a specific point in time and is not intended to be a forecast of future events, or a guarantee of future results.
Indices that may be included herein are unmanaged indices and one cannot directly invest in an index. Index returns do not reflect the impact of any management fees, transaction costs or expenses. The index information included herein is for illustrative purposes only.