1. What history says tends to happen after the U.S. stock market logs ugly September losses–
Marketwatch
September proved to be a bruising month for the main U.S. equity benchmarks, resulting in the first losing month for Wall Street since a recovery rally began in late March.
However, history suggests that a terrible September, which is historically the worst performing month of the year for U.S. stocks, could be followed by the indexes outperforming despite October usually ranking as the second-worst month of the year.
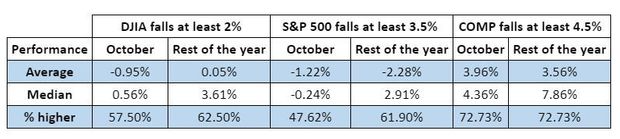
In fact, the indexes tend to rise in the following month 70% of the time after losses as severe as September this year, based on the last 10 periods in which the Dow marked a decline of at least 2%, the S&P 500 marked a September slide of at least 3.5%, and the Nasdaq Composite logged a drop in the ninth month of the year of at least 4.5%.
Overall, however, on a percentage basis, the S&P 500 and the Dow have tended to fall on average in October. An important point to note, is that the relatively short data set is skewed to the low side by the punishing declines endured by the market in 2008, when the Dow lost 14.1% in October of 2008, the S&P 500 dropped nearly 17% that month, and the Nasdaq Composite tumbled almost 18%.
Those declines during the financial crisis dragged the overall 2008 performance for the Dow lower, leaving an average loss for the month of October of about 1% and a relatively flat rest of the year at 0.05%. Meanwhile, the S&P 500 has declines of 1.2% and declines of 2.3% for the rest of the year. However, the Nasdaq Composite tends to gain nearly 4% in the October trading period on average and notch a 3.6% advance in the year to date (see attached chart).
What history says tends to happen after the U.S. stock market logs ugly September losses–By Mark DeCambre
2. Number of Stocks Up at Least 400% YTD…Near 1999 Levels.
Chart of the Day
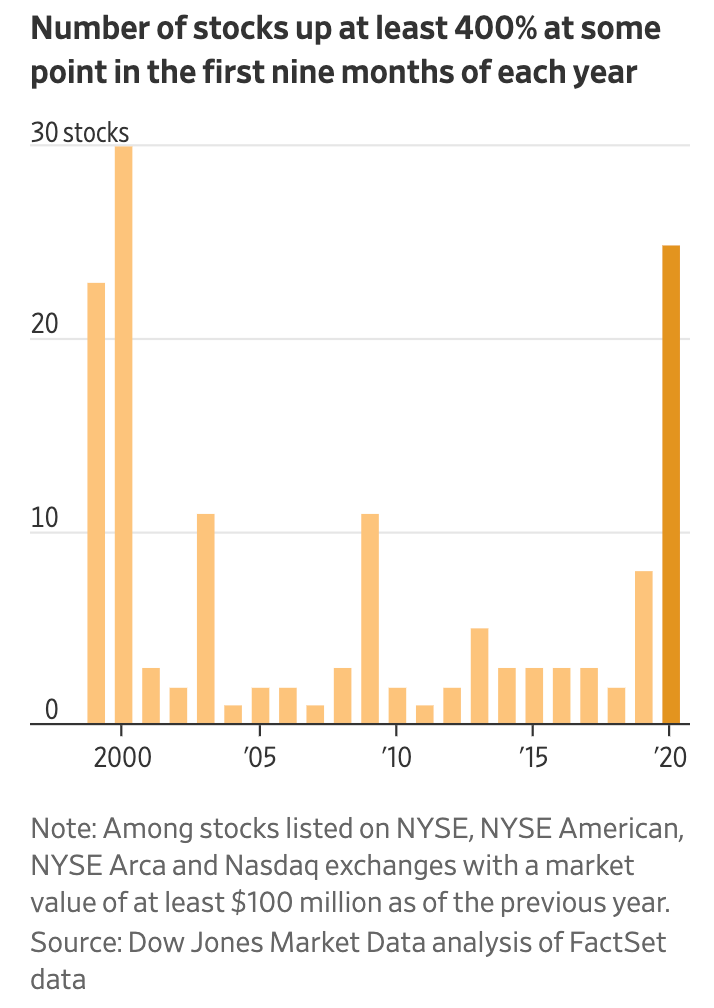
2020 has seen an unusual number of stocks up at least 400% at some point.
Found at Abnormal Returns Blog www.abnormalreturns.com
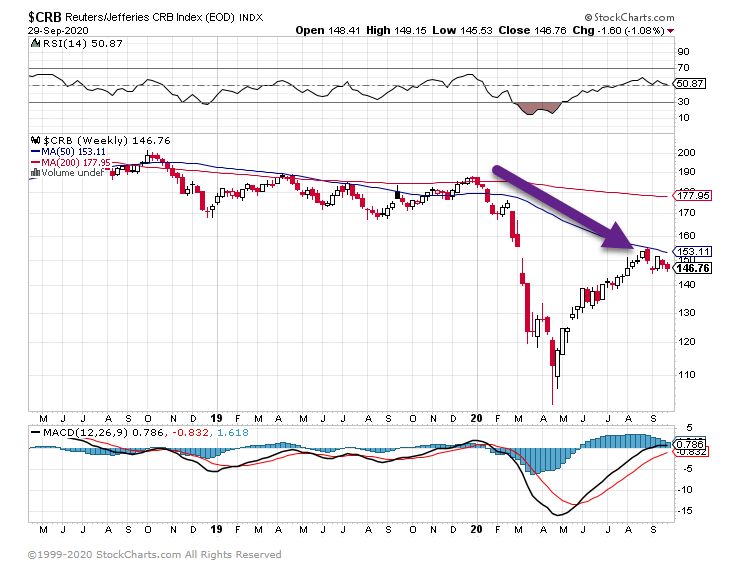
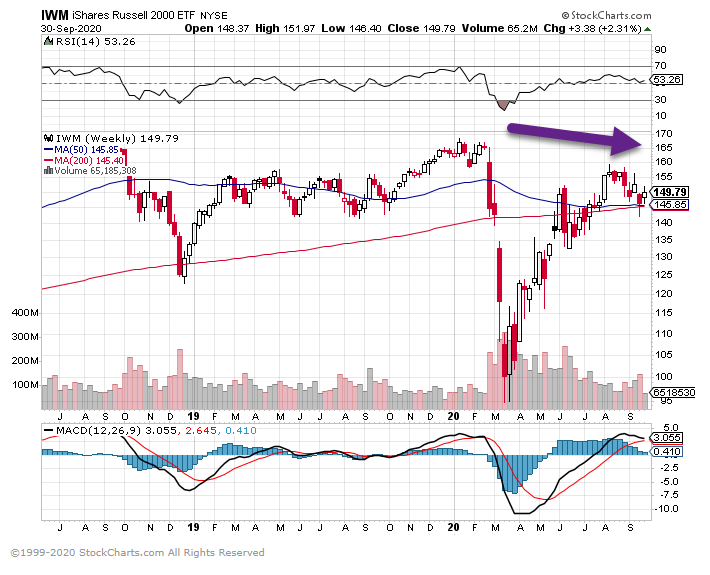
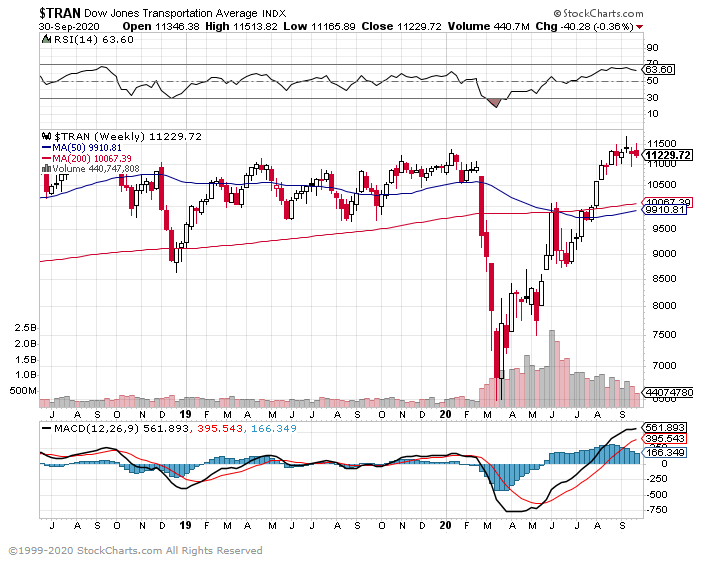
3. Indices That Have Failed to Make New Highs.
Commodity Index
Small Cap Russell 2000 Index
Transports-11,650 is previous high
4. Investors Become Conservative in Election Years.
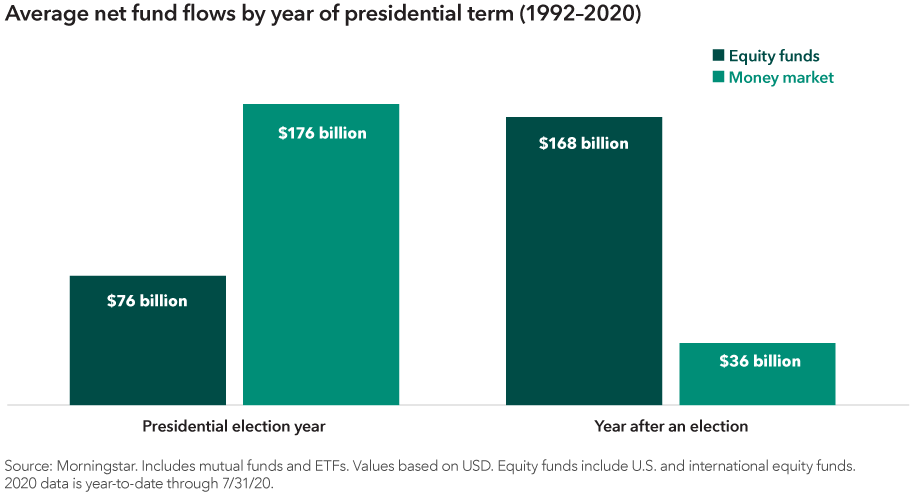
https://www.capitalgroup.com/advisor/insights/articles/how-elections-move-markets-5-charts.html
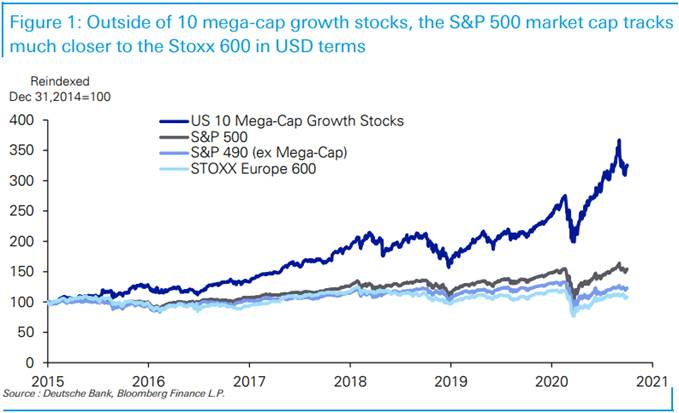
5. Ex-10 Stocks S&P Looks Like Europe Index
Welcome to October. September saw the recent stock rally come to an end, but overall Q3 followed Q2 in seeing a strong bounce-back in equities. See our monthly/Q3/YTD performance review here for more.
In Q3 we’ve marvelled at how the S&P 500 (+8.9% in Q3) has again outstripped the European Stoxx 600 (+0.7%), extending a trend that has been there for the best part of a decade.
However on closer inspection the S&P “490” – an index where we’ve stripped out the 10 mega-cap growth stocks has performed much more in-line with Europe over the last 6 months, especially if you adjust for the EUR/USD move and has only had a relatively small advantage over the Stoxx 600 since the end of 2014 where our chart (also currency adjusted) starts.
So we all know how much having a large growing tech sector has benefited the US equity market massively but it’s fascinating to see that excluding just 10 of these names in the S&P 500 means that US equity performance has been more in line with Europe’s over recent years.
Our Head of Asset Allocation, Binky Chadha, and his team, looked at the recent underperformance in these mega-cap growth stocks at the start of this week and also at the current equity pricing in terms of election uncertainty (link here).
Jim Reid Deutsche Bank
6. Institutions Are Loaded Up on Cash….Institutional investors, high-net worth investors and S&P 500 companies are all loaded up on cash.
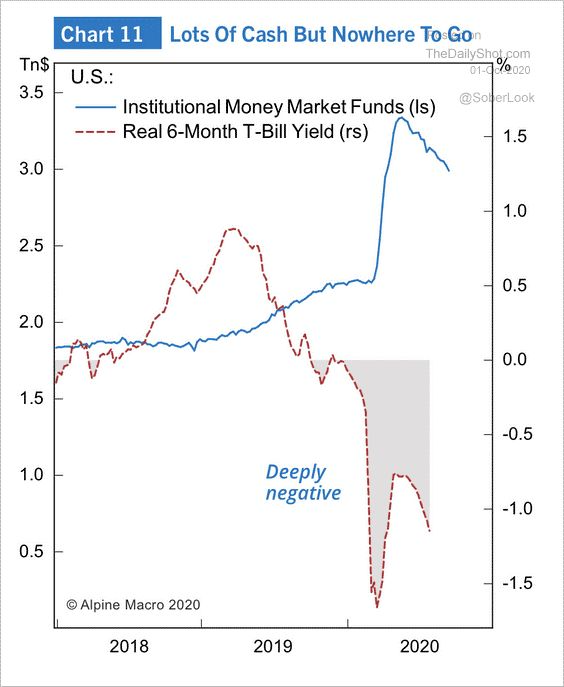
Nicholas Lampone • 1stPrincipal & Director of Trading at Dalzell Trading1h • 1 hour ago
Institutional investors have a large pile of cash to put to work? Are they waiting for a presidential winner before plowing into equities? Chart courtesy of Alpine Macro and The Daily Shot.
https://www.linkedin.com/in/nicholas-lampone-9277986/
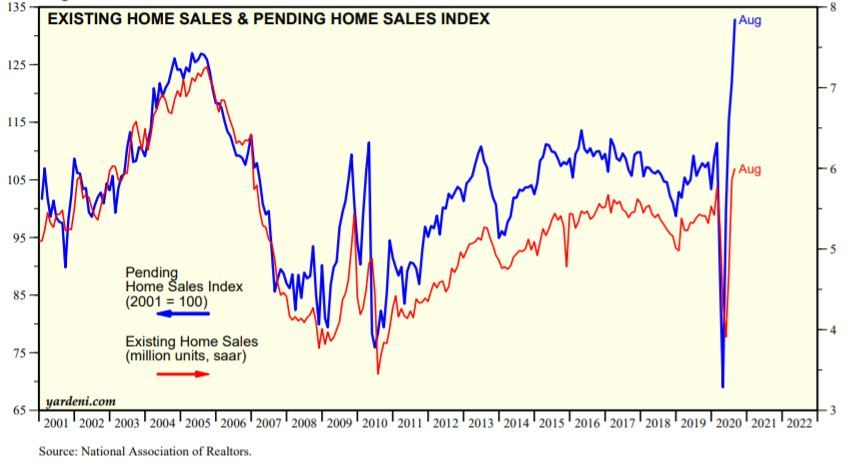
7. Pending Home Sale Index Jumped From Record Low 69 in April to Record High 133 in August
Sales are likely to remain strong since the Pending Home Sales Index compiled by the National Association of Realtors (NAR) jumped from a record low of 69 during April to a record 133 during August. Existing home sales are counted when they are closed rather than when they go to contract.
ED Yardeni
https://www.linkedin.com/in/edward-yardeni/
8. House report: U.S. intelligence agencies have failed to adapt to China threat
Xi Jinping and other Chinese politicians and delegates listen to the national anthem duirng the closing of the 19th Communist Party Congress in 2017. Photo: Lintao Zhang/Getty Images
The House Intelligence Committee on Wednesday released a report finding that the U.S. intelligence community has failed to adapt to the growing threat from China, arguing that it will struggle to compete on the global stage for decades to come if it does not implement major changes.
The big picture: The 200-page report, based on thousands of analytic assessments and hundreds of hours of interviews with intelligence officers, determined that the intelligence community’s focus on counterterrorism after 9/11 allowed China “to transform itself into a nation potentially capable of supplanting the United States as the leading power in the world.”
Key findings:
- The Western consensus that China would choose to liberalize as its economy developed was “deeply misplaced,” the report concludes, with the belief that democratic systems were “globally inevitable” causing policymakers to be blind to the Chinese Communist Party’s “overriding objective of retaining and growing its power.”
- The committee expects China’s use of “digital authoritarianism” to surveil and indoctrinate its citizens to continue to be exported abroad — “potentially degrading longstanding international norms concerning the rights of the individual, and the very idea of liberal and free societies.”
- The CCP’s efforts to suppress information and “warp the record” of its own actions in the early days of the COVID-19 outbreak provide important insights for understanding Beijing’s “vast propaganda apparatus,” and should have “profound effects on how the United States should track and evaluate events occurring within China.”
- China’s aggressive military expansion and dreams of becoming a “science and technology world superpower” could create “entirely new domains of conflict,” extending the battlefield to “our political discourse, mobile devices, and the very infrastructure that modern digital communication and communities rely upon.”
What they’re saying: “The stakes are enormous. We must do everything possible to accurately predict and characterize Beijing’s intent, or we will continue to struggle to understand how and why the leadership of the CCP makes decisions, and fail to respond effectively,” House Intelligence Chairman Adam Schiff (D-Calif.) said in a statement.
Read an unclassified summary of the report.
9. Game Changing’ 15-Minute Covid-19 Test Cleared in Europe
By Emma Court
U.S. company plans to begin selling test at the end of October
Rapid antigen test to be sold in countries that accept CE mark
Becton Dickinson and Co.’s Covid-19 test that returns results in 15 minutes has been cleared for use in countries that accept Europe’s CE marking, the diagnostics maker said Wednesday.
The test is part of a new class of quicker screening tools named for the identifying proteins called antigens they detect on the surface of SARS-CoV-2. Becton Dickinson expects to begin selling the test, which runs on the company’s cellphone-sized BD Veritor Plus System, in European markets at the end of October. It will likely be used by emergency departments, general practitioners and pediatricians.
“It is really a game-changing introduction here in Europe,” said Fernand Goldblat, BD’s head of diagnostics for Europe. Europe was really at the epicenter of the pandemic in April and May, “and unfortunately I think we’re headed back in that direction. So the need will be extremely high,” he said.
Antigen tests have emerged as a valuable tool because they produce results much more quickly than gold-standard PCR diagnostic assays. However, they are generally less accurate. In the U.S., for instance, instructions for BD’s system recommend that negative results be confirmed by a molecular testing method.
Becton Dickinson said its antigen assay is 93.5% sensitive, a measure of how often it correctly identifies infections, and 99.3% specific, the rate of correct negative tests. The data, which differ from the U.S. label’s 84% sensitivity and 100% specificity, come from a new clinical study that was recently submitted to the U.S. Food and Drug Administration, spokesman Troy Kirkpatrick said.
Rapid antigen testing has been making inroads in Europe as well as the U.S. Roche Holding AG said this month it would launch its own 15-minute antigen test to European markets accepting the CE mark. Another test developer, LumiraDx, received CE marking for its antigen test late last month. It said it planned to manufacture 2 million tests in September and as many as 10 million in December.
Becton Dickinson’s Veritor system has been used largely to screen for flu in Europe to date, but the new assay could help drive wider antigen testing adoption, including for influenza and other respiratory viruses, said Goldblat.
The company is currently having conversations in multiple European countries, largely with governments and health authorities, about “where and how our solutions would fit,” he said.
The test is already available in the U.S. Becton Dickinson said it is on track to produce about 8 million each month by October across its global markets, and 12 million monthly by March 2021.
Goldblat declined to comment on how those tests would be allocated in Europe and the U.S., except that “a good portion” would be coming to Europe. Pricing will depend on commitments made and the reimbursement environment in a given country, among other factors, he said.
In the U.S., where regulators cleared the assay in July, the Veritor Plus System has an average selling price of $250 to $300, and the tests themselves are about $20 each.
10. 5 WAYS INCOMPETENT LEADERS DIS-EMPOWER GOOD PEOPLE
Don’t expect bold performance from dis-empowered people.
You drain, discourage, and demotivate, if your goal is conformity.

An egotistical need for control – in those with positional authority – dis-empowers others. In reality, incompetent leaders are afraid of empowered people.
5 negative results of dis-empowerment:
- Frustration. Anger permeates life when people feel powerless.
- Blame. Powerless people use “they” more than “I”.
- Paranoia. People believe you’re out to get them when you make them feel powerless.
- Anxiety. Incompetent leaders use anxiety as motivation.
- Helpless. Incompetent leaders make people feel they have no voice.
5 ways incompetent leaders dis-empower good people:
- Exclude, don’t include. Keep decision-making processes narrow and small. Elitism makes you feel powerful and others feel like outsiders.
- Make people feel they don’t matter. Minimize or ignore experience, expertise, and talent on the team. After all, you know and understand more than anyone else.
- Keep blabbing.
- Isolate yourself.
- Stay at arm’s length.
- Don’t physically touch people.
- Act busy. We all know busy and important are the same thing.
- Never walk around the office.
- Avoid front-line people at all costs.
- Treat people like ignorant tools. Create policies without collaborating with them.
Powerful isn’t egotistically making everyone conform to your wishes.
Real power gives power.
5 ways skillful leaders expand power in teammates:
- Set limitations that keep teammates focused on what matters. Feeling powerful is about doing meaningful work.
- Create four viable options with others, but delegate final decisions to others. Choice feels like control. Control is power.
- Have candid conversations before making decisions.
- Seek and give feedback on behaviors and results.
- How are you doing?
- How am I doing?
- How are we doing?
- Reject the need to be liked. Embrace thee need to have influence and impact. Leaders who need to be liked cause instability by making exceptions.
Powerful people look for a way forward, not a way out.
How do leaders dis-empower others?
How might leaders make others feel powerful?
Disclosure
Lansing Street Advisors is a registered investment adviser with the State of Pennsylvania..
To the extent that content includes references to securities, those references do not constitute an offer or solicitation to buy, sell or hold such security as information is provided for educational purposes only. Articles should not be considered investment advice and the information contain within should not be relied upon in assessing whether or not to invest in any securities or asset classes mentioned. Articles have been prepared without regard to the individual financial circumstances and objectives of persons who receive it. Securities discussed may not be suitable for all investors. Please keep in mind that a company’s past financial performance, including the performance of its share price, does not guarantee future results.
Material compiled by Lansing Street Advisors is based on publicly available data at the time of compilation. Lansing Street Advisors makes no warranties or representation of any kind relating to the accuracy, completeness or timeliness of the data and shall not have liability for any damages of any kind relating to the use such data.
Material for market review represents an assessment of the market environment at a specific point in time and is not intended to be a forecast of future events, or a guarantee of future results.
Indices that may be included herein are unmanaged indices and one cannot directly invest in an index. Index returns do not reflect the impact of any management fees, transaction costs or expenses. The index information included herein is for illustrative purposes only.