1. Fund Flows Still Favor Bonds Over Stocks.

Fund Flows Favor Bonds Over Stocks, but Returns May Not Follow
Posted by lplresearch After pulling back in the first quarter of 2020, flows into bond mutual funds and exchange-traded funds (ETFs) dominated stocks in the second quarter. As shown in the LPL Chart of the Day, the second quarter is consistent with recent history, as bond flows have topped stock flows in 15 of 18 quarters going back to the start of 2016. “While there may be some natural explanations for bond flows, there is also concern that bond enthusiasm has moved toward an extreme after a multi-decade bull run,” said LPL Chief Market Strategist Ryan Detrick.
https://lplresearch.com/2020/07/14/fund-flows-favor-bonds-over-stocks-but-returns-may-not-follow/
2. Another Way of Looking at Growth vs. Value….Outperformance Surpasses 1999 on Percentage Basis.
American Funds

-Greetings from 2030: Growth investing for the next decade=Anne-Marie Peterson is an equity portfolio manager with 24 years of experience. She also covers U.S. retail as an investment analyst. She earned a bachelor’s in economics from the University of California, Irvine, and is a CFA charterholder.
https://www.capitalgroup.com/advisor/insights/articles/growth-investing-next-decade.html
3. 74% of Fund Managers Thing Tech Trade “Most Crowded”…..Highest in Survey History.
The chart–BofA’s July Global Fund Manager shows that investors have gone all in on U.S. tech stocks. Some 74% of those surveyed think that is the most “crowded trade,” the highest reading in the survey’s history. Here is that chart:

This strategist says investors are in the ‘forest of make believe’ when it comes to growth stocks
4. New Home Applications Hit Record –XHB Homebuilder ETF Breaks Out
XHB -Homebuilder ETF

New-Home Applications Hit a Record in June
Feverpitched/Dreamstime.com
It isn’t just existing homes flying off the lots. In another positive sign for demand through the summer home buying season, the volume of mortgage applications to purchase a new home in June soared 54.1% compared with the same month in 2019, according to the Mortgage Bankers Association’s June Builder Application Survey.
On a year over year basis, that increase is the highest in the eight-year history of the monthly index, which measures buyers’ interest in purchasing a new home by tracking the application volume from home builders’ mortgage subsidiaries, according to the MBA.
The survey is the latest sign that the coronavirus’s shock to the housing market postponed a historic spring home buying season instead of canceling it entirely. New-home applications this June rose 20% from May levels, an anomaly compared with previous years when the survey registered decreasing or flat volume in June compared with May.
New Homes WantedApplications to purchase a new home rose sharply in June, which is typically whenhome buying levels off.Source: Mortgage Bankers AssocationNote: Builder Application Survey Market Index, not seasonally adjusted
2020201920172018Jan.JuneDec.01002003002017xAprilx174.82
“The new home purchase market continues to recover,” said Joel Kan, MBA’s associate vice president of economic and industry forecasting, in a press release. “MBA estimates that new home sales in June increased 15 percent to a seasonally adjusted pace of 774,000 units – which would be the strongest level of activity since January 2020.”
Yet Another Sign of a Housing Recovery: New-Home Applications Hit a Record in June
5. Work from Home ETF—WFH.

https://seekingalpha.com/symbol/WFH

6. Capital Markets Revenue Hit Highest Levels Since 2015
This chart from S&P shows capital markets revenue at larger investment banks already surging above $40 billion in the first quarter, the highest level in five years.

Capital markets fees are key
The credit-rating firm also charted how JPMorgan and Citigroup have lead their peers in capital markets revenue in most years since 2010

Major banks are hauling in ‘big fees’ from debt and equity underwriting during the coronavirus crisis
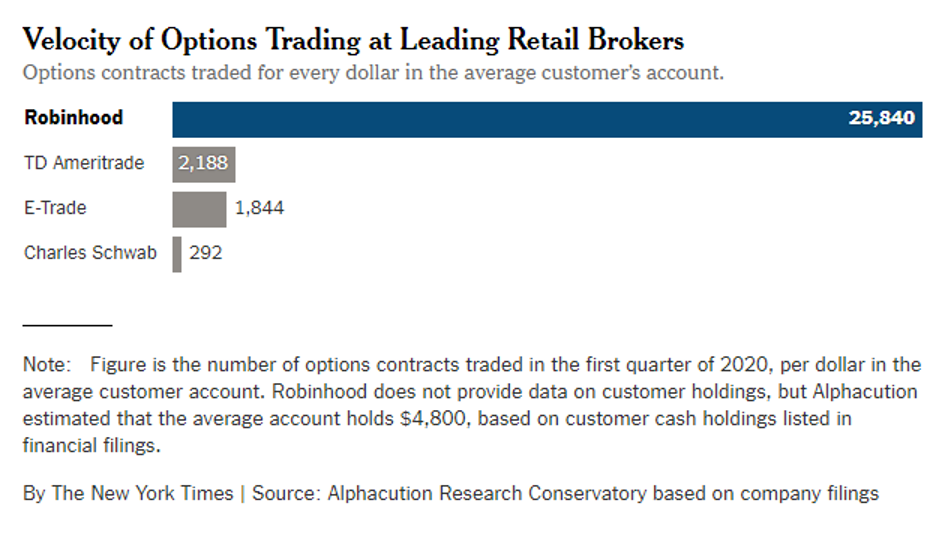
7. Everyone is Commenting on Stocks Being Traded on Robinhood…..Here are the Top ETFs for The New Day Traders.
Robinhood’s Favorite ETFs
On June 4, we pulled Robinhood’s top 20 most popular ETFs, listed in the table below, and were able to identify a few investment trends of our own:
Sources: Robintrack, ETF.com; data as of June 4, 2020
Robinhood Traders Love A Good Story
https://www.etf.com/sections/features-and-news/robinhoods-favorite-etfs?nopaging=1
8. Robinhood “Revolutionized Brokerage Industry” LOL
“Robinhood has made the financial markets accessible to the masses and, in turn, revolutionized the decades-old brokerage industry,” Andrew Reed, a partner at Sequoia, said after last month’s fund-raising.
LOL LOL LOL Total Comedy…..”Revolutionized Decades Old Brokerage Industry” Oh yeah…It’s new and revolutionary to get a new generation to believe in day trading…..It’s only been around since the buttonwood tree. Seriously WTF is this guy thinking at Sequoia-.)
Average account size $4500 whipping around options…Yikes.
Total Payments From High-Frequency Trading Firms
What retail brokers make from selling customer orders, per dollar in the the average account.
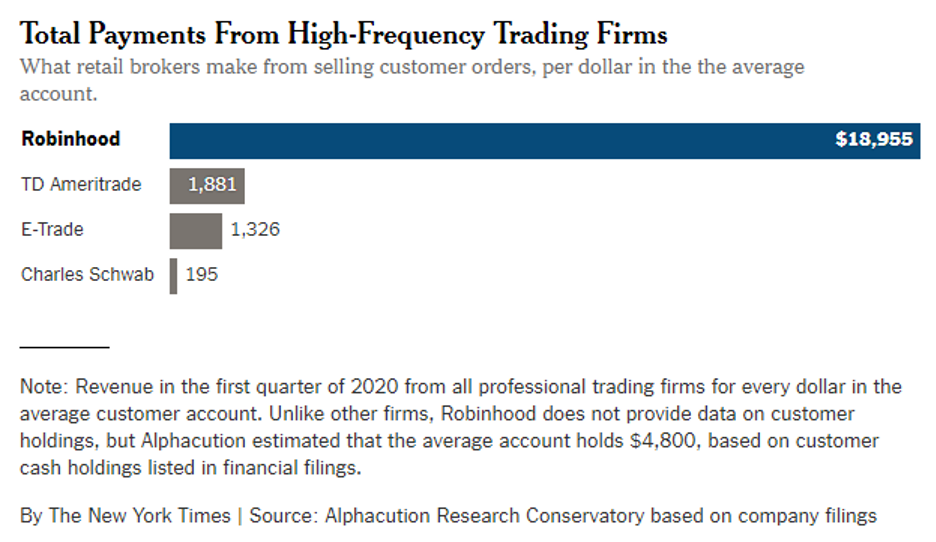
Robinhood Has Lured Young Traders, Sometimes With Devastating Results
Its users buy and sell the riskiest financial products and do so more frequently than customers at other retail brokerage firms, but their inexperience can lead to staggering losses.
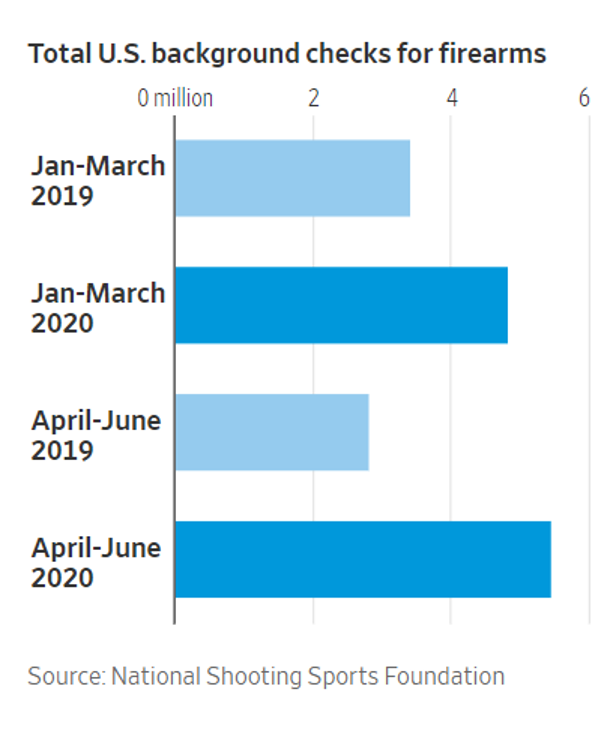
9. Gun Sales—June– Background Checks for Firearms Up 136% Year Over Year.
WSJ -Record Number of Americans Buy Guns Gun sales began rising to unusual highs in March, as coronavirus cases began surging in the U.S. and government-ordered lockdowns led to the highest unemployment levels since the Great Depression. The Federal Bureau of Investigation processed 7.8 million background checks for gun purchases from March to June, according to National Shooting Sports Foundation, a firearms industry trade group.
In June, background checks for firearms were up 136%, compared to a year earlier, according to the trade group, which gives the best proxy for gun sales. Background checks in June for civilians seeking a license to carry were the highest since the FBI began conducting checks 20 years ago. By Julie Wernau and Zusha Elinson
10. 31 SMALL STEPS TO UPGRADE YOUR LIFE AND BE BULLETPROOF
By: TEAM ASPREY Affiliate Disclosure & Health Claims
- Here’s the secret to transforming your diet, fitness, and mindset: Make small, positive changes that build up over time.
- When you upgrade your biology, you’re biohacking your way to a better life. That’s what being Bulletproof is all about.
- Below, you’ll find 31 steps to becoming a stronger, more resilient, more powerful you. Adopt one of the principles, or adopt them all.
- Use the hashtag #IamBulletproof on Instagram, Facebook, and Twitter so we can follow along on your journey.

Read Full Explanations at Dave Asprey Blog
Disclaimer
Lansing Street Advisors is a registered investment adviser with the State of Pennsylvania..
To the extent that content includes references to securities, those references do not constitute an offer or solicitation to buy, sell or hold such security as information is provided for educational purposes only. Articles should not be considered investment advice and the information contain within should not be relied upon in assessing whether or not to invest in any securities or asset classes mentioned. Articles have been prepared without regard to the individual financial circumstances and objectives of persons who receive it. Securities discussed may not be suitable for all investors. Please keep in mind that a company’s past financial performance, including the performance of its share price, does not guarantee future results.
Material compiled by Lansing Street Advisors is based on publically available data at the time of compilation. Lansing Street Advisors makes no warranties or representation of any kind relating to the accuracy, completeness or timeliness of the data and shall not have liability for any damages of any kind relating to the use such data.
Material for market review represents an assessment of the market environment at a specific point in time and is not intended to be a forecast of future events, or a guarantee of future results.
Indices that may be included herein are unmanaged indices and one cannot directly invest in an index. Index returns do not reflect the impact of any management fees, transaction costs or expenses. The index information included herein is for illustrative purposes only