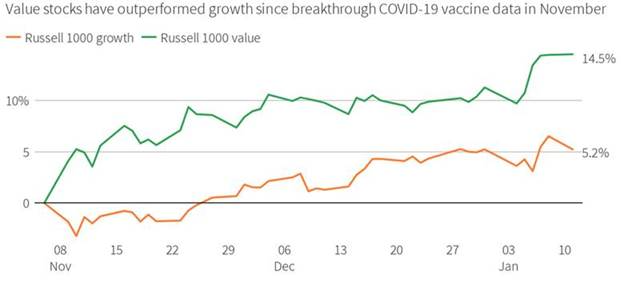
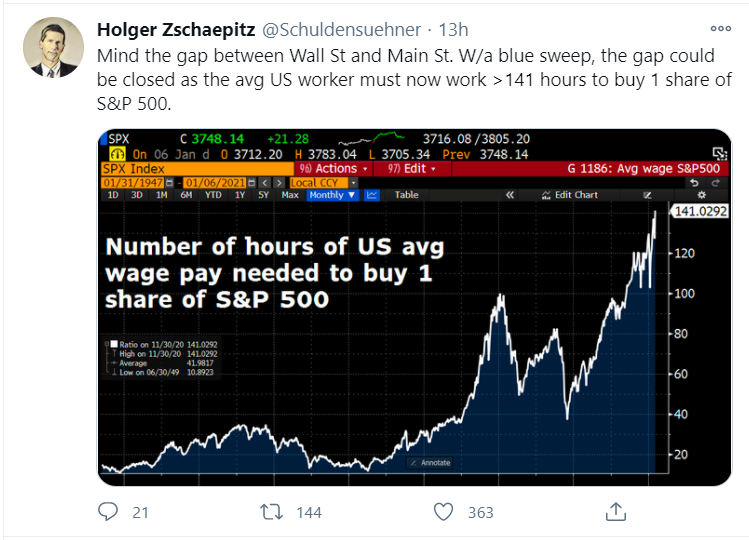
1. The Russell 1000 value index has jumped 14.5% since early November, nearly triple the gain of its growth-stock counterpart, which is dominated by technology
From Dave Lutz at Jones Trading
From Dave Lutz at Jones Trading
https://i0.wp.com/lplresearch.com/wp-content/uploads/2021/01/1.7.21-CADMU-Chart-1.png?ssl=1
Nasdaq Dorsey Wright

5 Year Breaking Out

10 Year About to Break Out

https://fred.stlouisfed.org/series/T5YIE
By Jonnelle Marte, Ann Saphir, Howard Schneider
(Reuters) – A recent rise in U.S. bond yields and market inflation expectations has bolstered Federal Reserve officials’ hopes that the central bank’s new monetary policy approach is taking hold and could be further buoyed if a Democratic-led Congress rolls out more spending.
FILE PHOTO: Federal Reserve Bank of Richmond President Thomas Barkin poses during a break at a Dallas Fed conference on technology in Dallas, Texas, U.S., May 23, 2019. REUTERS/Ann Saphir/File Photo/File Photo
“I am encouraged to see the rise in market indicators of inflation expectations. … That is what we are trying to support,” Richmond Federal President Thomas Barkin said on Thursday in an interview with Reuters.
Barkin said he regarded a recent rise in interest rates on Treasury bonds as also part of a “reflation trade,” a sign that investors were factoring future hikes in prices into their decisions by demanding higher interest rates, rather than representing a worrisome tightening of financial conditions.
“The ingredients for higher inflation are in place,” St. Louis Fed President James Bullard said in separate comments to reporters. “You have very powerful fiscal policy in place and perhaps more to come,” with Democrats now about to control the White House as well as the U.S. Senate and House of Representatives.
“You have a Fed that … wants to temporarily have inflation above target. You have the economy poised to boom at the end of the pandemic,” once the impact of new coronavirus vaccines is felt, Bullard said. The yield on the benchmark 10-year Treasury rose above 1.07% on Thursday, hitting its highest level since March. The 5-year forward inflation expectation rate hit nearly a two-year high of 2.05%.
‘INCREDIBLY DISAPPOINTING’
After nearly two years of study, the Fed in August changed its approach to monetary policy to allow for higher inflation, hoping to meet its 2% target on an average basis by letting prices drift higher for some time in order to offset years in which inflation had been weak. That would also allow, in theory, a lower unemployment rate since the central bank would try to sustain the sort of “hot” economy that leads to rising prices.
The massive uncertainty about the economy and the course of the pandemic late last summer has since given way to what Barkin said was more “clarity” around where things stand – with two coronavirus vaccines being distributed, fiscal buffers in place to help many American households, and consumers “not far away” from the point when they will “engage in the economy with a lot more confidence.”
The pace of the vaccine distribution will play a large role in when that happens, with some policymakers expressing dismay at the effort so far.
Philadelphia Fed President Patrick Harker called the early U.S. vaccination figures, with fewer than 5 million inoculated so far, “incredibly disappointing.”
But the events of the last few weeks do seem to have shifted market bets about the future, with trades in inflation-linked securities hinting that investors expect higher inflation and accept that the Fed will not stand in the way of it.
“We are looking at a long period where the fed funds rate will stay at essentially zero,” Harker said, referring to the central bank’s key overnight interest rate. He added that he saw no signs that “inflation is going to go out of control.”
Indeed, Chicago Fed President Charles Evans expressed more skepticism about the inflation to come, even with the additional government stimulus that might be on the way to help battle the economic fallout of the pandemic and the recession it triggered.
The boost to inflation from added fiscal spending, he told a bankers group on Thursday, is not “nearly as strong as I would like.”
Reporting by Jonnelle Marte, Howard Schneider and Ann Saphir; Editing by Paul Simao
Our Standards: The Thomson Reuters Trust Principles.
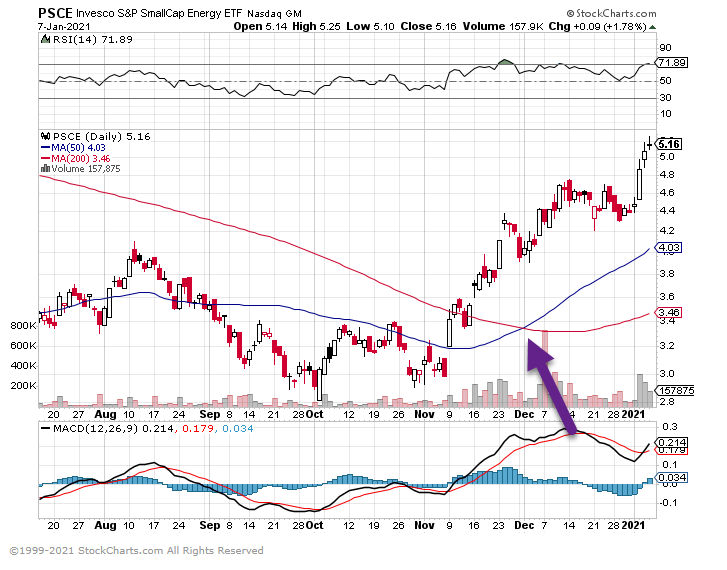
PSCE small cap energy ETF 50 day thru 200 day to upside +70% from lows

Ned Davis Research www.ndr.com
Wolf Street Blog
Another outstanding group of the Chapter 11 filers, vintage 2020, were the members of the Great American Oil & Gas Bust, such as Diamond Offshore, MC Dermott, Chesapeake Energy, California Resources, Denbury Resources, etc.
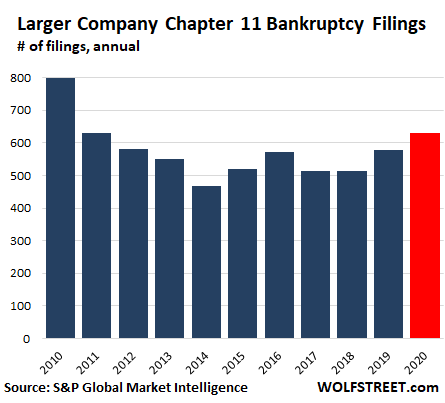
Among these larger companies, Chapter 11 filings, by sector, according to S&P Global:
But not included in the bankruptcy filing data are the many small companies that shut down quietly, with the owners working out deals with their creditors, landlords, banks, and credit card companies, without resorting to a bankruptcy filing. Many small retail stores, restaurants, and services businesses, such as hair and nail salons, fall into this category. Tens of thousands of restaurants are said to have shut down permanently due to the Pandemic.
How Will This Unwind? Amid Stimulus, Forbearance, Eviction Bans, Consumer Bankruptcies Dropped to Lowest in Decades. Commercial Chapter 11 Bankruptcies Highest in Yearsby Wolf Richter
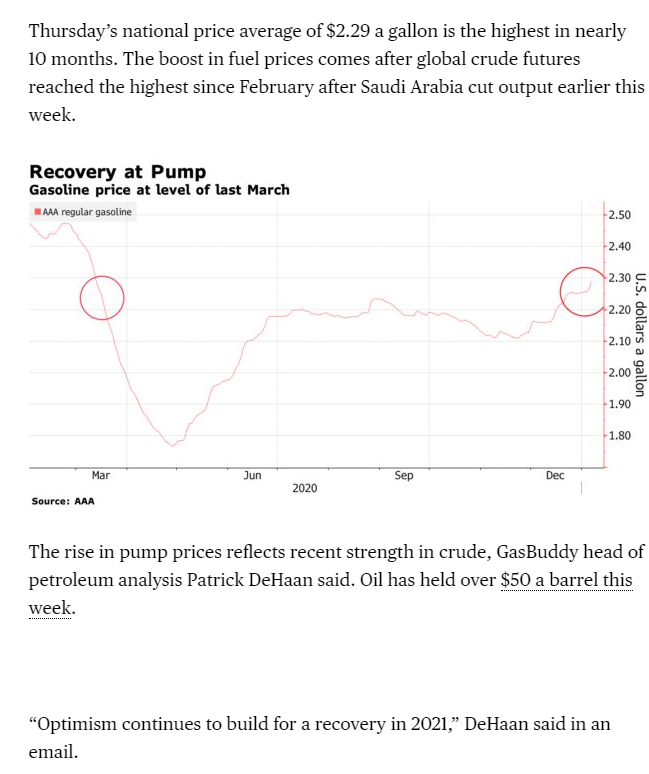
U.S. Drivers Paying Most at the Pump Since the Pandemic–By Jeffrey Bair
by Justin Talbot-Zorn and Leigh Marz
Summary. Taking time for silence restores the nervous system, helps sustain energy, and conditions our minds to be more adaptive and responsive. For example, silence is associated with the development of new cells in the hippocampus, the key brain region associated with learning and memory. But… more
In a recent interview with Vox’s Ezra Klein, journalist and author Ta-Nehisi Coates argued that serious thinkers and writers should get off Twitter.
It wasn’t a critique of the 140-character medium or even the quality of the social media discourse in the age of fake news.
It was a call to get beyond the noise.
For Coates, generating good ideas and quality work products requires something all too rare in modern life: quiet.
He’s in good company. Author JK Rowling, biographer Walter Isaacson, and psychiatrist Carl Jung have all had disciplined practices for managing the information flow and cultivating periods of deep silence. Ray Dalio, Bill George, California Governor Jerry Brown, and Ohio Congressman Tim Ryan have also described structured periods of silence as important factors in their success.
Recent studies are showing that taking time for silence restores the nervous system, helps sustain energy, and conditions our minds to be more adaptive and responsive to the complex environments in which so many of us now live, work, and lead. Duke Medical School’s Imke Kirste recently found that silence is associated with the development of new cells in the hippocampus, the key brain region associated with learning and memory. Physician Luciano Bernardi found that two-minutes of silence inserted between musical pieces proved more stabilizing to cardiovascular and respiratory systems than even the music categorized as “relaxing.” And a 2013 study in the Journal of Environmental Psychology, based on a survey of 43,000 workers, concluded that the disadvantages of noise and distraction associated with open office plans outweighed anticipated, but still unproven, benefits like increasing morale and productivity boosts from unplanned interactions.
But cultivating silence isn’t just about getting respite from the distractions of office chatter or tweets. Real sustained silence, the kind that facilitates clear and creative thinking, quiets inner chatter as well as outer.
This kind of silence is about resting the mental reflexes that habitually protect a reputation or promote a point of view. It’s about taking a temporary break from one of life’s most basic responsibilities: Having to think of what to say.
writes in a recent HBR article, “increase[s] your chances of encountering novel ideas and information and discerning weak signals.” When we’re constantly fixated on the verbal agenda—what to say next, what to write next, what to tweet next—it’s tough to make room for truly different perspectives or radically new ideas. It’s hard to drop into deeper modes of listening and attention. And it’s in those deeper modes of attention that truly novel ideas are found.
Even incredibly busy people can cultivate periods of sustained quiet time. Here are four practical ideas:
1) Punctuate meetings with five minutes of quiet time. If you’re able to close the office door, retreat to a park bench, or find another quiet hideaway, it’s possible to hit reset by engaging in a silent practice of meditation or reflection.
2) Take a silent afternoon in nature. You need not be a rugged outdoors type to ditch the phone and go for a simple two-or-three-hour jaunt in nature. In our own experience and those of many of our clients, immersion in nature can be the clearest option for improving creative thinking capacities. Henry David Thoreau went to the woods for a reason.
3) Go on a media fast. Turn off your email for several hours or even a full day, or try “fasting” from news and entertainment. While there may still be plenty of noise around—family, conversation, city sounds—you can enjoy real benefits by resting the parts of your mind associated with unending work obligations and tracking social media or current events.
4) Take the plunge and try a meditation retreat: Even a short retreat is arguably the most straightforward way to turn toward deeper listening and awaken intuition. The journalist Andrew Sullivan recently described his experience at a silent retreat as “the ultimate detox.” As he put it: “My breathing slowed. My brain settled…It was if my brain were moving away from the abstract and the distant toward the tangible and the near.”
The world is getting louder. But silence is still accessible—it just takes commitment and creativity to cultivate it.
Disclosure
Lansing Street Advisors is a registered investment adviser with the State of Pennsylvania..
To the extent that content includes references to securities, those references do not constitute an offer or solicitation to buy, sell or hold such security as information is provided for educational purposes only. Articles should not be considered investment advice and the information contain within should not be relied upon in assessing whether or not to invest in any securities or asset classes mentioned. Articles have been prepared without regard to the individual financial circumstances and objectives of persons who receive it. Securities discussed may not be suitable for all investors. Please keep in mind that a company’s past financial performance, including the performance of its share price, does not guarantee future results.
Material compiled by Lansing Street Advisors is based on publicly available data at the time of compilation. Lansing Street Advisors makes no warranties or representation of any kind relating to the accuracy, completeness or timeliness of the data and shall not have liability for any damages of any kind relating to the use such data.
Material for market review represents an assessment of the market environment at a specific point in time and is not intended to be a forecast of future events, or a guarantee of future results.
Indices that may be included herein are unmanaged indices and one cannot directly invest in an index. Index returns do not reflect the impact of any management fees, transaction costs or expenses. The index information included herein is for illustrative purposes only.