1.Summary of Valuation Metrics.
JP Morgan-2 charts Valuation Metrics and Drop in Capital Spending.
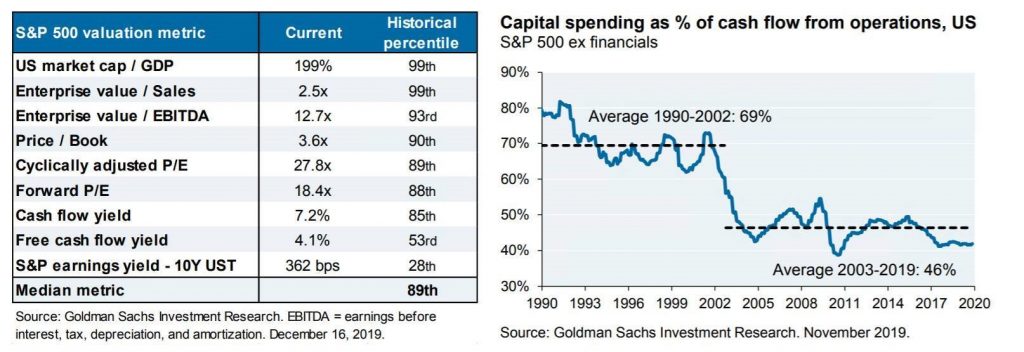
From JP Morgan 2020 Review.
https://privatebank.jpmorgan.com/content/dam/jpm-wm-aem/documents/eotm/eotm-outlook-2020-am.pdf
2.The P/E 10 Ratio
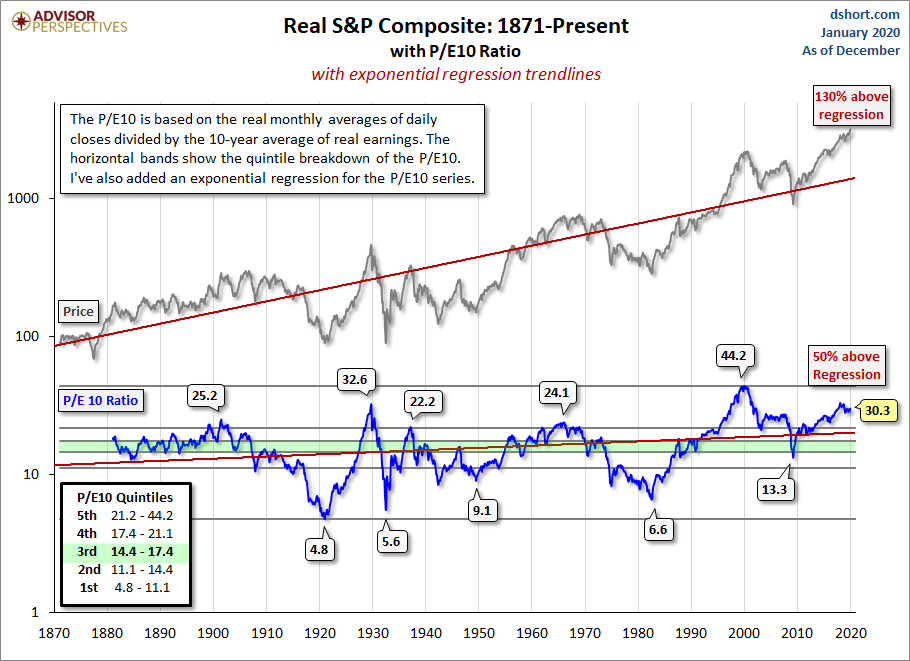
Is the Stock Market Cheap?by Jill Mislinski, 1/3/20
Read explanation of P/E 10
3.Reaction to Last 20 Middle East Crisis Events
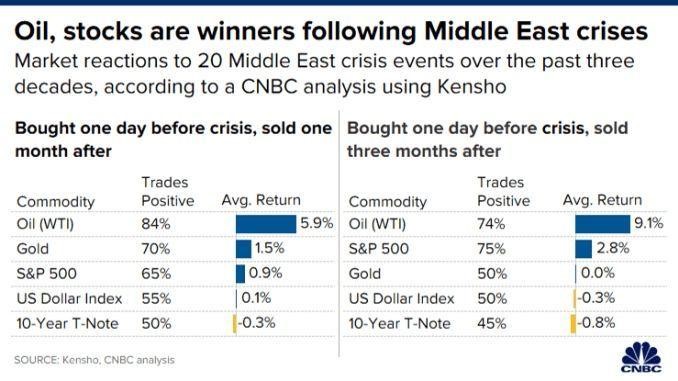
https://www.linkedin.com/feed/update/urn:li:activity:6619201157535539200/
4.Am I Diversified? Sector ETF Concentration.
Mon, Dec 30, 2019
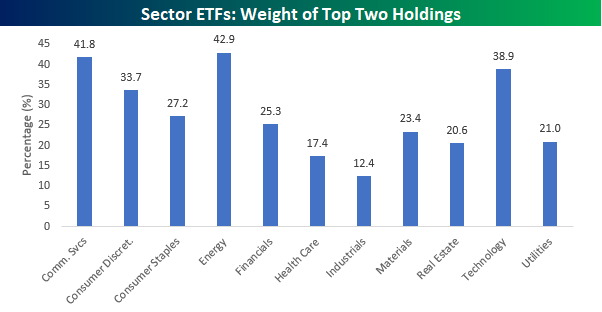
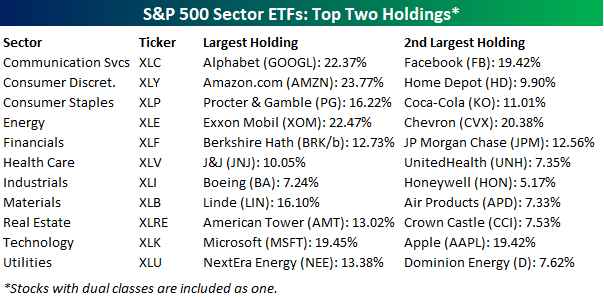
One of the primary drivers of the boom in ETFs over the last decade is that they provide efficient diversification to the market and various sectors/groups. While that’s the theory, the reality is that a number of the biggest sector ETF’s aren’t all that diversified at all. The chart below shows the weight of the top two holdings in each of the 11 S&P 500 sector ETFs. Would you believe that the two largest holdings in two ETFs account for more than 40% of the entire ETF, while in the ETFs for another two sectors the largest two components account for more than a third of the entire ETF? That’s right, in the Energy sector, the top two holdings (Exxon and Chevron) account for just under 43% of the entire ETF, while Alphabet (GOOGL) and Facebook (FB) account for 41.8% of the new Communications Services sector ETF (XLC). In the Tech sector, Apple (AAPL) and Microsoft (MSFT) account for just under 40% of the XLK ETF.
The table below lists each of the eleven sector ETFs along with their top two holdings. As noted, in the case of companies with dual-listed share classes in the ETF, we include both share classes as one. In the case of three sectors (Communication Services, Consumer Discretionary, and Energy), the top holding accounts for over 20% of the entire ETF. Normally, when you think about diversification, you would picture spreading out your bets across a variety of different companies so that you aren’t too exposed to any one name. However, when one out of every five dollars invested goes to one stock, we aren’t sure how diversified that really is. Now, the purpose of highlighting these top-heavy ETFs is in no way meant to imply that these ETFs are faulty in their construction. In fact, these ETFs do a very good job of tracking the sectors they are intended to track. Instead, it is an illustration of just how top-heavy the major indices have become. Investing in “the market” or a specific sector is increasingly becoming a concentrated bet on a number of large names. Start a two-week free trial to Bespoke Institutional to access our Trend Analyzer tool and track key trends in individual stocks and major ETFs.
©2020 Bespoke Investment Group
https://www.bespokepremium.com/interactive/posts/think-big-blog/am-i-diversified
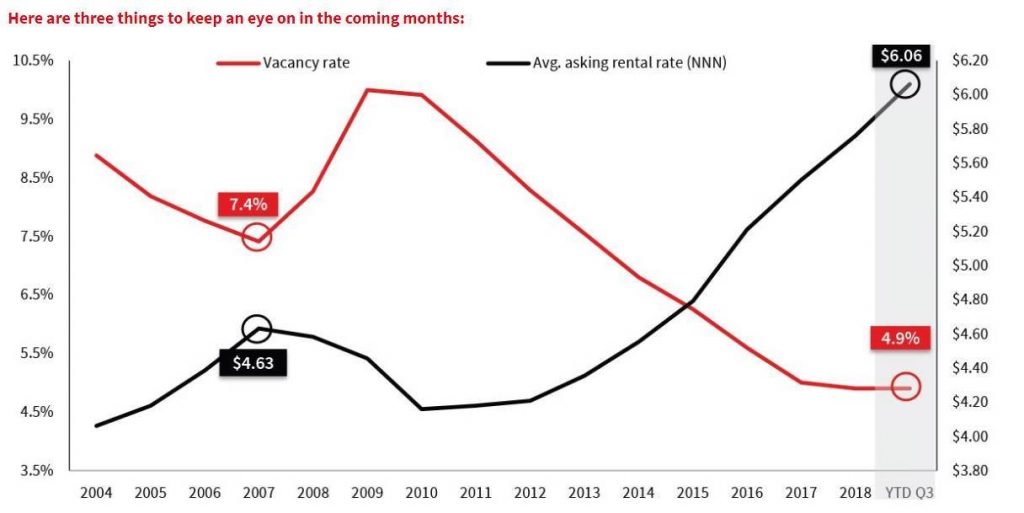
5.Vacancy Rates and Rent Increases Industrial and Warehouse.
https://www.us.jll.com/en/trends-and-insights/research/industrial-market-statistics-trends
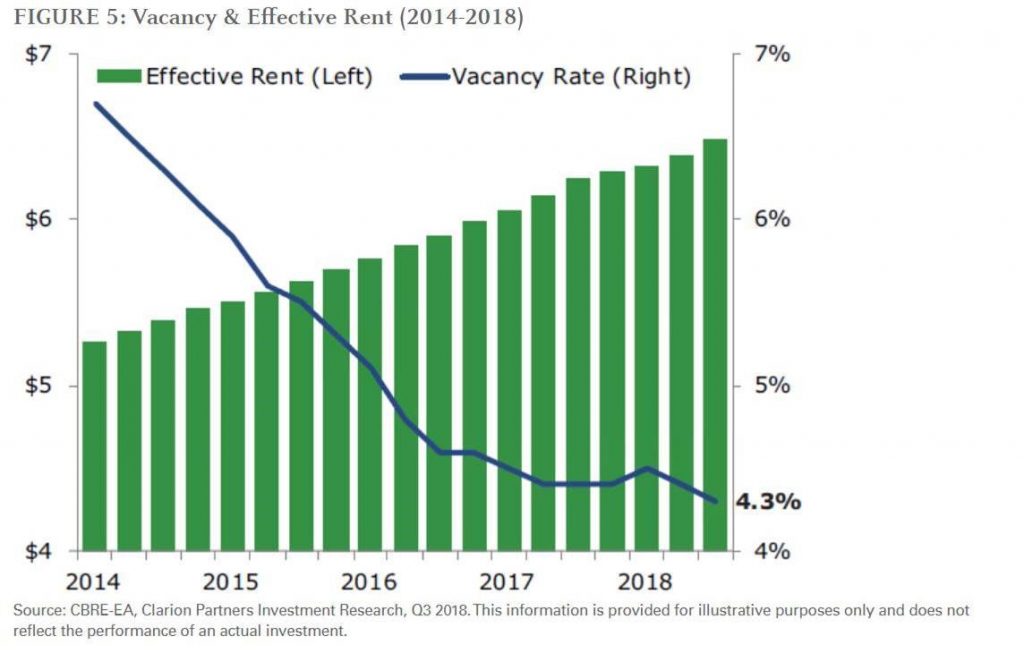
6.Commercial Real Estate Returns.
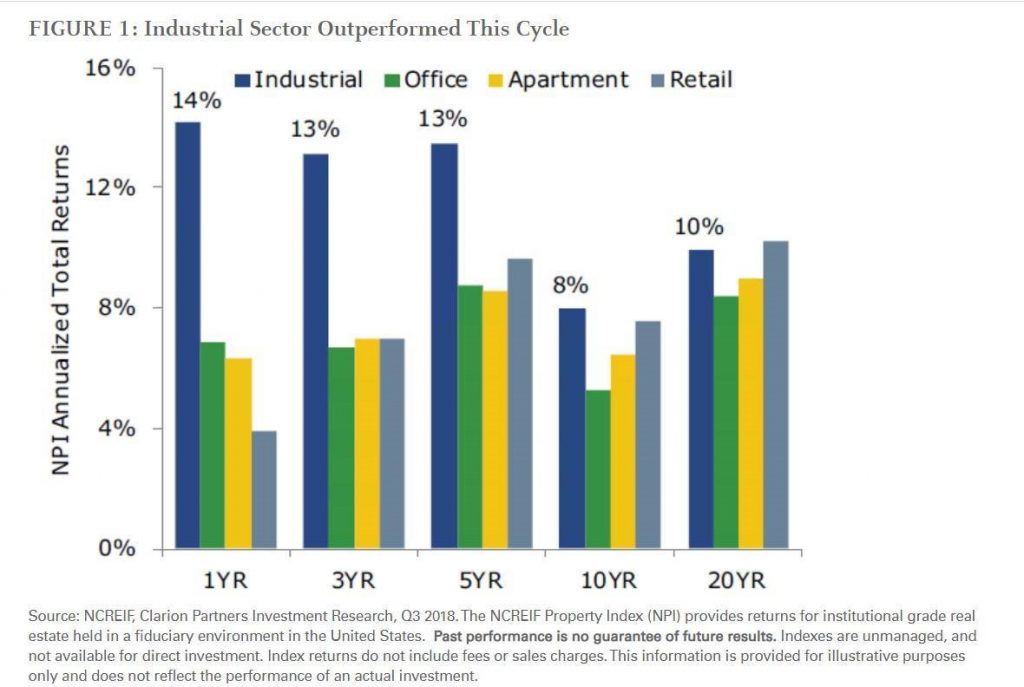
THE U.S. WAREHOUSE BOOM-Tim Wang, Julia Laumont, and Pedro Niño
https://www.leggmason.com/en-us/insights/investment-insights/us-warehouse-boom.html
7.And the final Retail Number is….9300
More than 9,300 stores are closing in 2019 as the retail apocalypse drags on — here’s the full list
Hayley Peterson
Dec 23, 2019, 1:25 PM

Retailers are closing thousands of stores. Seph Lawless
- -More than 9,300 stores are expected to close in 2019.
- -A.C. Moore, Sears, Kmart, Party City, Walgreens, and Barneys, are among the retailers that have recently announced store closings.
- –Charlotte Russe, Family Dollar, and Chico’s announced more than 1,100 store closures in a span of 24 hours.
- –Payless has said it plans to close all of its 2,500 stores in what could be the largest retail liquidation in history.
- The staggering rate of store closures that rocked the retail industry over the past couple of years continued in 2019, with retailers setting a new record for store closings over the last 12 months.
- Retailers announced plans to close more than 9,300 stores in 2019, smashing the previous record of roughly 8,000 store closures in 2017, according to an analysis by Business Insider.
- Here’s a list of all the stores closing this year:
://www.businessinsider.com/stores-closing-in-2019-list-2019-3
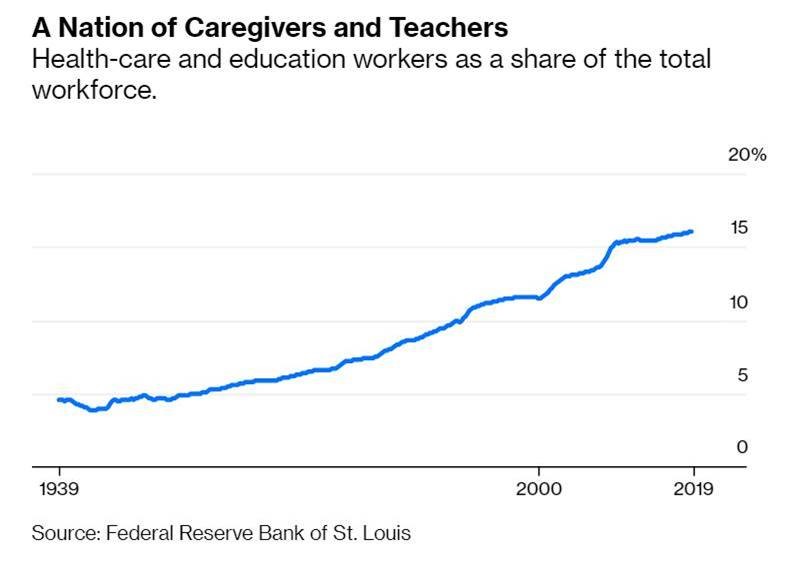
8. Cost of Healthcare and Education vs. Wages. The Paradox is the 2 Industries Create a Massive Amount of Jobs.
Americans are increasingly anxious about the costs of services such as health care and education. But these are the very same industries that increasingly sustain the middle class. Resolving this paradox is the key to creating the economy of the future.
It’s not much of a surprise to note that prices for most physical goods have dropped, but the cost of big-ticket services have become much higher:
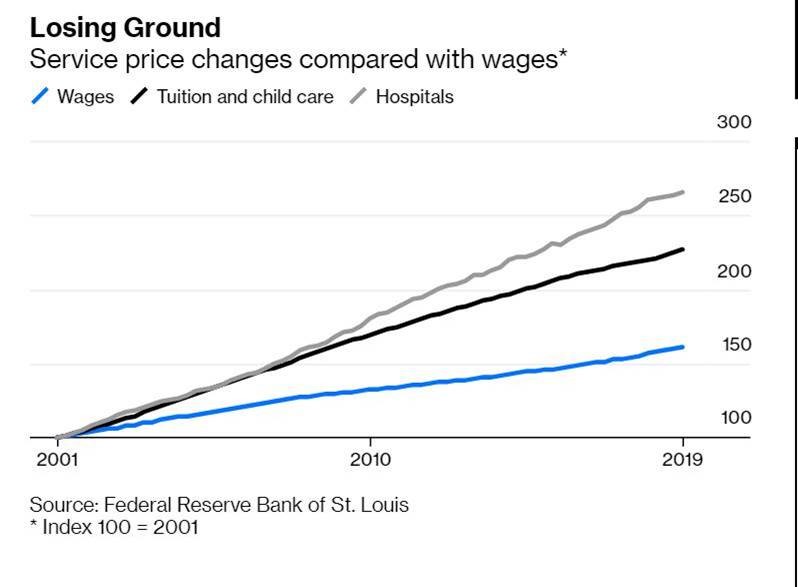
The Middle Class Risks Consuming Itself
Health care and education employ a lot of people and sell services they increasingly can’t afford.By Noah Smith
9.The Best 50 Wines Under $50
Light and Rich Reds
2017 Veramonte Pinot Noir ($11)
It’s hard to find any wine worth drinking for this price, much less a pinot
noir. This scented, fruity example from Chile’s cool Casablanca Valley is a
great party pour.
NV Bedrock Shebang Red ($15)
Bold and bright, this California blend of zinfandel and more than seven other
varieties from old vineyards is consistently satisfying.
2015 Quinta Do Chocapalha ($19)
Star winemaker Sandra Tavares makes this violet-scented, softly plush blend
from four Portuguese varieties at her family’s property outside Lisbon.
2019 Louis Antoine Luyt Pipeno Pais Portezuelo
($20)
This casual, fresh Chilean red in a liter bottle is a chuggable vin de soif
(thirst quencher). Made from the pais grape, it’s resembles a smoky Beaujolais.
Serve slightly chilled.
2010 Sotheby’s Haut Medoc ($25)
A classic cabernet from a great vintage, this red is rich, suave, and very
smooth, with notes of tobacco and deep fruit.
2016 Aslina Cabernet Sauvignon ($26)
Launched in 2016, this is the new label of South Africa’s first female black
winemaker. Her minty cabernet is like a mid-point between Bordeaux and Napa.
2017 Decibel Gimblett Gravels Malbec ($26)
Hawke’s Bay, New Zealand is a source of fine cabernets, and turns out to be
great for malbec, too. This one is brighter and more floral than Argentinean
examples.
2018 Wilde Farm Wines Fox Hill Dolcetto ($28)
This gulpable red from cool Mendocino is like a deliciously soft, fruity-fresh
Beaujolais, and made with no added sulfur.
2018 Loveblock Pinot Noir ($30)
After selling his eponymous winery, New Zealand legend Kim Crawford and his
wife launched Loveblock. Their pinot, from Central Otago, is darkly fruity with
sweet berry flavors.
2016 Petrolo Torrione ($30)
This Tuscan cult winery makes a killer entry-level red blend of mostly
sangiovese, with some cabernet sauvignon and merlot.
2017 La Marchigiana Criolla Chica ($39)
The Argentinean Catena family just launched a new line of natural wines, aged
in clay pots. My favorite is this juicy red from criolla chica grapes.
2017 Lingua Franca Avni Pinot Noir ($39)
Oregon is a hotbed of new producers. The third vintage of this silky-textured
red is filled with vibrant, fragrant fruit.
2017 Domaine Nico Histoire d’A ($47)
This new Mendoza estate debuted its first single vineyard pinot noirs last
month. The best one has a spicy, earthy sexiness and mineral edge.
2016 Silverado Vineyards Cabernet Sauvignon
($50)
A plummy, balanced Napa cab that doesn’t break the bank is hard to find. This
is it.
Private Wealth Magazine-Read Rest of List.
https://www.fa-mag.com/news/the-best-50-wines-under–50-53228.html?section=75&page=4
10. 2020: What a Time To Be Alive
Jan 2, 2020 by Morgan Housel
Acommon theme in history is that progress happens too slowly to notice while setbacks happen too quickly to overlook. There are many overnight tragedies. There are no overnight miracles.
It’s a shame, because the amount of progress we’ve made during most of our lifetimes is both astounding and overlooked.
A new year brings dozens of articles analyzing what the past brought and what the future may hold. The problem with most these pieces is not their analysis; it’s their time frame. Analyzing 2020’s improvement over 2019 – or even a decade of progress – leaves you gasping for goofy things like “OLED screens will become more common this year” and “self-driving cars will see marginal improvements.”
When measuring progress we have to remember that it took 15 years from the time penicillin was discovered until it was widely used, and 20 years from the invention of the car until the time Henry Ford figured out mass production. These things take time.
The median American is 38 years old. If we use their birth year of 1981 as a starting point to measure progress during their lives, some astounding figures arise.
In 1981 the auto fatality rate was 21.49 per 100,000 people. In 2018 it was 11.18. The decline means every hour of every day in 2019 almost four Americans who would have died in 1981 did not die. Over the last decade, improved auto safety has saved the lives of a group of Americans equal to the population of Cincinnati.
Cumulative inflation in the five years before 1981 was more than cumulative inflation in the 25 years before 2020. It’s hard to overstate the calming effect this has on society, and we barely discuss it.
The homicide rate was just over 10 per 100,000 Americans in 1981, and 5.0 in 2018. That decline means 16,000 fewer Americans were murdered last year than would have been had the rate not improved during most of our lifetimes.
Infant mortality has fallen by 54%, from 12.1 per 1,000 births in 1981 to 5.6 in 2018. In 2019, 24,700 fewer parents buried an infant than would have if the rate not declined since 1981. Over the last decade there have been something like 210,000 fewer infant deaths relative to the rates seen in 1981, which is equal to the population of Rochester, New York.
Average miles per gallon among all vehicles has increased from 14.9 in 1981 to 22.3 in 2017. That alone cuts effective gasoline prices by a third.
Adjusted for inflation, median personal income has increased from $22,682 in 1981 to $33,706 in 2018. On an annual basis that growth is barely noticeable. But in most of our lifetimes the median worker has become almost 50% richer.
In the ten years before 1981, 25,995 people died in commercial aviation accidents. From 2009 to 2019 that number was 9,197. And passenger miles flown increased 4.7-fold from 1981 to 2019. So fatalities per passenger mile flown have declined more than 90%. A passenger who flies once a month today is safer than one who flew once a year in 1981.
The number of cigarettes smoked in the United States peaked in 1981 at 640 billion. By 2017 it was 249 billion and falling. That equates to 11,574 fewer cigarettes smoked every second.
Heart-disease deaths have declined from over 400 per 100,000 Americans in 1981 to 168 per 100,000 by 2015. That decline means 754,000 fewer Americans die each year than would have had there been no improvement since 1981. That’s equal to the number of Americans killed in World War II, saved every seven months.
In 1981 IBM sold its 5150 PC for $1,556, or $4,402 adjusted for inflation. It was effectively useless. Today the same amount of money can buy a Chromebook for every student in an average middle-school class.
Age- and sex-adjusted dementia rates have declined 44% since the early 1980s. The decline means 5.2 million fewer Americans have dementia today relative to the rates seen 38 years ago – about the size of Los Angeles and Dallas combined. No one knows quite why this is, but better blood pressure control is a leading theory.
A pessimist will have no problem pointing out the world’s problems in 2020. Bad news is real and it is everywhere. Throw a rock, hit a problem.
The difference between an optimist and a pessimist isn’t usually over substance. It’s the time frame they’re looking at. Problems are easier to spot today, but progress is almost always more powerful over time.
https://www.collaborativefund.com/blog/2020-what-a-time-to-be-alive/